CumulativeFeatureImpactPlot[model,data]
绘制 data 中每个特征的值对 model 结果的累积影响.
CumulativeFeatureImpactPlot[model]
使用合成数据估计特征的影响.
CumulativeFeatureImpactPlot[modelfname,…]
只绘制指定特征 fname 的影响.
CumulativeFeatureImpactPlot[modelfnameclass,…]
只绘制对分类 class 的影响.
CumulativeFeatureImpactPlot
CumulativeFeatureImpactPlot[model,data]
绘制 data 中每个特征的值对 model 结果的累积影响.
CumulativeFeatureImpactPlot[model]
使用合成数据估计特征的影响.
CumulativeFeatureImpactPlot[modelfname,…]
只绘制指定特征 fname 的影响.
CumulativeFeatureImpactPlot[modelfnameclass,…]
只绘制对分类 class 的影响.
更多信息和选项
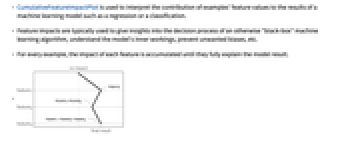
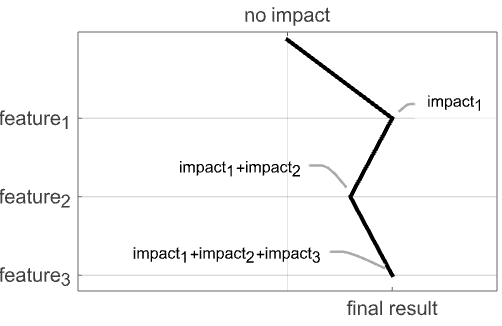
- CumulativeFeatureImpactPlot 用于解释样例的特征值对机器学习模型(如回归或分类)结果的贡献.
- 特征影响通常用于增进对之前如“黑盒”般的机器学习算法的决策过程的了解,以便掌握模型的内部工作原理,防止不必要的偏差等.
- 对于每个样例,累积每个特征的影响,直到它们完全解释模型的结果.
- 对预测器所得结果的最终影响是平均预测的偏差.
- 对分类器的最终影响是与给定类别的先验对数几率的偏差.
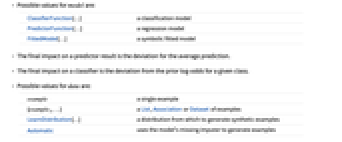
- model 可取的值为:
-
ClassifierFunction[…] 分类模型 PredictorFunction[…] 回归模型 FittedModel[…] 符号式拟合模型 - data 可取的值为:
-
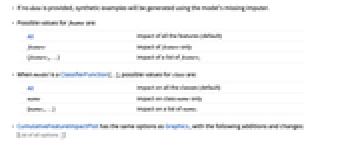
example 一个样例 {example1,…} 样例组成的 List、Association 或 Dataset LearnDistribution[…] 从中生成合成样例的分布 Automatic 用模型的缺失值估算器生成样例 - 如果没有提供 data,将使用模型的缺失值估算器生成样例.
- fname 可取的值为:
-
All 所有特征造成的影响(默认) feature feature 造成的影响 {feature1,…} 一组 featurei 造成的影响 - 当 model 是一个 ClassifierFunction[…] 时,class 可取的值为:
-
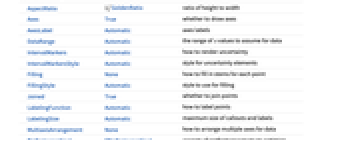
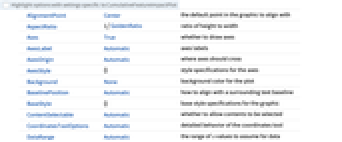
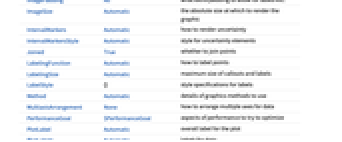
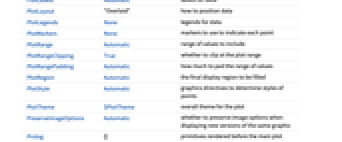
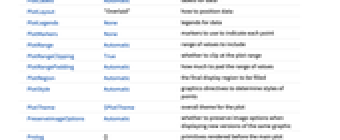
All 对所有类别的影响(默认) name 对 name 类别的影响 {name1,…} 对一组类别 namei 的影响 - CumulativeFeatureImpactPlot 有与 Graphics 相同的选项,不同之处和更多选项如下所示: [所有选项的列表]
-
AspectRatio 1/GoldenRatio 高宽比 Axes True 是否绘制坐标轴 AxesLabel Automatic 坐标轴的标签 DataRange Automatic 假定的数据的 x 值的范围 IntervalMarkers Automatic 怎样表示不确定性 IntervalMarkersStyle Automatic 不确定元素的样式 Filling None 如何填充各个点的茎杆 FillingStyle Automatic 填充使用的样式 Joined True 是否将每个点都连起来 LabelingFunction Automatic 如何标记点 LabelingSize Automatic callout 和标签的最大尺寸 MultiaxisArrangement None 如何排列数据的多个轴 PerformanceGoal $PerformanceGoal 优化的目标 PlotLabel Automatic 绘图的整体标签 PlotLabels Automatic 数据的标签 PlotLayout "Overlaid" 怎样放置数据 PlotLegends None 数据的图例 PlotMarkers None 用于标识每个点的标记 PlotRange Automatic 要包含的值的范围 PlotRangeClipping True 在绘图范围边界处是否进行剪切 PlotStyle Automatic 确定点的样式的图形指令 PlotTheme $PlotTheme 绘图的整体外观主题 ScalingFunctions Automatic 怎样缩放个别坐标 TargetUnits Automatic 显示在绘图中的单位
所有选项的列表
范例
打开所有单元 关闭所有单元基本范例 (2)
examples = {{0.66, False} -> 3.3, {0.95, False} -> 4.75, {0.87, False} -> 4.35, {0.79, True} -> 1.95, {0.34, True} -> -0.3, {0.88, True} -> 2.4, {0.56, True} -> 0.8, {0.07, True} -> -1.65, {0.41, False} -> 2.05, {0.06, False} -> 0.3};predictor = Predict[examples]CumulativeFeatureImpactPlot[predictor, {{0, True}, {0, False}, {1, True}, {1, False}}]在 Titanic Survival 数据集上训练分类模型:
data = ResourceData["Sample Data: Titanic Survival"];model = Classify[data -> "SurvivalStatus", Method -> "GradientBoostedTrees"]First[data]可视化所有特征对某些样例的 "survived" 类别的累积影响:
CumulativeFeatureImpactPlot[model -> All -> "survived", {<|"Class" -> "1st", "Age" -> Quantity[20, "Years"], "Sex" -> "female"|>, <|"Class" -> "2nd", "Age" -> Quantity[10, "Years"], "Sex" -> "female"|>,
<|"Class" -> "2nd", "Age" -> Quantity[5, "Years"], "Sex" -> "male"|>, <|"Class" -> "3rd", "Age" -> Quantity[50, "Years"], "Sex" -> "male"|>}]范围 (4)
model = Predict[{{1.3, "P"} -> 1, {1.8, "Q"} -> 2.5, {1.9, "Q"} -> 3, {0.2, "P"} -> 1, {-3.2, "P"} -> -4.2, {0.3, "Q"} -> 2}]CumulativeFeatureImpactPlot[model, {{1, "Q"}, {2, "P"}, {-1, "Q"}}]model = Classify[{{1.5, Blue} -> "A", {3.2, Blue} -> "A", {4.1, Red} -> "B", {5.3, Red} -> "B", {10., Green} -> "C", {12.4, Red} -> "C"}]CumulativeFeatureImpactPlot[model, {{1.5, Blue}, {5, Blue}, {1.5, Red}, {5, Red}}]model = Predict[{{1.3, "P"} -> 1, {1.8, "Q"} -> 2.5, {1.9, "Q"} -> 3, {0.2, "P"} -> 1, {-3.2, "P"} -> -4.2, {0.3, "Q"} -> 2}]CumulativeFeatureImpactPlot[model]model = Classify[{{1.5, Blue} -> "A", {3.2, Blue} -> "A", {4.1, Red} -> "B", {5.3, Red} -> "B", {10., Green} -> "C", {12.4, Red} -> "C"}]CumulativeFeatureImpactPlot[model -> All -> "A", {{1.5, Blue}, {5, Blue}, {1.5, Red}, {5, Red}}]CumulativeFeatureImpactPlot[model -> All -> {"A", "C"}, {{1.5, Blue}, {5, Blue}, {1.5, Red}, {5, Red}}]应用 (1)
Model Analysis (1)
winedata = ResourceData["Sample Data: Wine Quality"];predictor = Predict[winedata -> "WineQuality"]sample = RandomSample[winedata, 10];CumulativeFeatureImpactPlot[predictor, sample]bestbymodel = TakeLargestBy[winedata, predictor, 50];虽然大多数葡萄酒由于酒精含量而得分很高,但顶级的葡萄酒由挥发性酸度决定:
CumulativeFeatureImpactPlot[predictor, bestbymodel]CumulativeFeatureImpactPlot[predictor, TakeLargestBy[winedata, "WineQuality", 50]]文本
Wolfram Research (2022),CumulativeFeatureImpactPlot,Wolfram 语言函数,https://reference.wolfram.com/language/ref/CumulativeFeatureImpactPlot.html.
CMS
Wolfram 语言. 2022. "CumulativeFeatureImpactPlot." Wolfram 语言与系统参考资料中心. Wolfram Research. https://reference.wolfram.com/language/ref/CumulativeFeatureImpactPlot.html.
APA
Wolfram 语言. (2022). CumulativeFeatureImpactPlot. Wolfram 语言与系统参考资料中心. 追溯自 https://reference.wolfram.com/language/ref/CumulativeFeatureImpactPlot.html 年
BibTeX
@misc{reference.wolfram_2026_cumulativefeatureimpactplot, author="Wolfram Research", title="{CumulativeFeatureImpactPlot}", year="2022", howpublished="\url{https://reference.wolfram.com/language/ref/CumulativeFeatureImpactPlot.html}", note=[Accessed: 13-September-2026]}
BibLaTeX
@online{reference.wolfram_2026_cumulativefeatureimpactplot, organization={Wolfram Research}, title={CumulativeFeatureImpactPlot}, year={2022}, url={https://reference.wolfram.com/language/ref/CumulativeFeatureImpactPlot.html}, note=[Accessed: 13-September-2026]}