

FeatureValueDependencyPlot
FeatureValueDependencyPlot[model,data]
model の結果が data 中の特定の特徴値に依存する様子をプロットする.
FeatureValueDependencyPlot[model]
合成データを使って特徴値に対する依存性を除去する.
FeatureValueDependencyPlot[modelfname,…]
指定された特徴 fname の依存性だけをプロットする.
FeatureValueDependencyPlot[modelfnameclass,…]
分類 class の依存性だけをプロットする.
詳細とオプション
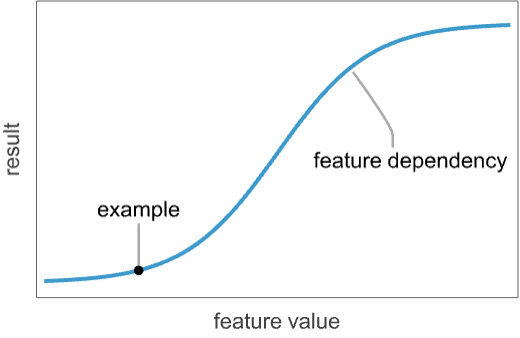
- FeatureValueDependencyPlotは,回帰や分類等の機械学習モデルの結果に対する例の特徴値の貢献を解釈するために使われる.
- すべての例について,単一の例の特徴の値を変えながら model の結果をプロットする.
- 次は,model の可能な値である.
-
ClassifierFunction[…] 分類モデル PredictorFunction[…] 回帰モデル - 分類器についてのモデルの結果はクラス確率である.予測器についてのそれは予測された値である.
- 次は,data の可能な値である.
-
example 単一の例 {example1,…} 例の List,Associationあるいは Dataset Automatic モデルの欠落代入法を使って例を生成する - data が与えられていない場合は,モデルの欠落代入法を使って合成例が生成される.
- 次は,fname の可能な値である.
-
All すべての特徴のインパクト(デフォルト) feature feature のインパクトのみ {feature1,…} featureiのリストのインパクト - 次は,model がClassifierFunction[…]のときの class の可能な値である.
-
All すべてのクラスについてのインパクト(デフォルト) name name というクラスについてのインパクトのみ {name1,…} nameiのリストについてのインパクト - FeatureImpactPlotにはGraphicsと同じオプションに以下の追加・変更を加えたものが使える. [全オプションのリスト]
-
AspectRatio 1/GoldenRatio 縦横比 Axes True 軸を描くかどうか AxesLabel Automatic 軸のラベル DataRange Automatic データに仮定する x の値の範囲 IntervalMarkers Automatic 不確かさをどのように描画するか IntervalMarkersStyle Automatic 不確かな要素のスタイル Filling None 各点の幹をどのように塗り潰すか FillingStyle Automatic 塗潰しのスタイル Joined True 点を繋ぐかどうか LabelingFunction Automatic 点にどのようにラベルを付けるか LabelingSize Automatic コールアウトとラベルの最大サイズ MultiaxisArrangement None データのついての複数の軸の配置方法 PerformanceGoal $PerformanceGoal 最適化しようとするパフォーマンスの局面 PlotLabel Automatic プロットの全体的なラベル PlotLabels Automatic データのラベル PlotLayout "Overlaid" データの配置方法 PlotLegends None データの凡例 PlotMarkers None 各点を識別するためのマーカー PlotRange Automatic 含める値の範囲 PlotRangeClipping True プロット範囲で切り取るかどうか PlotStyle Automatic 点のスタイルを決定するグラフィックス指示子 PlotTheme $PlotTheme プロットの全体的なテーマ ScalingFunctions Automatic 個々の座標をどのようにスケールするか TargetUnits Automatic プロット内に表示する単位
全オプションのリスト
例題
すべて開く すべて閉じる例 (1)
タイタニック号の生存者に関するデータ集合について分類モデルを訓練する:
data = ResourceData["Sample Data: Titanic Survival"];
model = Classify[data -> "SurvivalStatus"]First[data]10人のランダムな乗客の年齢を変えることが生存確率にどのように影響するかを可視化する:
sample = RandomSample[data, 10];
FeatureValueDependencyPlot[model -> "Age" -> "survived", sample]
スコープ (3)
model = Predict[{{1.3, "P"} -> 1, {1.8, "Q"} -> 2.5, {1.9, "Q"} -> 3, {0.2, "P"} -> 1, {-3.2, "P"} -> -4.2, {0.3, "Q"} -> 2}]FeatureValueDependencyPlot[model, {{-5, "Q"}, {5, "P"}}]model = Classify[{{1.5, Blue} -> "A", {3.2, Blue} -> "A", {4.1, Red} -> "B", {5.3, Green} -> "B", {10., Green} -> "B", {12.4, Red} -> "A"}]FeatureValueDependencyPlot[model, {{0, Blue}, {9, Red}, {20, Green}}]FeatureValueDependencyPlot[model -> 1 -> "A", {{0, Blue}, {9, Red}, {20, Green}}]model = Predict[{...}]FeatureValueDependencyPlot[model]オプション (5)
ColorFunction (1)
MaxPlotPoints (1)
PlotLabel (1)
プロットには特徴とクラスによって自動的にラベルが付けられる:
model = Classify[{{1.5, Blue} -> "A", {3.2, Blue} -> "A", {4.1, Red} -> "B", {5.3, Green} -> "B", {10., Green} -> "B", {12.4, Red} -> "A"}];FeatureValueDependencyPlot[model -> "f1" -> "B", {{0, Blue}, {9, Red}, {20, Green}}]PlotLabelNoneを使ってラベルを表示しないようにする:
FeatureValueDependencyPlot[model -> "f1" -> "B", {{0, Blue}, {9, Red}, {20, Green}}, PlotLabel -> None]PlotPoints (1)
model = Predict[{...}]FeatureValueDependencyPlot[model -> 1, PlotPoints -> 10]PlotPointsの値が高いとモデルの非線形性がハイライトされる:
Table[FeatureValueDependencyPlot[model -> 1, PlotPoints -> p], {p, {4, 20, 100}}]テキスト
Wolfram Research (2022), FeatureValueDependencyPlot, Wolfram言語関数, https://reference.wolfram.com/language/ref/FeatureValueDependencyPlot.html.
CMS
Wolfram Language. 2022. "FeatureValueDependencyPlot." Wolfram Language & System Documentation Center. Wolfram Research. https://reference.wolfram.com/language/ref/FeatureValueDependencyPlot.html.
APA
Wolfram Language. (2022). FeatureValueDependencyPlot. Wolfram Language & System Documentation Center. Retrieved from https://reference.wolfram.com/language/ref/FeatureValueDependencyPlot.html