

FeatureValueDependencyPlot
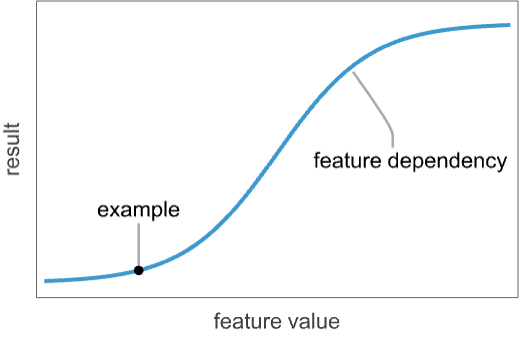
FeatureValueDependencyPlot[model,data]
plots the dependency of the result of model on the value of a particular feature in data.
FeatureValueDependencyPlot[model]
estimates the feature value dependency using synthetic data.
FeatureValueDependencyPlot[modelfname,…]
plots only the dependency on the specified feature fname.
FeatureValueDependencyPlot[modelfnameclass,…]
plots only the dependency on the classification class.
Details and Options
- FeatureValueDependencyPlot is used to interpret the contribution of examples' feature values to the results of a machine learning model, such as a regression or a classification.
- For every example, the result of model is plotted while changing the value of a single example feature.
- Possible values for model are:
-
ClassifierFunction[…] a classification model PredictorFunction[…] a regression model - For a classifier, the model result is a class probability. For a predictor, it is the predicted value.
- Possible values for data are:
-
example a single example {example1,…} a List, Association or Dataset of examples Automatic uses the model's missing imputer to generate examples - If no data is provided, synthetic examples will be generated using the model's missing imputer.
- Possible values for fname are:
-
All impact of all the features (default) feature impact of feature only {feature1,…} impact of a list of featurei - When model is a ClassifierFunction[…], possible values for class are:
-
All impact on all the classes (default) name impact on class name only {name1,…} impact on a list of namei - FeatureValueDependencyPlot has the same options as Graphics, with the following additions and changes: [List of all options]
-
AspectRatio 1/GoldenRatio ratio of height to width Axes True whether to draw axes AxesLabel Automatic axes labels DataRange Automatic the range of x values to assume for data IntervalMarkers Automatic how to render uncertainty IntervalMarkersStyle Automatic style for uncertainty elements Filling None how to fill in stems for each point FillingStyle Automatic style to use for filling Joined True whether to join points LabelingFunction Automatic how to label points LabelingSize Automatic maximum size of callouts and labels MultiaxisArrangement None how to arrange multiple axes for data PerformanceGoal $PerformanceGoal aspects of performance to try to optimize PlotLabel Automatic overall label for the plot PlotLabels Automatic labels for data PlotLayout "Overlaid" how to position data PlotLegends None legends for data PlotMarkers None markers to use to indicate each point PlotRange Automatic range of values to include PlotRangeClipping True whether to clip at the plot range PlotStyle Automatic graphics directives to determine styles of points PlotTheme $PlotTheme overall theme for the plot ScalingFunctions Automatic how to scale individual coordinates TargetUnits Automatic units to display in the plot
List of all options
Examples
open all close allBasic Examples (1)
Train a classification model on the Titanic Survival dataset:
data = ResourceData["Sample Data: Titanic Survival"];
model = Classify[data -> "SurvivalStatus"]
The survival probability depends on age, sex and class:
First[data]Visualize how changing the age of 10 random passengers influences their survival probability:
sample = RandomSample[data, 10];
FeatureValueDependencyPlot[model -> "Age" -> "survived", sample]
Scope (3)
Visualize the dependency of the prediction on a continuously varying feature value:
model = Predict[{{1.3, "P"} -> 1, {1.8, "Q"} -> 2.5, {1.9, "Q"} -> 3, {0.2, "P"} -> 1, {-3.2, "P"} -> -4.2, {0.3, "Q"} -> 2}]FeatureValueDependencyPlot[model, {{-5, "Q"}, {5, "P"}}]Visualize the dependency of each class probability in a classifier:
model = Classify[{{1.5, Blue} -> "A", {3.2, Blue} -> "A", {4.1, Red} -> "B", {5.3, Green} -> "B", {10., Green} -> "B", {12.4, Red} -> "A"}]FeatureValueDependencyPlot[model, {{0, Blue}, {9, Red}, {20, Green}}]FeatureValueDependencyPlot[model -> 1 -> "A", {{0, Blue}, {9, Red}, {20, Green}}]Use synthetic data to compute the impacts:
model = Predict[{...}]FeatureValueDependencyPlot[model]Options (5)
ColorFunction (1)
Specify a custom color function:
model = Predict[{...}]FeatureValueDependencyPlot[model -> 1, ColorFunction -> Hue]Use both coordinates to define the plot color:
FeatureValueDependencyPlot[model -> 1, ColorFunction -> Function[{x, y}, Hue[y, x]]]MaxPlotPoints (1)
PlotLabel (1)
Plots are automatically labeled by feature and class:
model = Classify[{{1.5, Blue} -> "A", {3.2, Blue} -> "A", {4.1, Red} -> "B", {5.3, Green} -> "B", {10., Green} -> "B", {12.4, Red} -> "A"}];FeatureValueDependencyPlot[model -> "f1" -> "B", {{0, Blue}, {9, Red}, {20, Green}}]Use PlotLabelNone to avoid displaying a label:
FeatureValueDependencyPlot[model -> "f1" -> "B", {{0, Blue}, {9, Red}, {20, Green}}, PlotLabel -> None]PlotPoints (1)
Select the number of sampling points:
model = Predict[{...}]FeatureValueDependencyPlot[model -> 1, PlotPoints -> 10]A high PlotPoints value can highlight nonlinearities in the model:
Table[FeatureValueDependencyPlot[model -> 1, PlotPoints -> p], {p, {4, 20, 100}}]Text
Wolfram Research (2022), FeatureValueDependencyPlot, Wolfram Language function, https://reference.wolfram.com/language/ref/FeatureValueDependencyPlot.html.
CMS
Wolfram Language. 2022. "FeatureValueDependencyPlot." Wolfram Language & System Documentation Center. Wolfram Research. https://reference.wolfram.com/language/ref/FeatureValueDependencyPlot.html.
APA
Wolfram Language. (2022). FeatureValueDependencyPlot. Wolfram Language & System Documentation Center. Retrieved from https://reference.wolfram.com/language/ref/FeatureValueDependencyPlot.html