


LayeredGraph
LayeredGraph[g]
グラフ g からの頂点と辺を持つグラフを作成し,これを階層化プロットとして表す.
LayeredGraph[{e1,e2,…}]
辺 ejを持つグラフを作成し,これを階層化プロットとして表す.
LayeredGraph[{…,w[ei],…}]
辺 eiと記号ラッパー w で定義された特性を持つグラフを作成する.
LayeredGraph[…,vpos]
主頂点 v をプロットの位置 pos に置く.
詳細とオプション
- LayeredGraphはGraphオブジェクトを生成し,グラフの階層化プロットとしてノートブックに表示する.
- LayeredGraphは,Graphと同じ頂点,辺,ラッパーをサポートする.
- LayeredGraphは,デフォルトで,「主」頂点を一番上に置き,その下に「階層的」に頂点を加えていく.
- LayeredGraph[g,pos]は主頂点を位置 pos に置く.
- 位置 pos の可能な値には,Top,Bottom,Left,Rightがある.
- デフォルトで,LayeredGraphは各主頂点を一番上に置く.
- LayeredGraphにはGraphと同じオプションが使える.
全オプションのリスト
例題
すべて開く すべて閉じる例 (5)
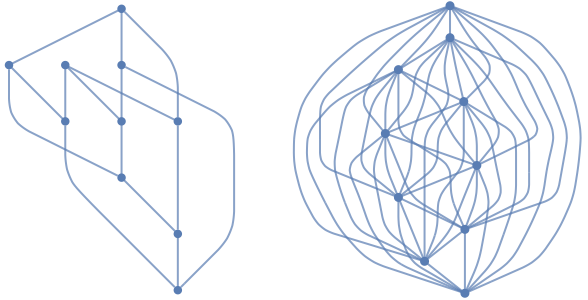
LayeredGraph[PetersenGraph[]]LayeredGraph[{1 -> 2, 3 -> 1, 3 -> 2, 4 -> 1, 4 -> 2}]LayeredGraph[{{0, 1, 1, 1, 1}, {0, 0, 1, 1, 0}, {0, 0, 0, 0, 0}, {0, 0, 0, 0, 0}, {0, 0, 0, 0, 0}}]LayeredGraph[{1 -> 2, 1 -> 3, 2 -> 3, 1 -> 4, 2 -> 4, 1 -> 5}, Left]LayeredGraph[{1 -> 2, 1 -> 3, 2 -> 3, 1 -> 4, 2 -> 4, 1 -> 5}, 2 -> Automatic, VertexLabels -> Automatic]スコープ (9)
グラフの指定 (6)
LayeredGraph[Graph[{13, 15, 18, 110, 38}]] 記号を使って無向層状グラフを作成する.この記号は ![]() ue
ue![]() で入力する:
で入力する:
LayeredGraph[{12, 13, 14, 23, 24, 34}] 記号を使って有向層状グラフを作成する.この記号は ![]() de
de![]() で入力する:
で入力する:
LayeredGraph[{12, 13, 14, 23, 24, 34}]LayeredGraph[{1 -> 3, 1 -> 5, 1 -> 8, 1 -> 10, 3 -> 8}]LayeredGraph[{{0, 1, 1, 1, 1}, {0, 0, 0, 1, 0}, {0, 0, 0, 0, 0}, {0, 0, 0, 0, 0}, {0, 0, 0, 0, 0}}]LayeredGraph[SparseArray[{{1, 2}, {1, 3}, {1, 4}, {1, 5}, {2, 4}} -> 1, {5, 5}]]グラフのスタイル付け (3)
LayeredGraph[{1 -> 2, 1 -> 7, 1 -> 11, 2 -> 5, Labeled[1 -> 5, "1->5"]}]LayeredGraph[{1 -> 2, 1 -> 7, 1 -> 11, 2 -> 5, 1 -> 5, 5 -> 5, 1 -> 5}, VertexLabels -> Automatic]Row@Table[LayeredGraph[{1 -> 3, 1 -> 4, 1 -> 5, 3 -> 5, 3 -> 6}, pos, PlotLabel -> pos], {pos, {Left, Top, Right, Bottom}}]オプション (75)
AnnotationRules (3)
LayeredGraph[{12, 31, 32, 41, 42}, AnnotationRules -> {1 -> {VertexLabels -> "hello"}}]LayeredGraph[{12, 31, 32, 41, 42}, AnnotationRules -> {12 -> {EdgeLabels -> "hello"}}]LayeredGraph[{12, 31, 32, 41, 42}, AnnotationRules -> {"GraphProperties" -> {"Message" -> "hello"}}]AnnotationValue[%, "Message"]DirectedEdges (2)
デフォルトで,規則が与えられると有向層状グラフが生成される:
LayeredGraph[{1 -> 2, 3 -> 1, 3 -> 2, 4 -> 1, 4 -> 2}]DirectedEdges->Falseを使って規則を無向辺として解釈する:
LayeredGraph[{1 -> 2, 3 -> 1, 3 -> 2, 4 -> 1, 4 -> 2}, DirectedEdges -> False]DirectedEdgeまたはUndirectedEdgeを使ってグラフが有向か無向かを直接指定する:
{LayeredGraph[{12, 13, 14, 23, 24, 34}], LayeredGraph[{12, 13, 14, 23, 24, 34}]}EdgeLabels (7)
LayeredGraph[{12, 13, 14, 23, 24, 34}, EdgeLabels -> {12 -> "Hello"}]el = {12, 13, 14, 23, 24, 34};LayeredGraph[el, EdgeLabels -> Table[el[[i]] -> Subscript["e", i], {i, Length[el]}]]LayeredGraph[{12, 13, 14, 23, 24, 34}, EdgeLabels -> {12 -> [image], 14 -> [image], 24 -> [image]}]Placedを記号位置と一緒に使って辺に沿ったラベルの置き方を制御する:
Table[LayeredGraph[{12, 13, 14, 23, 24}, EdgeLabels -> {24 -> Placed["■■■", p]}, PlotLabel -> p], {p, {"Start", "Middle", "End"}}]Table[LayeredGraph[{12, 13, 14, 23, 24}, EdgeLabels -> {24 -> Placed["■■■", p]}, PlotLabel -> p, BaselinePosition -> Bottom], {p, {0, 1 / 3, 1 / 4}}]Table[LayeredGraph[{12, 13, 14, 23, 24}, EdgeLabels -> {24 -> Placed["■■■", {1 / 2, p}]}, PlotLabel -> p, BaselinePosition -> Bottom], {p, {{0, 0}, {1 / 2, 1 / 2}, {1, 1}}}]Placedをラッパーの中で使って複数のラベルを置く:
LayeredGraph[{12, Labeled[31, Placed[{"lbl1", "lbl2"}, {"Start", "End"}]], 14, 23, 24}]LayeredGraph[{12, Labeled[31, Placed[{"lbl1", "lbl2", "lbl3"}, {"Start", "Middle", "End"}]], 14, 23, 24}]EdgeLabelsを使って複数のラベルを置く:
LayeredGraph[{12, 13, 14, 23, 24}, EdgeLabels -> {12 -> Placed[{"lbl1", "lbl2"}, {"Start", "End"}]}]TooltipとStatusAreaの値によって自動的にラベルを付ける:
LayeredGraph[{12, 13, 14, 23, 24}, EdgeLabels -> Placed["Name", Tooltip]]LayeredGraph[{12, 13, 14, 23, 24}, EdgeLabels -> Placed["Name", StatusArea]]EdgeShapeFunction (6)
EdgeShapeFunctionの組込み設定のリストを得る:
ResourceData["EdgeShapeFunction"]LayeredGraph[{12, 13, 14, 23, 24}, EdgeShapeFunction -> "Line"]Table[LayeredGraph[{12, 13, 14, 23, 24}, EdgeShapeFunction -> {{ef, "ArrowSize" -> 0.1}}, PlotLabel -> ef], {ef, {"BoxLine", "DiamondLine", "DotLine"}}]Table[LayeredGraph[{12, 13, 14, 23, 24}, EdgeShapeFunction -> {{ef, "ArrowSize" -> 0.1}}, PlotLabel -> ef], {ef, ResourceData["EdgeShapeFunction", "FilledArrow"]}]Table[LayeredGraph[{12, 13, 14, 23, 24}, EdgeShapeFunction -> {{ef, "ArrowSize" -> 0.1}}, PlotLabel -> ef], {ef, ResourceData["EdgeShapeFunction", "UnfilledArrow"]}]Table[LayeredGraph[{12, 13, 14, 23, 24}, EdgeShapeFunction -> {{ef, "ArrowSize" -> 0.1}}, PlotLabel -> ef], {ef, ResourceData["EdgeShapeFunction", "CarvedArrow"]}]LayeredGraph[{12, 13, 14, 23, 24}, EdgeShapeFunction -> {12 -> "FilledArcArrow"}]LayeredGraph[{12, 13, 14, 23, 24}, EdgeShapeFunction -> {12 -> "FilledArcArrow", "CarvedArrow"}]ef[pts_List, e_] :=
Block[{s = 0.015, g = [image]}, {Arrowheads[{{s, 0.33, g}, {s, 0.67, g}}], Arrow[pts]}]LayeredGraph[{12, 13, 14, 23, 24}, EdgeShapeFunction -> ef]EdgeShapeFunctionはEdgeStyleと組み合せることができる:
LayeredGraph[{12, 13, 14, 23, 24}, EdgeStyle -> Blue, EdgeShapeFunction -> (Line[#1]&)]EdgeShapeFunctionはEdgeStyleより優先順位が高い:
LayeredGraph[{12, 13, 14, 23, 24}, EdgeStyle -> Blue, EdgeShapeFunction -> ({Red, Line[#1]}&)]EdgeStyle (2)
EdgeWeight (2)
LayeredGraph[{12, 13, 14, 23, 24}, EdgeWeight -> RandomInteger[5, 5]]WeightedAdjacencyMatrix[%]//MatrixFormLayeredGraph[{12, 13, 14, 23, 24}, EdgeWeight -> {a, b, c, d, e}]WeightedAdjacencyMatrix[%]//MatrixFormGraphHighlight (3)
LayeredGraph[{12, 13, 14, 23, 24}, VertexSize -> Medium, GraphHighlight -> {1}]LayeredGraph[{12, 13, 14, 23, 24}, VertexSize -> Tiny, GraphHighlight -> {12}]LayeredGraph[{12, 13, 14, 23, 24}, VertexSize -> Tiny, GraphHighlight -> {1, 2, 12, 23}]GraphHighlightStyle (2)
GraphHighlightStyleの組込み設定のリストを得る:
ResourceData["GraphHighlightStyle"]GraphHighlightStyleの組込み設定を使う:
LayeredGraph[{12, 13, 14, 23, 24}, GraphHighlight -> {1, 23}, VertexSize -> Small, GraphHighlightStyle -> #, PlotLabel -> #]& /@ Select[ResourceData["GraphHighlightStyle"], # =!= Automatic&]PlotTheme (4)
基本的なテーマ (2)
VertexLabels (13)
LayeredGraph[{12, 13, 14, 23, 24}, VertexLabels -> "Name"]LayeredGraph[{12, 13, 14, 23, 24}, VertexLabels -> {2 -> "one"}]LayeredGraph[{12, 13, 14, 23, 24}, VertexLabels -> Table[i -> Subscript[v, i], {i, 4}]]LayeredGraph[{12, 13, 14, 23, 24}, VertexLabels -> {1 -> [image], 2 -> [image], 4 -> [image]}]Placedを記号位置と一緒に使ってラベルの置き方を位置の外側を含めて制御する:
Table[LayeredGraph[{12, 13, 14, 23, 24}, VertexSize -> 0.1, VertexShapeFunction -> "Square", VertexLabels -> Placed["■■■", p], PlotLabel -> p], {p, {Before, After, Below, Above}}]pl = {{Before, Below}, {After, Below}, {Before, Above}, {After, Above}};Table[LayeredGraph[{12, 13, 14, 23, 24}, VertexSize -> 0.1, VertexShapeFunction -> "Square", VertexLabels -> Placed["■■■", p], PlotLabel -> p], {p, pl}]Table[LayeredGraph[{12, 13, 14, 23, 24}, VertexSize -> 0.35, VertexLabels -> Placed["■■", p], VertexShapeFunction -> "Square", PlotLabel -> p], {p, {Left, Top, Right, Bottom}}]pl = {{Left, Bottom}, {Right, Bottom}, {Left, Top}, {Right, Top}};Table[LayeredGraph[{12, 13, 14, 23, 24}, VertexSize -> .6, VertexShapeFunction -> "Square", VertexLabels -> Placed["■■", p], PlotLabel -> p], {p, pl}]Table[LayeredGraph[{12, 13, 14, 23, 24}, VertexSize -> 0.5, VertexShapeFunction -> "Square", VertexLabels -> Placed[[image], p], PlotLabel -> p, BaselinePosition -> Bottom], {p, {{0, 0}, {1 / 2, 1 / 2}, {1, 1}}}]すべてのラベルを頂点の右上コーナー位置に置き,ラベル内で座標を変える:
Table[LayeredGraph[{12, 13, 14, 23, 24}, VertexSize -> 0.35, VertexShapeFunction -> "Square", VertexLabels -> Placed[[image], {{1, 1}, p}], PlotLabel -> p, BaselinePosition -> Bottom], {p, {{0, 0}, {1 / 2, 1 / 2}, {1, 1}}}]ラッパー内でPlacedを使って複数のラベルを置く:
LayeredGraph[{1, Labeled[2, Placed[{"lbl1", "lbl2"}, {Above, Below}]], 3}, {12, 13, 14, 23, 24}]LayeredGraph[{1, Labeled[2, Placed[{"lbl1", "lbl2", "lbl3", "lbl4"}, {Above, After, Below, Before}]], 3}, {12, 13, 14, 23, 24}]VertexLabelsを使って複数のラベルを置く:
LayeredGraph[{12, 13, 14, 23, 24}, VertexLabels -> {2 -> Placed[{"lbl1", "lbl2"}, {Above, Below}]}]Placedの引数を使ってTooltipを含むフォーマットを制御する:
LayeredGraph[{12, 13, 14, 23, 24}, VertexLabels -> Placed["Name", Tooltip]]あるいはStatusArea:
LayeredGraph[{12, 13, 14, 23, 24}, VertexLabels -> Placed["Name", StatusArea]]rotateLabel[lab_] := Rotate[lab, 45Degree]LayeredGraph[{12, 13, 14, 23, 24}, VertexLabels -> Placed["xxx", Below, rotateLabel]]panelLabel[lab_] := Panel[lab, FrameMargins -> 0, Background -> StandardBlue]LayeredGraph[{12, 13, 14, 23, 24}, VertexLabels -> Placed["xxx", Center, panelLabel]]hyperlinkLabel[lab_] := Hyperlink[lab, "http://www.wolfram.com"]LayeredGraph[{12, 13, 14, 23, 24}, VertexLabels -> Placed["xxx", Center, hyperlinkLabel]]VertexShape (5)
任意のGraphics,Image,あるいはGraphics3Dを頂点の形状として使う:
Table[LayeredGraph[{12, 13, 14, 23, 24}, VertexShape -> s, VertexSize -> 0.3], {s, {[image], [image], [image]}}]LayeredGraph[{12, 13, 14, 23, 24}, VertexShape -> {2 -> [image]}, VertexSize -> 0.3]VertexShapeはVertexSizeと組み合せることができる:
Table[LayeredGraph[{12, 13, 14, 23, 24}, VertexSize -> s, VertexShape -> [image], PlotLabel -> s], {s, {Medium, Large}}]VertexShapeはVertexStyleの影響を受けない:
LayeredGraph[{12, 13, 14, 23, 24}, VertexSize -> 0.3, VertexShape -> [image], VertexStyle -> Blue]VertexShapeFunctionはVertexShapeより優先順位が高い:
LayeredGraph[{12, 13, 14, 23, 24}, VertexSize -> 0.2, VertexShapeFunction -> "Square", VertexShape -> [image]]VertexShapeFunction (10)
VertexShapeFunctionについての組込みコレクションのリストを得る:
ResourceData["VertexShapeFunction"]"Basic"コレクションのVertexShapeFunctionの組込み設定を使う:
ResourceData["VertexShapeFunction", "Basic"]Table[LayeredGraph[{12, 13, 14, 23, 24}, VertexShapeFunction -> vf, VertexSize -> 0.2, PlotLabel -> vf], {vf, {"Triangle", "Square", "Rectangle", "Pentagon", "Hexagon", "Octagon"}}]Table[LayeredGraph[{12, 13, 14, 23, 24}, VertexShapeFunction -> vf, VertexSize -> 0.2, PlotLabel -> vf], {vf, {"DownTrapezoid", "UpTrapezoid", "Parallelogram", "FiveDown", "Circle", "Diamond", "Star", "Capsule"}}]"Rounded"コレクションのVertexShapeFunctionの組込み設定を使う:
ResourceData["VertexShapeFunction", "Rounded"]Table[LayeredGraph[{12, 13, 14, 23, 24}, VertexShapeFunction -> vf, VertexSize -> 0.2, PlotLabel -> vf], {vf, ResourceData["VertexShapeFunction", "Rounded"]}]"Concave"コレクションのVertexShapeFunctionの組込み設定を使う:
ResourceData["VertexShapeFunction", "Concave"]Table[LayeredGraph[{12, 13, 14, 23, 24}, VertexShapeFunction -> vf, VertexSize -> 0.2, PlotLabel -> vf], {vf, ResourceData["VertexShapeFunction", "Concave"]}]LayeredGraph[{12, 13, 14, 23, 24}, VertexShapeFunction -> { 1 -> "Square"}, VertexSize -> 0.2]LayeredGraph[{12, 13, 14, 23, 24}, VertexShapeFunction -> { 1 -> "Square", "Triangle"}, VertexSize -> 0.2]LayeredGraph[{12, 13, 14, 23, 24}, VertexShapeFunction -> (Inset[[image], #]&)]vf[{xc_, yc_}, name_, {w_, h_}] :=
Block[{xmin = xc - w, xmax = xc + w, ymin = yc - h, ymax = yc + h},
Polygon[{{xmin, ymin}, {xmax, ymax}, {xmin, ymax}, {xmax, ymin}}]
];LayeredGraph[{12, 13, 14, 23, 24}, VertexShapeFunction -> vf, VertexSize -> 0.2]VertexShapeFunctionはVertexStyleと組み合せることができる:
vf1[{xc_, yc_}, name_, {w_, h_}] := Rectangle[{xc - w, yc - h}, {xc + w, yc + h}]LayeredGraph[{12, 13, 14, 23, 24}, VertexSize -> 0.2, VertexStyle -> Blue, VertexShapeFunction -> vf1]VertexShapeFunctionはVertexStyleより優先順位が高い:
vf2[{xc_, yc_}, name_, {w_, h_}] := {Red, Rectangle[{xc - w, yc - h}, {xc + w, yc + h}]}LayeredGraph[{12, 13, 14, 23, 24}, VertexSize -> 0.2, VertexStyle -> Blue, VertexShapeFunction -> vf2]VertexShapeFunctionはVertexSizeと組み合せることができる:
LayeredGraph[{12, 13, 14, 23, 24}, VertexShapeFunction -> "Star", VertexSize -> {1 -> Small, Medium}]VertexShapeFunctionはVertexShapeより優先順位が高い:
LayeredGraph[{12, 13, 14, 23, 24}, VertexSize -> 0.3, VertexShapeFunction -> "Star", VertexShape -> [image]]VertexSize (8)
LayeredGraph[{12, 13, 14, 23, 24}, VertexSize -> Automatic]Table[LayeredGraph[{12, 13, 14, 23, 24}, VertexSize -> s, PlotLabel -> s], {s, {Tiny, Small, Medium, Large}}]Table[LayeredGraph[{12, 13, 14, 23, 24}, VertexSize -> s, PlotLabel -> s], {s, 0.1, 1, 0.3}]Table[LayeredGraph[{12, 13, 14, 23, 24}, VertexSize -> {"Scaled", s}, PlotLabel -> {"Scaled", s}], {s, 0.1, 1, 0.3}]Table[LayeredGraph[{12, 13, 14, 23, 24}, VertexSize -> s, PlotLabel -> s], {s, {{0.1, 0.2}, {0.2, 0.1}}}]LayeredGraph[{12, 13, 14, 23, 24}, VertexSize -> {1 -> 0.2, 2 -> 0.3}]VertexSizeはVertexShapeFunctionと組み合せることができる:
Table[LayeredGraph[{12, 13, 14, 23, 24}, VertexSize -> s, VertexShapeFunction -> "Square", PlotLabel -> s], {s, {0.05, 0.1, 0.2}}]VertexSizeはVertexShapeと組み合せることができる:
Table[LayeredGraph[{12, 13, 14, 23, 24}, VertexSize -> s, VertexShape -> [image], PlotLabel -> s], {s, {0.1, 0.2, 0.4}}]VertexStyle (5)
Table[LayeredGraph[{12, 13, 14, 23, 24}, VertexStyle -> style, VertexSize -> 0.3, PlotLabel -> style], {style, {Yellow, EdgeForm[Dashed]}}]LayeredGraph[{12, 13, 14, 23, 24}, VertexStyle -> {1 -> Blue, 2 -> Red}, VertexSize -> 0.2]VertexShapeFunctionはVertexStyleと組み合せることができる:
vf1[{xc_, yc_}, name_, {w_, h_}] := Rectangle[{xc - w, yc - h}, {xc + w, yc + h}]LayeredGraph[{12, 13, 14, 23, 24}, VertexSize -> 0.2, VertexStyle -> Blue, VertexShapeFunction -> vf1]VertexShapeFunctionはVertexStyleより優先順位が高い:
vf2[{xc_, yc_}, name_, {w_, h_}] := {Red, Rectangle[{xc - w, yc - h}, {xc + w, yc + h}]}LayeredGraph[{12, 13, 14, 23, 24}, VertexSize -> 0.2, VertexStyle -> Blue, VertexShapeFunction -> vf2]VertexStyleはBaseStyleと組み合せることができる:
LayeredGraph[{12, 13, 14, 23, 24}, VertexStyle -> LightBlue, BaseStyle -> EdgeForm[Dotted], VertexSize -> 0.2]VertexStyleはBaseStyleより優先順位が高い:
LayeredGraph[{12, 13, 14, 23, 24}, VertexStyle -> LightBlue, BaseStyle -> Gray, VertexSize -> 0.2]VertexShapeはVertexStyleの影響を受けない:
LayeredGraph[{12, 13, 14, 23, 24}, VertexSize -> 0.3, VertexShape -> [image], VertexStyle -> Blue]VertexWeight (3)
LayeredGraph[{12, 13, 14, 23, 24}, VertexWeight -> {2, 3, 4, 5}]AnnotationValue[{%, 1}, VertexWeight]LayeredGraph[{12, 13, 14, 23, 24}, VertexWeight -> {1 -> 2}]LayeredGraph[{12, 13, 14, 23, 24}, VertexWeight -> {a, b, c, d}]AnnotationValue[{%, 1}, VertexWeight]アプリケーション (5)
LayeredGraph[{"John" -> "plants", "lion" -> "John", "tiger" -> "John", "tiger" -> "deer", "lion" -> "deer", "deer" -> "plants", "mosquito" -> "lion", "frog" -> "mosquito", "mosquito" -> "tiger", "John" -> "cow", "cow" -> "plants", "mosquito" -> "deer", "mosquito" -> "John", "snake" -> "frog", "vulture" -> "snake"}, Left, PlotTheme -> "DiagramGreen"]LayeredGraph[{"Square" -> "Rectangle", "Rectangle" -> "Parallelogram", "Parallelogram" -> "Four-Sided Polygon", "Trapezoid" -> "Four-Sided Polygon", "Rectangle" -> "Trapezoid", "Four-Sided Polygon" -> "Polygon", "Polygon" -> "Shape", "Circle" -> "Ellipsoid", "Ellipsoid" -> "Shape", "Triangle" -> "Polygon", "Equilateral Triangle" -> "Isosceles Triangle", "Isosceles Triangle" -> "Triangle"}, PlotTheme -> "DiagramBlue", VertexSize -> {.4, .15}, AspectRatio -> 1.5]LayeredGraph[{"Total" -> "TotalDispatch", "TotalList" -> "CheckThreading", "TotalList" -> "TotalDispatch", "TotalSparse" -> "TotalDispatch", "TotalSparse" -> "TotalDispatch", "TotalDispatch" -> "TotalDispatch", "TotalDispatch" -> "TotalList", "TotalDispatch" -> "TotalPacked", "TotalDispatch" -> "TotalSparse"}, PlotTheme -> "DiagramBlue", VertexSize -> {.4, .15}]f[x_] := Module[{e1, e2, e3}, e1 = x + 1;e2 = Exp[x e1] + 1; e3 = e1 + Sin[x e2]; x + e3 + e1]LayeredGraph[{x -> f, e3 -> f, e1 -> f, e1 -> e3, x -> e3, e2 -> e3, x -> e2, e1 -> e2, x -> e1}, PlotTheme -> "ClassicDiagram"]g = {"5th Edition" -> "6th Edition", "5th Edition" -> "PWB 1.0", "6th Edition" -> "1 BSD", "6th Edition" -> "Interdata", "6th Edition" -> "LSX", "6th Edition" -> "Mini Unix", "6th Edition" -> "Wollongong", "PWB 1.0" -> "PWB 1.2", "PWB 1.0" -> "USG 1.0", "1 BSD" -> "2 BSD", "Interdata" -> "PWB 2.0", "Interdata" -> "Unix/TS 3.0", "Interdata" -> "7th Edition", "PWB 1.2" -> "PWB 2.0", "USG 1.0" -> "USG 2.0", "USG 1.0" -> "CB Unix 1", "7th Edition" -> "2 BSD", "7th Edition" -> "32V", "7th Edition" -> "Xenix", "7th Edition" -> "Ultrix-11", "7th Edition" -> "UniPlus+", "7th Edition" -> "V7M", "PWB 2.0" -> "Unix/TS 3.0", "USG 2.0" -> "USG 3.0", "CB Unix 1" -> "CB Unix 2", "32V" -> "3 BSD", "Unix/TS 1.0" -> "Unix/TS 3.0", "USG 3.0" -> "Unix/TS 3.0", "CB Unix 2" -> "CB Unix 3", "3 BSD" -> "4 BSD", "V7M" -> "Ultrix-11", "Unix/TS 3.0" -> "TS 4.0", "CB Unix 3" -> "Unix/TS++", "CB Unix 3" -> "PDP-11 Sys V", "4 BSD" -> "4.1 BSD", "Unix/TS++" -> "TS 4.0", "4.1 BSD" -> "8th Edition", "4.1 BSD" -> "4.2 BSD", "4.1 BSD" -> "2.8 BSD", "2 BSD" -> "2.8 BSD", "TS 4.0" -> "System V.0", "4.2 BSD" -> "4.3 BSD", "4.2 BSD" -> "Ultrix-32", "2.8 BSD" -> "2.9 BSD", "2.8 BSD" -> "Ultrix-11", "System V.0" -> "System V.2", "8th Edition" -> "9th Edition", "System V.2" -> "System V.3"};LayeredGraph[g, PlotTheme -> "ClassicDiagram", VertexSize -> {.5, .1}]考えられる問題 (1)
おもしろい例題 (1)
DaughterNuclides[s_List] := DeleteCases[Union[Apply[Join, Map[IsotopeData[#, "DaughterNuclides"]&, DeleteCases[s, _Missing]]]], _Missing]ReachableNuclides[s_List] := FixedPoint[Union[Join[#, DaughterNuclides[#]]]&, s]DecayNetwork[iso_List] :=
Apply[Join, Map[Thread[# -> DaughterNuclides[{#}]]&, ReachableNuclides[iso]]]DecayNetworkPlot[s_] := LayeredGraph[Map[IsotopeData[#, "Symbol"]&, DecayNetwork[{s}], {2}], PerformanceGoal -> "Quality", VertexShapeFunction -> (Text[Framed[Style[#2, 8, Black], Background -> LightYellow], #1]&)]DecayNetworkPlot["Uranium235"]DecayNetworkPlot["Polonium189"]DecayNetworkPlot["Plutonium239"]テキスト
Wolfram Research (2024), LayeredGraph, Wolfram言語関数, https://reference.wolfram.com/language/ref/LayeredGraph.html.
CMS
Wolfram Language. 2024. "LayeredGraph." Wolfram Language & System Documentation Center. Wolfram Research. https://reference.wolfram.com/language/ref/LayeredGraph.html.
APA
Wolfram Language. (2024). LayeredGraph. Wolfram Language & System Documentation Center. Retrieved from https://reference.wolfram.com/language/ref/LayeredGraph.html