


MoleculePlot3D
MoleculePlot3D[mol]
creates a three-dimensional model of the molecule mol.
MoleculePlot3D[mol,patt]
creates a model of mol where all atoms and bonds matching the pattern patt are highlighted.
Details and Options
- If the molecule does not have structure diagram coordinates, they will be generated automatically according to the molecule's AtomCoordinates option.
- mol can be a Molecule object or something that can be easily converted to one, such as a systematic chemical name, a "Chemical" entity or ExternalIdentifier.
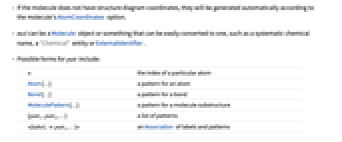
- Possible forms for patt include:
-
n the index of a particular atom Atom[…] a pattern for an atom Bond[…] a pattern for a bond MoleculePattern[…] a pattern for a molecule substructure {patt1,patt2,…} a list of patterns <label1patt1,…> an Association of labels and patterns - Patterns entered as Style[patt,spec]will be styled according to spec.
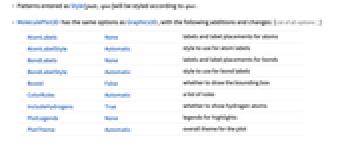
- MoleculePlot3D has the same options as Graphics3D, with the following additions and changes: [List of all options]
-
AtomLabels None labels and label placements for atoms AtomLabelStyle Automatic style to use for atom labels BondLabels None labels and label placements for bonds BondLabelStyle Automatic style to use for bond labels Boxed False whether to draw the bounding box ColorRules Automatic a list of rules IncludeHydrogens True whether to show hydrogen atoms PlotLegends None legends for highlights PlotTheme Automatic overall theme for the plot - Supported plot themes include:
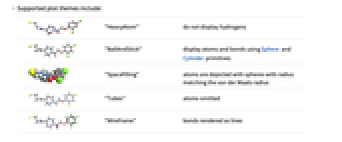
-
"BallAndStick" display atoms and bonds using Sphere and Cylinder primitives 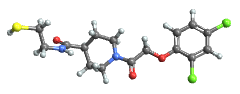
"Spacefilling" atoms are depicted with spheres with radius matching the van der Waals radius 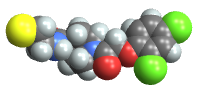
"Tubes" atoms omitted 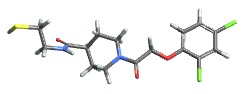
"Wireframe" bonds rendered as lines - Typical settings for PlotLegends include:
-
None no legend Automatic automatically determine legend {lbl1,lbl2,…} use lbl1, lbl2, … as legend labels Placed[lspec,…] specify placement for legend - When patt is entered as an Association, the labeli will be used in the PlotLegends.
-
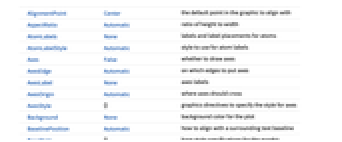
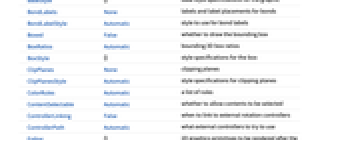
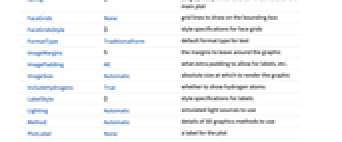
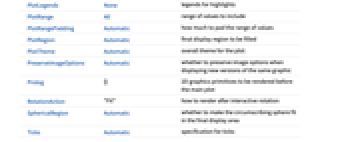
AlignmentPoint Center the default point in the graphic to align with AspectRatio Automatic ratio of height to width AtomLabels None labels and label placements for atoms AtomLabelStyle Automatic style to use for atom labels Axes False whether to draw axes AxesEdge Automatic on which edges to put axes AxesLabel None axes labels AxesOrigin Automatic where axes should cross AxesStyle {} graphics directives to specify the style for axes Background None background color for the plot BaselinePosition Automatic how to align with a surrounding text baseline BaseStyle {} base style specifications for the graphic BondLabels None labels and label placements for bonds BondLabelStyle Automatic style to use for bond labels Boxed False whether to draw the bounding box BoxRatios Automatic bounding 3D box ratios BoxStyle {} style specifications for the box ClipPlanes None clipping planes ClipPlanesStyle Automatic style specifications for clipping planes ColorRules Automatic a list of rules ContentSelectable Automatic whether to allow contents to be selected ControllerLinking False when to link to external rotation controllers ControllerPath Automatic what external controllers to try to use Epilog {} 2D graphics primitives to be rendered after the main plot FaceGrids None grid lines to draw on the bounding box FaceGridsStyle {} style specifications for face grids FormatType TraditionalForm default format type for text ImageMargins 0. the margins to leave around the graphic ImagePadding All what extra padding to allow for labels, etc. ImageSize Automatic absolute size at which to render the graphic IncludeHydrogens True whether to show hydrogen atoms LabelStyle {} style specifications for labels Lighting Automatic simulated light sources to use Method Automatic details of 3D graphics methods to use PlotLabel None a label for the plot PlotLegends None legends for highlights PlotRange All range of values to include PlotRangePadding Automatic how much to pad the range of values PlotRegion Automatic final display region to be filled PlotTheme Automatic overall theme for the plot PreserveImageOptions Automatic whether to preserve image options when displaying new versions of the same graphic Prolog {} 2D graphics primitives to be rendered before the main plot RotationAction "Fit" how to render after interactive rotation SphericalRegion Automatic whether to make the circumscribing sphere fit in the final display area Ticks Automatic specification for ticks TicksStyle {} style specification for ticks TouchscreenAutoZoom False whether to zoom to fullscreen when activated on a touchscreen ViewAngle Automatic angle of the field of view ViewCenter Automatic point to display at the center ViewMatrix Automatic explicit transformation matrix ViewPoint {1.3,-2.4,2.} viewing position ViewProjection Automatic projection method for rendering objects distant from the viewer ViewRange All range of viewing distances to include ViewVector Automatic position and direction of a simulated camera ViewVertical {0,0,1} direction to make vertical
List of all options
Examples
open all close allBasic Examples (3)
Scope (2)
Options (8)
AtomLabels (1)
AtomLabelStyle (1)
BondLabels (1)
BondLabelStyle (1)
IncludeHydrogens (1)
Neat Examples (1)
Combine a 3D molecule plot with a surface mesh using MoleculeMesh:
Text
Wolfram Research (2019), MoleculePlot3D, Wolfram Language function, https://reference.wolfram.com/language/ref/MoleculePlot3D.html (updated 2021).
CMS
Wolfram Language. 2019. "MoleculePlot3D." Wolfram Language & System Documentation Center. Wolfram Research. Last Modified 2021. https://reference.wolfram.com/language/ref/MoleculePlot3D.html.
APA
Wolfram Language. (2019). MoleculePlot3D. Wolfram Language & System Documentation Center. Retrieved from https://reference.wolfram.com/language/ref/MoleculePlot3D.html