ContourPlot[f,{x,xmin,xmax},{y,ymin,ymax}]
生成关于 x 和 y 的函数 f 的等高线图.
ContourPlot[f==g,{x,xmin,xmax},{y,ymin,ymax}]
绘制 f=g 的等高线.
ContourPlot[{f1==g1,f2==g2,…},{x,xmin,xmax},{y,ymin,ymax}]
绘制多个等高线.
ContourPlot[…,{x,y}∈reg]
将变量 {x,y} 选在几何区域 reg 中.


ContourPlot
ContourPlot[f,{x,xmin,xmax},{y,ymin,ymax}]
生成关于 x 和 y 的函数 f 的等高线图.
ContourPlot[f==g,{x,xmin,xmax},{y,ymin,ymax}]
绘制 f=g 的等高线.
ContourPlot[{f1==g1,f2==g2,…},{x,xmin,xmax},{y,ymin,ymax}]
绘制多个等高线.
ContourPlot[…,{x,y}∈reg]
将变量 {x,y} 选在几何区域 reg 中.
更多信息和选项


- ContourPlot 亦称为等值线、等位线、等值集 (level set) 或下等值集 (sublevel set).
- 当给定函数 f 时,ContourPlot 构建对应于等值集(其中 f[x,y] 具有恒定的值 d1、d2 等)的等值线. 默认情况下,等值线之间的区域被以有利于识别数值位于 di 和 di+1 之间的区域的方式着色.
- 它可视化的是集合
 .
. - 当给定方程 f==g 时,ContourPlot 显示满足方程的 {x,y} 曲线. 不对区域进行着色;来自多个方程的曲线可以以任意方式相交,着色因此变得毫无意义. 它可视化的是集合
 .
. - 在 f 的计算结果为非实数的位置处,预留空洞,以使等高线图形的背景透过.
- ContourPlot 将变量 x 和 y 视为局部变量,实际上等效于 Block.
- ContourPlot 具有属性 HoldAll,仅在对 x 和 y 赋值后才计算 fi 和 gi.
- 某些情况下,在对 x 和 y 赋值之前,先用 Evaluate 符号式计算 fi 和 gi 更有效.
- 在任何 f 计算为 None 的区域,图形留下空白.
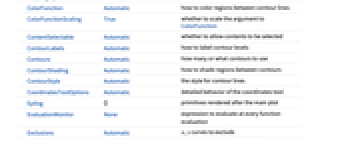
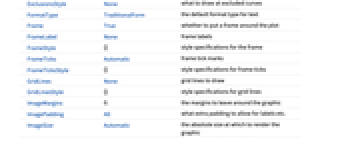
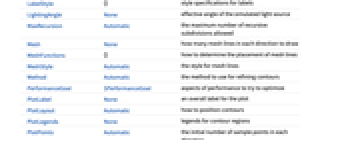
- ContourPlot 的选项与 Graphics 相同,并有以下补充和变化: [所有选项的列表]
- PlotLegends 的典型设置包括:
-
None 不使用图例 Automatic 自动确定图例 Placed[lspec,…] 指定图例位置 - 在缺省设置 ContourShading->Automatic 时,阴影用于 ContourPlot[f,…] 但不用于 ContourPlot[f==g,…].
- ContourPlot[{f1==g1,f2==g2,…},…] 叠加所有与等式 fi==gi 相关的等高线.
- 在绘制一组方程时,ColorData["DefaultPlotColors"] 给出 ContourStyle 使用的默认颜色序列.
- ColorData["DefaultPlotColors"] 给出 ContourStyle 使用的默认颜色序列.
- 对于位于等高线层次之间的区域,在确定对区域如何着色的过程中,ContourPlot 首先查看对 ContourShading 的显式设置,然后查看对 ColorFunction 的设置.
- ContourPlot 首先在由 PlotPoints 指定的等间隔样本点的网格上计算 f,然后使用一种自适应算法进行至多 MaxRecursion 次子划分,来产生平滑等高线.
- 应该认识到由于使用的样本点数量有限,ContourPlot 可能会丢失您的函数的部分特征. 在检测您的结果时,可以尝试提高对 PlotPoints 和 MaxRecursion 的设置.
- 对于 PerformanceGoal 的某些设置,其它专有的选项设置可能会被屏蔽.
- MeshFunctions 和 RegionFunction 中提供给函数的自变量是 x、y、f.
- ColorFunction 缺省下提供单个自变量,它由关于每对连续等高层的 f 的平均比例值给出.
- 在缺省设置 Exclusions->Automatic 和 ExclusionsStyle->None 时,ContourPlot 在它检测到的任何曲线不连续处断开取样的连续性. 这个不连续性仅在它跳离特定等高层时立即显示出来.
- ScalingFunctions 的可能设置包括:
-
sf 缩放 f 值 {sx,sy} 缩放 x 和 y 轴 {sx,sy,sf} 缩放 x 和 y 轴以及 f 值 - 在不同绘图面板中显示每个输入的 PlotLayout 可能设置包括:
-
"Column" 在一列面板中使用不同等值线 "Row" 在一行面板中使用不同等值线 {"Column",k},{"Row",k} 使用 k 列或行 {"Column",UpTo[k]},{"Row",UpTo[k]} 使用至多 k 列或行 - 除了 LightingAngle->None 以外的设定, ContourPlot 包括基于高度值的模拟光源,其中高度值由 BoxRatios 决定.
- ContourPlot 返回 Graphics[GraphicsComplex[data]].


所有选项的列表


范例
打开所有单元 关闭所有单元范围 (22)
取样 (11)
用 PlotPoints 和 MaxRecursion 控制自适应取样:
用 PlotRange 强调感兴趣的区域:
用 Exclusions 删除曲线或切割生成的曲面:
用 RegionFunction 将曲面限制在不等式给定的区域上:
还可以通过 MeshRegion 指定定义域:
选项 (112)
AspectRatio (4)
Axes (4)
AxesLabel (4)
BoundaryStyle (5)
ContourLines (1)
ContourLines 被 ContourStyle 取代:
Contours (7)
ContourShading (4)
ContourStyle (7)
EvaluationMonitor (2)
ImageSize (7)
PlotLegends (8)
PlotLegends 自动匹配颜色函数:
PlotLegends->Automatic 使用占位符数值对隐式曲线添加标签:
使用 PlotLegends->"Expressions" 来使用实际方程:
使用 Placed 来改变图例位置:
使用 BarLegend 来改变图例外观:
ScalingFunctions (9)
应用 (6)
属性和关系 (6)
ContourPlot 在需要处取较多的采样点:
用 ListContourPlot 绘制数据:
对表面和密度用 Plot3D 和 DensityPlot:
对单变量函数用 Plot:
对平面参数曲线和区域用 ParametricPlot:
对隐式表面和区域用 ContourPlot3D 和 RegionPlot3D:
技术笔记
-
▪
- 密度图和等高图
历史
1988年引入 (1.0) | 在以下年份被更新:2007 (6.0) ▪ 2008 (7.0) ▪ 2012 (9.0) ▪ 2014 (10.0) ▪ 2016 (11.0) ▪ 2017 (11.1) ▪ 2021 (13.0) ▪ 2025 (14.3)
文本
Wolfram Research (1988),ContourPlot,Wolfram 语言函数,https://reference.wolfram.com/language/ref/ContourPlot.html (更新于 2025 年).
CMS
Wolfram 语言. 1988. "ContourPlot." Wolfram 语言与系统参考资料中心. Wolfram Research. 最新版本 2025. https://reference.wolfram.com/language/ref/ContourPlot.html.
APA
Wolfram 语言. (1988). ContourPlot. Wolfram 语言与系统参考资料中心. 追溯自 https://reference.wolfram.com/language/ref/ContourPlot.html 年
BibTeX
@misc{reference.wolfram_2025_contourplot, author="Wolfram Research", title="{ContourPlot}", year="2025", howpublished="\url{https://reference.wolfram.com/language/ref/ContourPlot.html}", note=[Accessed: 14-February-2026]}
BibLaTeX
@online{reference.wolfram_2025_contourplot, organization={Wolfram Research}, title={ContourPlot}, year={2025}, url={https://reference.wolfram.com/language/ref/ContourPlot.html}, note=[Accessed: 14-February-2026]}