統計の可視化
統計の可視化は,データがどのように分布しているか,他のデータ集合や分布と比べてどうか等を理解するために使われる.ヒストグラムと平滑化ヒストグラムはどちらもビンに分割したり平滑化したりすることでさまざまな分布関数を効率的に推定する.変位値とその関連プロットはデータを参照分布と比較する.箱ひげ図と分布図は多くのデータ分布をそれぞれ比較する.すべての統計の可視化関数は審美的にも,自動ビン選択,帯域幅決定,分布母数推定等の統計計算についても高度に自動化されている.すべての関数は審美的な部分についても,確率計算についても詳細にカスタム化もできる.
分布の形状
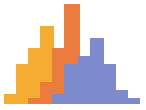 Histogram — データのヒストグラムをプロットする
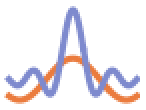
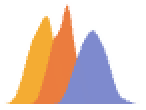 SmoothHistogram — データの密度推定をプロットする
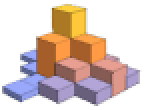 Histogram3D ▪
 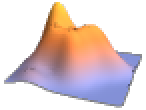 SmoothHistogram3D ▪
  DensityHistogram
 SmoothDensityHistogram ▪
  PairedHistogram ▪
  PairedSmoothHistogram
BarSpacing ▪ BarOrigin ▪ GridLines ▪ ScalingFunctions ▪ ...
分布のフィット
 QuantilePlot — データまたは分布の変位値-変位値プロット
 ProbabilityPlot — データまたは分布の確率-確率プロット
 ProbabilityScalePlot — 正規プロット,ワイブル(Weibull)プロット,ガンベル(Gumbel)プロット等
ReferenceLineStyle ▪ ScalingFunctions ▪ GridLines ▪ ...
分布の比較
 BoxWhiskerChart — 複数のデータ集合の箱ひげ図
 DistributionChart — 複数のデータ集合の分布図
BarSpacing ▪ BarOrigin ▪ ChartElementFunction ▪ ScalingFunctions ▪ ...
グラフ化 »
 BarChart ▪
  PieChart ▪
  BubbleChart ▪ ...
データの可視化 »
 ListPlot ▪
  ListPlot3D ▪
  ListContourPlot ▪ ...
日付と時刻の可視化 »
 DateListPlot ▪
  TimelinePlot ▪
 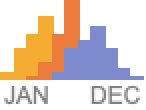 DateHistogram ▪ ...
関数の可視化 »
 Plot ▪
  Plot3D ▪
 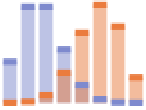 DiscretePlot ▪
 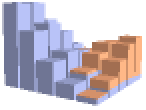 DiscretePlot3D ▪
  ContourPlot ▪ ...