グラフ g のコミュニティ構造を示すプロットを生成する.
CommunityGraphPlot[g,{{vi1,vi2,…},…}]
コミュニティ{vi1,vi2,…}, …のあるグラフ g のプロットを生成する.
CommunityGraphPlot[g,{…,wj[{vi1,…}],…}]
記号ラッパー wjで定義された特徴をハイライトしたプロットを生成する.
CommunityGraphPlot[{vi1vj1,vi2vj2,…},…]
頂点 vikが頂点 vjkと接続しているグラフのプロットを生成する.
CommunityGraphPlot[m,…]
隣接行列 m で表されるグラフのプロットを生成する.
CommunityGraphPlot
グラフ g のコミュニティ構造を示すプロットを生成する.
CommunityGraphPlot[g,{{vi1,vi2,…},…}]
コミュニティ{vi1,vi2,…}, …のあるグラフ g のプロットを生成する.
CommunityGraphPlot[g,{…,wj[{vi1,…}],…}]
記号ラッパー wjで定義された特徴をハイライトしたプロットを生成する.
CommunityGraphPlot[{vi1vj1,vi2vj2,…},…]
頂点 vikが頂点 vjkと接続しているグラフのプロットを生成する.
CommunityGraphPlot[m,…]
隣接行列 m で表されるグラフのプロットを生成する.
詳細とオプション
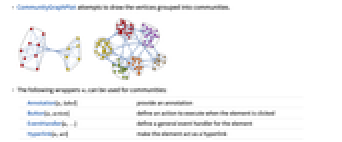
- CommunityGraphPlotは,コミュニティにグループ化した頂点を描こうと試みる.
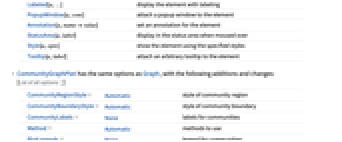
- コミュニティには次のラッパー wi を使うことができる.
-
Annotation[a,label] 注釈を与える Button[a,action] 要素がクリックされたときに実行するアクションを定義する EventHandler[a,…] 要素の一般的なイベントハンドラを定義する Hyperlink[a,uri] 要素がハイパーリンクになるようにする Labeled[a,…] 要素にラベルを付けて表示する PopupWindow[a,cont] 要素にポップアップウィンドウを付ける Annotation[a,namevalue] 要素の注釈を設定する StatusArea[a,label] マウスが上に置かれたときにステータスエリアに表示する Style[a,opts] 要素を指定されたスタイルで示す Tooltip[a,label] 要素に任意のツールチップを付ける - CommunityGraphPlotにはGraphのオプションに次の追加・変更を加えたものを使うことができる. [全オプションのリスト]
-
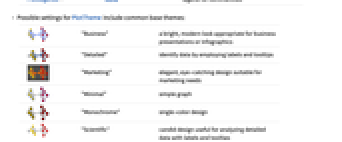
CommunityRegionStyle Automatic コミュニティ範囲のスタイル CommunityBoundaryStyle Automatic コミュニティ境界のスタイル CommunityLabels None コミュニティのラベル Method Automatic 使用するメソッド PlotLegends None コミュニティの凡例 - PlotThemeの可能な設定には,共通の基本テーマがある.
-
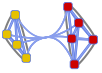
"Business" 明るい近代的な外観.ビジネスプレゼンテーションやインフォグラフィックスに適している 
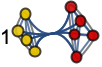
"Detailed" ラベルやツールチップを使ってデータを識別する 
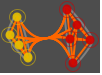
"Marketing" マーケティングに適した,エレガントで目を引くデザイン 
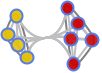
"Minimal" 単純なグラフ 
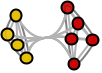
"Monochrome" 単色のデザイン 
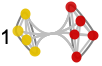
"Scientific" ラベルやツールチップが付いた,詳細データの分析に役立つ自然のままのデザイン 
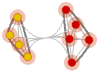
"Web" 消費者向けのWebサイトやブログに適したクリーンで大胆なデザイン 
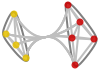
"Classic" 既存の用途との互換性を維持するための,プロットの従来のデザイン
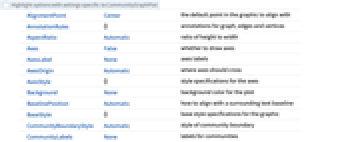
全オプションのリスト
例題
すべて開く すべて閉じる例 (2)
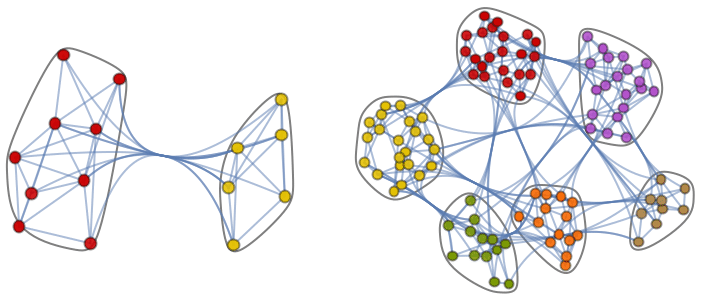
CommunityGraphPlot[ExampleData[{"NetworkGraph", "DolphinSocialNetwork"}]]g = ExampleData[{"NetworkGraph", "ZacharyKarateClub"}];FindGraphCommunities[g]CommunityGraphPlot[g, %]スコープ (8)
CommunityGraphPlotは無向グラフに使うことができる:
CommunityGraphPlot[[image]]CommunityGraphPlot[[image]]CommunityGraphPlot[[image]]CommunityGraphPlot[[image]]CommunityGraphPlot[{1 -> 3, 1 -> 5, 1 -> 7, 1 -> 10, 1 -> 13, 2 -> 5, 2 -> 6, 2 -> 8, 2 -> 10, 2 -> 14, 3 -> 4, 4 -> 5, 2 -> 3, 1 -> 2, 14 -> 1}]CommunityGraphPlot[(| | | | | | |
| - | - | - | - | - | - |
| 0 | 1 | 1 | 1 | 0 | 0 |
| 1 | 0 | 1 | 1 | 1 | 0 |
| 1 | 1 | 0 | 1 | 1 | 1 |
| 1 | 1 | 1 | 0 | 1 | 1 |
| 0 | 1 | 1 | 1 | 0 | 1 |
| 0 | 0 | 1 | 1 | 1 | 0 |)]CommunityGraphPlot[[image], {{4, 5, 7}, {1, 2, 3}, {6, 9, 8}}]CommunityGraphPlot[[image], {Style[{4, 5, 7, 1, 2}, Green], {3, 6, 9, 8}}]CommunityGraphPlot[[image], {Labeled[{4, 5, 7, 1, 2}, "A"], {3, 6, 9, 8}}]オプション (17)
AspectRatio (2)
デフォルトで,CommunityGraphPlotはプロットの縦横比を自動的に決定する:
CommunityGraphPlot[IconizedObject[«graph»]]AspectRatio1を使って高さを幅と等しくする:
CommunityGraphPlot[IconizedObject[«graph»], AspectRatio -> 1]CommunityBoundaryStyle (4)
CommunityGraphPlot[[image], CommunityBoundaryStyle -> Automatic]CommunityGraphPlot[[image], CommunityBoundaryStyle -> Green]Noneを使って境界線を示さないようにする:
CommunityGraphPlot[[image], CommunityBoundaryStyle -> None]CommunityGraphPlot[[image], CommunityBoundaryStyle -> {Red, Dashed}]CommunityLabels (3)
CommunityGraphPlot[[image], CommunityLabels -> {"one", "two", "three"}]Labeledを使って個々のラベルを指定する:
CommunityGraphPlot[[image], {Labeled[{1, 4, 10, 6}, "one"], {2, 5, 8}, {9, 3, 7}}]Placedを使ってラベルの置き方を制御する:
CommunityGraphPlot[[image], CommunityLabels -> Placed[{"one", "two", "three"}, Below]]CommunityRegionStyle (3)
デフォルトのコミュニティ範囲にはスタイルNoneが使われる:
CommunityGraphPlot[[image]]これはCommunityRegionStyle->Noneとしても得ることができる:
CommunityGraphPlot[[image], CommunityRegionStyle -> None]CommunityGraphPlot[[image], CommunityRegionStyle -> Green]CommunityGraphPlot[[image], CommunityRegionStyle -> {Red, Blue}]Method (2)
デフォルトで,CommunityGraphPlotは力指向レイアウトを使う:
CommunityGraphPlot[[image]]これはMethod->"SpringElectrical"で得ることもできる:
CommunityGraphPlot[[image], Method -> "SpringElectrical"]階層的レイアウトにはMethod->"Hierarchical"を使う:
CommunityGraphPlot[[image], Method -> "Hierarchical"]PlotLegends (3)
CommunityGraphPlot[[image], PlotLegends -> {"one", "two", "three"}]Legendedを使って個々の凡例項目を指定する:
CommunityGraphPlot[[image], {Legended[{1, 4, 10, 6}, "one"], {2, 5, 8}, {9, 3, 7}}]Placedを使って凡例の置き方を制御する:
CommunityGraphPlot[[image], PlotLegends -> Placed[Automatic, Below]]関連するガイド
-
▪
- ソーシャルネットワーク分析 ▪
- グラフの可視化 ▪
- クラスタ解析 ▪
- グラフレイアウト ▪
- グラフとネットワーク
テキスト
Wolfram Research (2012), CommunityGraphPlot, Wolfram言語関数, https://reference.wolfram.com/language/ref/CommunityGraphPlot.html.
CMS
Wolfram Language. 2012. "CommunityGraphPlot." Wolfram Language & System Documentation Center. Wolfram Research. https://reference.wolfram.com/language/ref/CommunityGraphPlot.html.
APA
Wolfram Language. (2012). CommunityGraphPlot. Wolfram Language & System Documentation Center. Retrieved from https://reference.wolfram.com/language/ref/CommunityGraphPlot.html
BibTeX
@misc{reference.wolfram_2026_communitygraphplot, author="Wolfram Research", title="{CommunityGraphPlot}", year="2012", howpublished="\url{https://reference.wolfram.com/language/ref/CommunityGraphPlot.html}", note=[Accessed: 04-September-2026]}
BibLaTeX
@online{reference.wolfram_2026_communitygraphplot, organization={Wolfram Research}, title={CommunityGraphPlot}, year={2012}, url={https://reference.wolfram.com/language/ref/CommunityGraphPlot.html}, note=[Accessed: 04-September-2026]}