将二维或三维图形 g 离散为 MeshRegion.
DiscretizeGraphics[g,patt]
仅离散 g 中与模式 patt 匹配的元素.
DiscretizeGraphics
将二维或三维图形 g 离散为 MeshRegion.
DiscretizeGraphics[g,patt]
仅离散 g 中与模式 patt 匹配的元素.
更多信息和选项
- DiscretizeGraphics 将图形离散化为用于 MeshRegion 的分段线性单元的不相交并集.
- 图形 g 可以是 Graphics、Graphics3D 或单独的图形基元.
- DiscretizeGraphics 实际上将 Graphics 和 Graphics3D 中的多个基元作为并集运算.
- 当 g 仅包含有界分段线性基元时,离散化是精确的;否则,仅是一种近似.
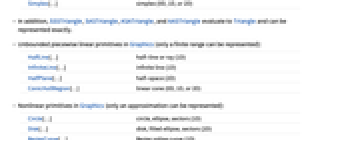
- Graphics 中的有界分段线性基元(这些可以被精确表示):
-
Point[…] 点(零维) Line[…] 线(一维) Triangle[…] 实心三角形(二维) Polygon[…] 实心多边形(二维) Rectangle[…] 实心矩形(二维) Parallelogram[…] 实心平行四边形(零维、一维或二维) Simplex[…] 单纯形(零维、一维或二维) - 另外,SSSTriangle、SASTriangle、ASATriangle 和 AASTriangle 计算为 Triangle,并可被精确表示.
- Graphics 中的无界分段线性基元(仅能表示有限的范围):
-
HalfLine[…] 半直线或射线(一维) InfiniteLine[…] 无穷直线(一维) HalfPlane[…] 半空间(二维) ConicHullRegion[…] 线性锥(零维、一维或二维) - Graphics 中的非线性基元(仅能表示近似值):
-
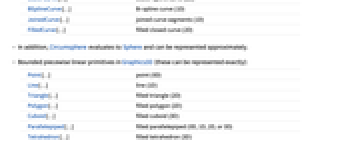
Circle[…] 圆形、椭圆形、扇形(一维) Disk[…] 圆盘、实心椭圆、扇形(二维) BezierCurve[…] 贝塞尔样条曲线(一维) BSplineCurve[…] B 样条曲线(一维) JoinedCurve[…] 连接曲线段(一维) FilledCurve[…] 实心闭合曲线(二维) - 另外,Circumsphere 计算结果为 Sphere,并且可以近似表示.
- Graphics3D 中的有界分段线性基元(这些可以被精确表示):
-
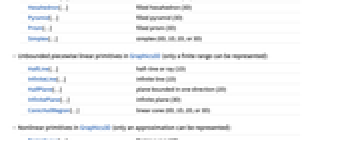
Point[…] 点(零维) Line[…] 线(一维) Triangle[…] 实心三角形(二维) Polygon[…] 实心多边形(二维) Cuboid[…] 实心立方体(三维) Parallelepiped[…] 实心平行六面体(零维、一维、二维或三维) Tetrahedron[…] 实心四面体(三维) Hexahedron[…] 实心六面体(三维) Pyramid[…] 实心角锥(三维) Prism[…] 实心棱柱(三维) Simplex[…] 单纯形(零维、一维、二维或三维) - Graphics3D 中的无界分段线性基元(仅能表示有限的范围):
-
HalfLine[…] 射线(一维) InfiniteLine[…] 无穷直线(一维) HalfPlane[…] 在一个方向有界的平面(二维) InfinitePlane[…] 无穷平面(三维) ConicHullRegion[…] 线性锥(零维、一维、二维或三维) - Graphics3D 中的非线性基元(仅能表示近似值):
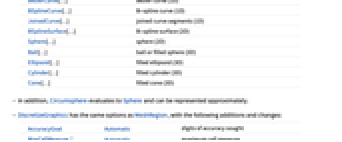
-
BezierCurve[…] 贝塞尔曲线(一维) BSplineCurve[…] B 样条曲线(一维) JoinedCurve[…] 连接曲线段(一维) BSplineSurface[…] B 样条曲面(二维) Sphere[…] 球体(二维) Ball[…] 球或实心球体(三维) Ellipsoid[…] 实心椭圆体(三维) Cylinder[…] 实心圆柱体(三维) Cone[…] 实心锥体(三维) - 另外,Circumsphere 计算结果为 Sphere,并且可以近似表示.
- DiscretizeGraphics 具有与 MeshRegion 相同的选项,具有下列添加和变动:
-
AccuracyGoal Automatic 所追求的准确度位数 MaxCellMeasure Automatic 最大单元度量 MeshQualityGoal Automatic 网格单元的质量目标 Method Automatic 所用方法 MeshRefinementFunction None 函数,如果网格单元需要细化,则返回 True PlotRange Automatic 要包括的范围 PerformanceGoal $PerformanceGoal 考虑速度还是质量 PrecisionGoal Automatic 所追求的精度位数 - 在设置 AccuracyGoal->a 和 PrecisionGoal->p 下,将尝试把区域 reg 或离散化区域 dreg 与 RegionSymmetricDifference[reg,dreg] 中任意点之间的距离保持在

以内,其中
为图形范围对角线的长度.
范例
打开所有单元 关闭所有单元基本范例 (3)
离散包括 Circle 在内的二维特殊区域:
DiscretizeGraphics[Graphics[{Circle[]}]]DiscretizeGraphics[Graphics[{Parallelogram[{0, 0}, {{1, 1}, {1, 0}}]}]]离散包括 Cone 在内的三维特殊区域:
DiscretizeGraphics[Graphics3D[{Cone[]}]]DiscretizeGraphics[Graphics3D[{Prism[{{1, 0, 1}, {0, 0, 0}, {2, 0, 0}, {1, 2, 1}, {0, 2, 0}, {2, 2, 0}}]}]]离散化整个 2D Graphics 场景,其中多个图元被视为并集:
DiscretizeGraphics[[image]]Area[%]范围 (16)
Graphics (9)
离散包括 Circle 的二维特殊区域:
DiscretizeGraphics[Graphics[{Circle[]}]]DiscretizeGraphics[Graphics[{Parallelogram[{0, 0}, {{1, 1}, {1, 0}}]}]]离散由包括 Point、Line 和 Polygon 的 GraphicsComplex 组成的 Graphics:
v = {{0, 0}, {3, 0}, {3, 3}, {0, 3}};g = Graphics /@ {GraphicsComplex[v, Point[{1, 2, 3, 4}]], GraphicsComplex[v, Line[{1, 2, 3, 4, 1}]], GraphicsComplex[v, Polygon[{1, 2, 3, 4}]]}DiscretizeGraphics /@ g离散由包括 Rectangle、Circle 和 Disk 的 GraphicsComplex 组成的 Graphics:
v = {{0, 0}, {2, 0}, {2, 2}, {0, 2}};g = Graphics /@ {GraphicsComplex[v, Rectangle /@ {1, 2, 3, 4}], GraphicsComplex[v, Circle /@ {1, 2, 3, 4}], GraphicsComplex[v, Disk /@ {1, 2, 3, 4}]}DiscretizeGraphics /@ gg = Graphics[{Brown, Disk[{-1, 0}, 2], LightBlue, Rectangle[{0, -2}, {4, 2}], Red, Point[{6, 1}], Circle[{5, 0}, 2], Line[{{-4, 0}, {8, 0}}]}]DiscretizeGraphics[g, _Circle | _Rectangle]DiscretizeGraphics[g, x_ /; RegionDimension[x] < 2]离散 All 基元:
DiscretizeGraphics[g, All]有界分段线性 Graphics 基元可以被精确表示:
g = Graphics[{Orange, Triangle[{{-1, 1}, {0, 2}, {1, 1}}], Blue, Rectangle[{-1, 0}], Yellow, Simplex[2], Brown, Parallelogram[{2, 0}, {{-1, 0}, {-1, 1}}], Purple, Polygon[{{2, 1}, {4, 0}, {3, 1}, {4, 2}}]}]DiscretizeGraphics[g]无界分段线性 Graphics 基元仅能在有限范围内表示:
p = {InfiniteLine[{0, 0}, {1, 1}], HalfLine[{0, 0}, {-1, 1}], HalfPlane[{{1, 0}, {2, 1}}, {1, -1}], ConicHullRegion[{{-1, 0}}, {{-1, -1}, {-1, 1}}]};g = Graphics[p, PlotRange -> {{-3, 3}, {-1.5, 1.5}}]DiscretizeGraphics[g]非线性 Graphics 基元仅能被近似表示:
g = Graphics[{BSplineCurve[{{0, 0}, {1, -1}, {2, -1}, {3, 0}, {4, -2}, {5, 0}}], Circle[{2, 1}]}]DiscretizeGraphics[g]涉及 GraphicsComplex 的图形:
v = Table[15{Cos[t], Sin[t]}, {t, 0, 4Pi, 4Pi / 5}];g = Graphics[GraphicsComplex[v, {Orange, Line[{1, 4, 2, 5, 3, 1}], Polygon[{1, 2, 3, 4, 5}]}]]DiscretizeGraphics[g]使用 MaxCellMeasure 控制离散化水平:
g = Graphics[{Disk[{0, 0}], Circle[{1, 0}]}]Table[DiscretizeGraphics[g, MaxCellMeasure -> {"Length" -> m}], {m, {0.9, 0.6, 0.3}}]Graphics3D (7)
离散包括 Cone 的三维特殊区域:
DiscretizeGraphics[Graphics3D[{Cone[]}]]DiscretizeGraphics[Graphics3D[{Prism[{{1, 0, 1}, {0, 0, 0}, {2, 0, 0}, {1, 2, 1}, {0, 2, 0}, {2, 2, 0}}]}]]离散由包括 Point、Line 和 Polygon 的 GraphicsComplex 组成的 Graphics3D:
v = {{0, 0, 0}, {2, 0, 0}, {2, 2, 0}, {0, 2, 0}, {1, 1, 2}};
i = {{1, 2, 5}, {2, 3, 5}, {3, 4, 5}, {4, 1, 5}};g = Graphics3D /@ {GraphicsComplex[v, {PointSize@Large, Point[Range@5]}], GraphicsComplex[v, Line[i]], GraphicsComplex[v, Polygon[i]]}DiscretizeGraphics /@ g离散整个 Graphics3D 场景,将多个基元当作并集处理:
DiscretizeGraphics[[image]]Volume[%]p = {Point[Tuples[{0, 1}, 3]], Table[Line[{{x, -0.5, 0}, {x, -2, 0}}], {x, 2, 6}],
Triangle[{{6, 0, 0}, {4.5, 0, 0}, {5, 2, 0}}], Cone[{{3, 1, 0}, {3, 1, 2}}]};g = Graphics3D[p, Boxed -> False]DiscretizeGraphics[g, _Line | _Cone]DiscretizeGraphics[g, x_ /; RegionDimension[x] < 2]离散 All 基元:
DiscretizeGraphics[g, All]有界分段线性 Graphics3D 基元可以被精确表示:
p = {Point[{-3, 0, 0}], Line[{{-2.5, 0, 0}, {-1.5, 0, 0}}], Triangle[{{-1.2, 0, 0}, {-0.5, 0, 0}, {-1, 1, 0}}], Parallelepiped[{0, 0, 0}, {{1, 0, 0}, {1, 1, 0}, {0, 1, 1}}]};g = Graphics3D[p, Boxed -> False]DiscretizeGraphics[g]无界 Graphics3D 基元仅能在有限范围内表示:
p = {InfiniteLine[{0, 0, 0}, {1, 0, 0}], HalfLine[{0, 0, 0}, {0, 0, -1}], InfinitePlane[{0, 0, -2}, {{1, 0, 0}, {0, 1, 0}}], HalfPlane[{{-1 / 2, 0, -2}, {-1 / 2, 1, -2}}, {-1, 0, 1}],
ConicHullRegion[{{0, 0, 0}}, {{1, 1, 0}, {0, 1, 1}, {1, 0, 1}}]};g = Graphics3D[p, Boxed -> False, PlotRange -> {{-3, 3}, {-3, 3}, {-6, 3}}]DiscretizeGraphics[g]非线性 Graphics3D 基元仅能被近似表示:
g = Graphics3D[{Cylinder[{{2, 2, 0}, {2, 2, 2}}, 1], Sphere[{3, 3, 1}], BSplineSurface[Table[{i, j, RandomReal[{-1, 0}]}, {i, 5}, {j, 5}]]}]DiscretizeGraphics[g]选项 (24)
AccuracyGoal (1)
MaxCellMeasure (6)
mr = DiscretizeGraphics[Graphics[{Disk[{0, 0}], Circle[{1, 0}]}], MaxCellMeasure -> 0.1]AnnotationValue[{mr, 2}, MeshCellMeasure]g = Graphics3D[{Cylinder[{{2, 2, 0}, {2, 2, 2}}, 1], Sphere[{3, 3, 1}]}]mr = DiscretizeGraphics[g, MaxCellMeasure -> 0.1]单元体积的 Histogram:
Histogram[AnnotationValue[{mr, 3}, MeshCellMeasure]]g = Graphics[{Circle[{0, 0}], Circle[{1, 0}]}]Table[DiscretizeGraphics[g, MaxCellMeasure -> {"Length" -> m}], {m, {0.8, 0.1, 0.05}}]g = Graphics[{Disk[{0, 0}], Disk[{1, 0}]}]Table[DiscretizeGraphics[g, MaxCellMeasure -> {"Area" -> m}], {m, {0.4, 0.2, 0.05}}]g = Graphics3D[{Cylinder[{{2, 2, 0}, {2, 2, 2}}, 1], Sphere[{3, 3, 1}]}]Table[DiscretizeGraphics[g, MaxCellMeasure -> {"Area" -> m}], {m, {1, 0.1, 0.01}}]g = Graphics3D[{Ball[]}]Table[DiscretizeGraphics[g, MaxCellMeasure -> {"Volume" -> m}], {m, {0.3, 0.01, 0.001}}]MeshCellHighlight (2)
MeshCellHighlight 允许你指定 MeshRegion 的部分的突出显示:
DiscretizeGraphics[Graphics[Disk[]], MeshCellHighlight -> {{1, All} -> Red, {0, All} -> Green}]DiscretizeGraphics[Graphics[Line[{{{0, 0}, {1, 0}}, {{1, 0}, {2, 0}}}]], MeshCellHighlight -> {{1, 1} -> {Thick, Red}, {1, 2} -> {Dashed, Green}}]DiscretizeGraphics[Graphics[Line[{{{0, 0}, {1, 0}}, {{1, 0}, {2, 0}}}]], MeshCellHighlight -> {Line[{1, 2}] -> {Thick, Red}, Line[{2, 3}] -> {Dashed, Green}}]MeshCellLabel (3)
MeshCellLabel 可用于对 MeshRegion 的部分添加标签:
DiscretizeGraphics[Graphics[Point[{{0, 0}, {1, 0}, {2, 0}}]], MeshCellLabel -> {0 -> "Index"}]DiscretizeGraphics[Graphics[{Parallelogram[{0, 0}, {{1, 1}, {1, 0}}]}], MeshCellLabel -> {0 -> "Index", 1 -> "Index"}]DiscretizeGraphics[Graphics[Line[{{{0, 0}, {1, 0}}, {{1, 0}, {2, 0}}}]], MeshCellLabel -> {{1, 1} -> "x", {1, 2} -> "y"}]DiscretizeGraphics[Graphics[Line[{{{0, 0}, {1, 0}}, {{1, 0}, {2, 0}}}]], MeshCellLabel -> {Line[{1, 2}] -> "x", Line[{2, 3}] -> "y"}]MeshCellMarker (1)
MeshCellMarker 可用于将数值赋予 MeshRegion 的部分:
DiscretizeGraphics[Graphics[Point[{{0, 0}, {1, 0}, {2, 0}}]], MeshCellMarker -> {{0, 1} -> 1, {0, 2} -> 2, {0, 3} -> 3}]使用 MeshCellLabel 显示记号:
DiscretizeGraphics[Graphics[Point[{{0, 0}, {1, 0}, {2, 0}}]], MeshCellMarker -> {{0, 1} -> 1, {0, 2} -> 2, {0, 3} -> 3}, MeshCellLabel -> {0 -> "Marker"}]MeshCellShapeFunction (2)
MeshCellShapeFunction 允许您指定 MeshRegion 的部分的函数:
DiscretizeGraphics[Graphics[Line[{{0, 0}, {2, 0}, {1, Sqrt[3]}, {0, 0}}]], MeshCellShapeFunction -> {0 -> (Disk[#, .1]&)}]DiscretizeGraphics[Graphics[Line[{{0, 0}, {2, 0}, {1, Sqrt[3]}, {0, 0}}]], MeshCellShapeFunction -> {{0, 1} -> (Disk[#, .1]&), {0, 2} -> (Disk[#, {.1, .2}]&)}]DiscretizeGraphics[Graphics[Line[{{0, 0}, {2, 0}, {1, Sqrt[3]}, {0, 0}}]], MeshCellShapeFunction -> {Point[1] -> (Disk[#, .1]&), Point[2] -> (Disk[#, {.1, .2}]&)}]MeshCellStyle (2)
MeshCellStyle 允许您指定 MeshRegion 的部分的样式:
DiscretizeGraphics[Graphics[Disk[]], MeshCellStyle -> {{1, All} -> Red, {0, All} -> Green}]DiscretizeGraphics[Graphics[Line[{{{0, 0}, {1, 0}}, {{1, 0}, {2, 0}}}]], MeshCellStyle -> {{1, 1} -> {Thick, Red}, {1, 2} -> {Dashed, Green}}]DiscretizeGraphics[Graphics[Line[{{{0, 0}, {1, 0}}, {{1, 0}, {2, 0}}}]], MeshCellStyle -> {Line[{1, 2}] -> {Thick, Red}, Line[{2, 3}] -> {Dashed, Green}}]PlotRange (4)
Automatic 包括有限区域的整个范围:
g = Graphics[{Triangle[], Circle[{-1, -1}]}];DiscretizeGraphics[g, PlotRange -> Automatic]Automatic 包括无限区域的部分范围:
g = Graphics[{HalfLine[{0, 0}, {-1, 1}], HalfPlane[{{1, 0}, {2, 1}}, {1, -1}]}];DiscretizeGraphics[g, PlotRange -> Automatic]g = Graphics[{Disk[{0, 0}], Circle[{1.5, 0}]}, PlotRange -> {{-1, 3}, {-1, 1}}]DiscretizeGraphics[g]DiscretizeGraphics[g, PlotRange -> {{0, 3}, {0, 1}}]g = Graphics[{Circle[], HalfPlane[{{1, 0}, {2, 1}}, {1, -1}]}];DiscretizeGraphics[g, PlotRange -> {{-3, 3}, {-3, 3}}]g = Graphics3D[{Ball[], Sphere[{2, 0, 0}]}]DiscretizeGraphics[g, PlotRange -> {{-1, 3}, {0.1, 1}, {-2, 2}}]PlotTheme (2)
DiscretizeGraphics[Graphics3D[Pyramid[{{0, 0, 0}, {2, 0, 0}, {2, 2, 0}, {0, 2, 0}, {1, 1, 2}}]], PlotTheme -> "Detailed"]DiscretizeGraphics[Graphics[Disk[]], PlotTheme -> "Detailed"]DiscretizeGraphics[Graphics3D[Pyramid[{{0, 0, 0}, {2, 0, 0}, {2, 2, 0}, {0, 2, 0}, {1, 1, 2}}]], PlotTheme -> "Lines"]DiscretizeGraphics[Graphics[Disk[]], PlotTheme -> "Lines"]PrecisionGoal (1)
比较每个 PrecisionGoal 设置的结果:
g = Graphics3D[{Cylinder[{{2, 2, 0}, {2, 2, 2}}, 1], Sphere[{3, 3, 1}]}]{mr2, mr3} = Table[DiscretizeGraphics[g, PrecisionGoal -> n], {n, {1, 3}}]应用 (4)
g = KnotData["Trefoil", "KnotDiagram"];ℛ = DiscretizeGraphics[g]//QuietArcLength[ℛ]p = PolyhedronData["Dodecahedron"];ℛ = DiscretizeGraphics[p]Area[ℛ]把 Text 转化为几何区域:
t = Text[Style["π", Bold]]DiscretizeGraphics[t, _Text, MaxCellMeasure -> 0.1]DiscretizeGraphics[CountryData["France", "Polygon"]]属性和关系 (9)
g = Graphics[{Rectangle[], Circle[], Line[{{1, -1}, {-1, 1}}]}]DiscretizeGraphics[g]g = Graphics[{Line[{{1, -1}, {-1, 1}}], Triangle[], Rectangle[{-1, -1}, {0, 0}]}]DiscretizeGraphics[g]g = Graphics[{InfiniteLine[{0, 0}, {1, 1}], HalfPlane[{{1, 0}, {2, 1}}, {1, -1}]}, PlotRange -> {{-1.5, 2.75}, {-1.5, 1.5}}]DiscretizeGraphics[g]g = Graphics[Table[Circle[{0, 0}, r], {r, {1, 4, 7}}]]DiscretizeGraphics[g]使用 BoundaryDiscretizeGraphics 得到 BoundaryMeshRegion 表示:
g = Graphics[{Brown, Disk[{1.5, 1}], Orange, Rectangle[]}]{br, mr} = {BoundaryDiscretizeGraphics[g], DiscretizeGraphics[g]}{BoundaryMeshRegionQ[br], MeshRegionQ[mr]}DiscretizeRegion 可用于离散任何 RegionQ 对象:
DiscretizeRegion[ImplicitRegion[x ^ 2 - y ^ 2 ≤ 1, {{x, -2, 2}, {y, -2, 2}}]]DiscretizeGraphics 可用于离散 Graphics 和 Graphics3D 对象:
DiscretizeGraphics[Graphics[{BezierCurve[{{0, 1}, {1, 1}, {2, -1}, {5, 1}}], Circle[]}]]{DiscretizeRegion[Disk[]], DiscretizeGraphics[Disk[]]}r = Disk[{0, 0}, 1];RegionQ[r]Area[r]Area[DiscretizeGraphics[r]]Rasterize 离散含有 Raster 对象的 Graphics 的任意渲染表达式:
g = Graphics[{Disk[{0, 0}], Circle[{1, 0}]}]Rasterize[g, RasterSize -> {30, 20}, ImageSize -> 100]g = Graphics[{Disk[{0, 0}], Circle[{1, 0}]}]Image[g, ImageSize -> {30, 20}, Magnification -> 4]文本
Wolfram Research (2014),DiscretizeGraphics,Wolfram 语言函数,https://reference.wolfram.com/language/ref/DiscretizeGraphics.html (更新于 2015 年).
CMS
Wolfram 语言. 2014. "DiscretizeGraphics." Wolfram 语言与系统参考资料中心. Wolfram Research. 最新版本 2015. https://reference.wolfram.com/language/ref/DiscretizeGraphics.html.
APA
Wolfram 语言. (2014). DiscretizeGraphics. Wolfram 语言与系统参考资料中心. 追溯自 https://reference.wolfram.com/language/ref/DiscretizeGraphics.html 年
BibTeX
@misc{reference.wolfram_2026_discretizegraphics, author="Wolfram Research", title="{DiscretizeGraphics}", year="2015", howpublished="\url{https://reference.wolfram.com/language/ref/DiscretizeGraphics.html}", note=[Accessed: 06-September-2026]}
BibLaTeX
@online{reference.wolfram_2026_discretizegraphics, organization={Wolfram Research}, title={DiscretizeGraphics}, year={2015}, url={https://reference.wolfram.com/language/ref/DiscretizeGraphics.html}, note=[Accessed: 06-September-2026]}