ListSliceContourPlot3D
ListSliceContourPlot3D[farr,surf]
生成数值被切片至曲面 surf 的三维 farr 的等高线图.
ListSliceContourPlot3D[{{x1,y1,z1,f1},{x2,y2,z2,f2},…},surf]
生成数值 fi 在点 {xi,yi,zi} 处的切片等高线图.
ListSliceContourPlot3D[…,{surf1,surf2,…}]
生成若干个切片 surf1、surf2、… 上的切片等高线图.
更多信息和选项


- ListSliceContourPlot3D 给出立体内部曲面上的平滑等高线.
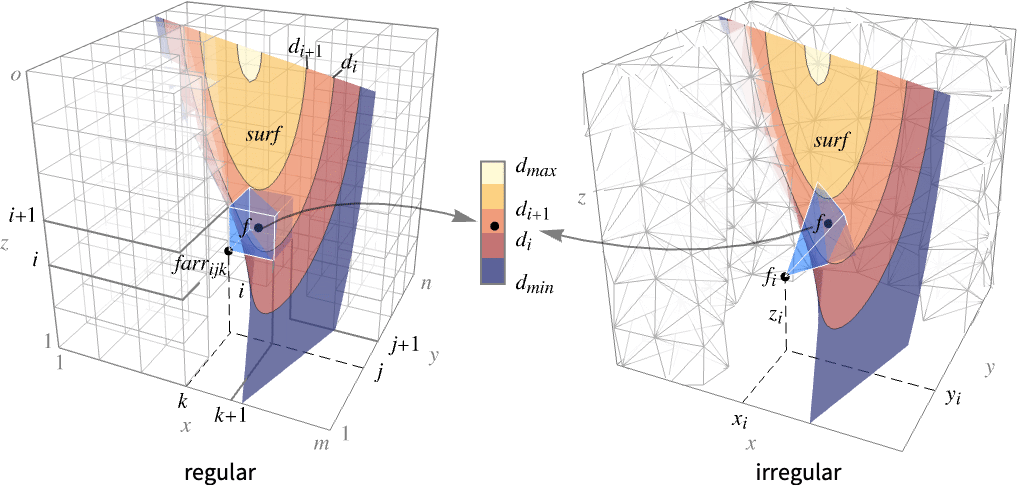
- ListSliceContourPlot3D 在曲面 surf 上构建等值线,对应于插值函数
 的值为常数 d1、d2 等的水平集. 默认情况下,曲线间的区域被着色,以便更容易识别值介于 di 和 di+1 之间的区域.
 - 对于常规数据,函数
 在
在  处的值为 farr[[i,j,k]].
 - 对于不规则数据,
 在
在  处的值为 fi.
 - 该函数可视化曲面
 ,其中,对于常规数据,区域
  是笛卡儿积
是笛卡儿积  ,对于不规则数据,则为凸包 {{x1,y1,z1},…,{xn,yn,zn}}.
 - ListSliceContourPlot3D[Tabular[…]cspec] 使用列规范 cspec 从表格对象中提取并绘制数值.
- 在绘制表格数据时,允许使用以下形式的列规范 cspec:
-
{colx,coly,colz,colf} 绘制列 f 与列 x、y 和 z的对比图 - 可以给出下列基本切片曲面 surfi:
-
Automatic 自动确定切片曲面 
"CenterPlanes" 过中心点的坐标平面 
"BackPlanes" 图形后面的坐标平面 
"XStackedPlanes" 沿  轴叠放的坐标平面
"YStackedPlanes" 沿  轴叠放的坐标平面
"ZStackedPlanes" 沿  轴叠放的坐标平面
"DiagonalStackedPlanes" 沿对角线叠放的坐标平面 
"CenterSphere" 位于中心的球面 
"CenterCutSphere" 切去楔形块的球面 
"CenterCutBox" 八分之一被切掉的盒子 - ListSliceContourPlot3D[data] 等价于 ListSliceContourPlot3D[data,Automatic].
- 下列参数化可用于基本切片曲面:
-
{"XStackedPlanes",n}, 生成 n 个均匀间隔的平面 {"XStackedPlanes",{x1,x2,…}} 生成平面 x=xi {"CenterCutSphere",ϕopen} 正对视点处切去角 ϕopen {"CenterCutSphere",ϕopen,ϕcenter} 以  平面上的 ϕcenter 为中心角切去角 ϕopen
 - "YStackedPlanes"、"ZStackedPlanes" 和 "XStackedPlanes" 的规范一样,在“范围”下面的例子中会展示更多的特性.
- 可以使用下面一般的切片曲面 surfi:
-
surfaceregion 三维空间中的二维区域,例如 Hyperplane volumeregion 三维空间中的三维区域,其中 surfi 为边界曲面,例如 Cuboid - 可将下列封装用于切片曲面 surfi:
-
Annotation[surf,label] 提供注释 Button[surf,action] 定义当曲面被点击时应执行的命令 EventHandler[surf,…] 定义曲面的通用事件处理程序 Hyperlink[surf,uri] 把曲面变为一个超链接 PopupWindow[surf,cont] 在曲面上添加一个弹出窗口 StatusArea[surf,label] 当鼠标悬停于曲面上时在状态栏中显示的内容 Tooltip[surf,label] 在曲面上添加一个提示条 - ListSliceContourPlot3D 和 Graphics3D 有同样的选项,不同之处和更多选项如下所示: [所有选项的列表]
-
Axes True 是否画出坐标轴 BoundaryStyle Automatic 曲面边界处的样式 BoxRatios {1,1,1} 三维边界盒的比例 ClippingStyle None 如何绘制被 PlotRange 剪掉的数值 ColorFunction Automatic 怎样对图形进行着色 ColorFunctionScaling True 是否缩放传递给 ColorFunction 的参数 Contours Automatic 在每个曲面上显示多少个或显示什么样的等高线 ContourShading Automatic 怎样处理等高线之间区域的色调 ContourStyle Automatic 等高线的样式 DataRange Automatic 数据的 x、y 和 z 值的范围 PerformanceGoal $PerformanceGoal 优化的目标 PlotLegends None 颜色渐变的图例 PlotPoints Automatic 切片曲面 surfi 在各个方向上的近似样本数 PlotRange {Full,Full,Full,Automatic} f 的范围或要包括的其它值 PlotTheme $PlotTheme 绘图的整体外观主题样式 RegionFunction (True&) 怎样确定是否包含某个点 ScalingFunctions None 怎样缩放个别坐标 TargetUnits Automatic 使用的单位 - 默认情况下,传递给 ColorFunction 的是经过缩放的 f 值.
- 默认情况下,x、y、z 和 f 的值被传递给 RegionFunction.
- 对于维度为 {r,s,t} 的 farr,设置 DataRangeAutomatic 等价于 DataRange{{1,r},{1,s},{1,t}}.
- ScalingFunctions 的可能设置包括:
-
sf 缩放 f 等高线的值 {sx,sy,sz} 缩放 x、y 和 z 坐标轴 {sx,sy,sz,sf} 缩放 x、y 和 z 轴以及 f 等高线的值 - 常见的内置缩放函数 s 包括:
-
"Log" 
对数刻度,自动进行标记 "Log10" 
以 10 为底的对数刻度,用 10 的幂进行标记 "SignedLog" 
类似对数的刻度,包含 0 和负数 "Reverse" 
反转坐标的方向

所有选项的列表


范例
打开所有单元关闭所有单元范围 (29)
曲面 (9)
在立体基元上画图等价于在 RegionBoundary[reg] 上画图:
数据 (8)
对于由 ![]() 值组成的规则数据,
值组成的规则数据,![]() 、
、![]() 和
和 ![]() 数据反映了它们在数组中的位置:
数据反映了它们在数组中的位置:
利用 DataRange 明确指定 ![]() 、
、![]() 和
和 ![]() 数据的范围:
数据的范围:
绘制由 (![]() ,
, ![]() ,
, ![]() ,
, ![]() ) 元组组成的不规则数据的插值等高线图:
) 元组组成的不规则数据的插值等高线图:
绘制由 SparseArray 给出的值数组的等高线图:
绘制由 QuantityArray 给出的值数组的密度图:
用 Contours 指定等高线的条数:
用 PlotPoints 来控制曲面的采样:
用 RegionFunction 来显示被遮挡的切片:
演示 (11)
用 PlotTheme 对整体样式进行配置:
用 PlotLegends 显示不同值对应的颜色条:
用 Axes 控制坐标轴的显示:
用 AxesLabel 对坐标轴进行标注,用 PlotLabel 对整个图线进行标注:
用 ColorFunction 根据数据值对图线着色:
用 ContourShading 指定等高线之间区域的样式:
用 ContourStyle 指定等高线的样式:
用 BoundaryStyle 指定切片曲面边界的样式:
TargetUnits 指定可视化时用什么单位:
选项 (40)
BoundaryStyle (1)
用 BoundaryStyle 指定切片曲面边界的样式:
ClippingStyle (2)
ColorFunction (3)
ColorFunctionScaling (2)
ContourShading (4)
ContourShadingAutomatic 根据 ColorFunction 计算等高线区域的色调:
PlotLegends (1)
PlotLegends 自动挑选 Contours 和 ContourShading:
PlotRange (3)
PlotTheme (3)
ScalingFunctions (6)
TargetUnits (1)
将由 QuantityArray 指定的单位转换成由 TargetUnits 指定的单位:
应用 (10)
基本数据 (4)
模拟数据 (4)
属性和关系 (5)
用 ListSliceDensityPlot3D 来绘制曲面上的连续密度:
用 ListContourPlot3D 来绘制数常数值曲面:
用 ListDensityPlot3D 来呈现数据值的立体可视化:
用 SliceContourPlot3D 来绘制函数:
用 ListContourPlot 来绘制二维等高线图:
文本
Wolfram Research (2015),ListSliceContourPlot3D,Wolfram 语言函数,https://reference.wolfram.com/language/ref/ListSliceContourPlot3D.html (更新于 2025 年).
CMS
Wolfram 语言. 2015. "ListSliceContourPlot3D." Wolfram 语言与系统参考资料中心. Wolfram Research. 最新版本 2025. https://reference.wolfram.com/language/ref/ListSliceContourPlot3D.html.
APA
Wolfram 语言. (2015). ListSliceContourPlot3D. Wolfram 语言与系统参考资料中心. 追溯自 https://reference.wolfram.com/language/ref/ListSliceContourPlot3D.html 年