TimelinePlot
TimelinePlot[{date1,date2,…}]
makes a timeline plot with dates date1, date2, ….
TimelinePlot[{event1,event2,…}]
makes a timeline plot with events event1, event2, ….
TimelinePlot[{data1,data2,…}]
makes a timeline plot from multiple event datasets datai.
Details and Options
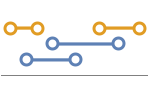
- TimelinePlot shows when events occur relative to each other.
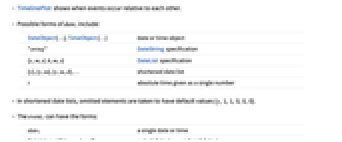
- Possible forms of datei include:
-
DateObject[…],TimeObject[…] date or time object "string" DateString specification {y,m,d,h,m,s} DateList specification {y}, {y,m}, {y,m,d}, … shortened date list t absolute time given as a single number - In shortened date lists, omitted elements are taken to have default values {y,1,1,0,0,0}.
- The eventi can have the forms:
-
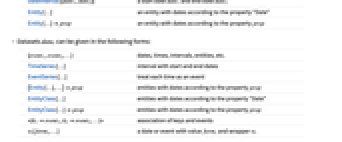
date1 a single date or time DateInterval[{date1,date2}] a start date date1 and end date date2 Entity[…] an entity with dates according to the property "Date" Entity[…]prop an entity with dates according to the property prop - Datasets datai can be given in the following forms:
-
{event1,event2,…} dates, times, intervals, entities, etc. TimeSeries[…] interval with start and end dates EventSeries[…] treat each time as an event {Entity[…],…}prop entities with dates according to the property prop EntityClass[…] entities with dates according to the property "Date" EntityClass[…]prop entities with dates according to the property prop <k1event1,k2event2,…> association of keys and events wi[formi,…] a date or event with value formi and wrapper wi - TimelinePlot[Tabular[…]cspec] extracts and plots values from the tabular object using the column specification cspec.
- The following forms of column specifications cspec are allowed for plotting tabular data:
-
col plot dates from column col {col1,col2,…,coln} plot columns {col1, …, coln} as groups of dates - The following wrappers wi can be used:
-
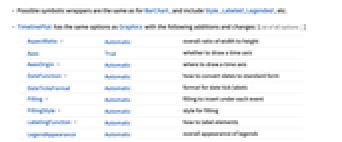
Annotation[e,label] provide an annotation Button[e,action] define an action to execute when the element is clicked EventHandler[e,…] define a general event handler for the element Hyperlink[e,uri] make the element act as a hyperlink Labeled[e,…] display the element with labeling Legended[e,…] include features of the element in a chart legend Mouseover[e,over] make the element show a mouseover form PopupWindow[e,cont] attach a popup window to the element StatusArea[e,label] display in the status area when the element is moused over Style[e,opts] show the element using the specified styles Tooltip[e,label] attach an arbitrary tooltip to the element - TimelinePlot has the same options as Graphics with the following additions and changes: [List of all options]
-
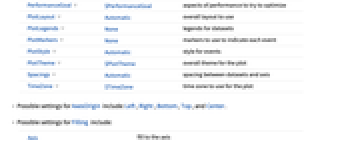
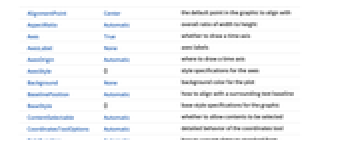
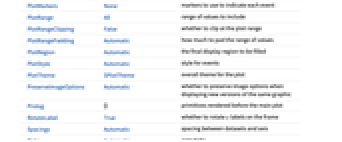
AspectRatio Automatic overall ratio of width to height Axes True whether to draw a time axis AxesOrigin Automatic where to draw a time axis DateFunction Automatic how to convert dates to standard form DateTicksFormat Automatic format for date tick labels Filling Automatic filling to insert under each event FillingStyle Automatic style for filling LabelingFunction Automatic how to label elements LegendAppearance Automatic overall appearance of legends PerformanceGoal $PerformanceGoal aspects of performance to try to optimize PlotLayout Automatic overall layout to use PlotLegends None legends for datasets PlotMarkers None markers to use to indicate each event PlotStyle Automatic style for events PlotTheme $PlotTheme overall theme for the plot Spacings Automatic spacing between datasets and axis TimeZone $TimeZone time zone to use for the plot - Possible settings for AxesOrigin include: Left, Right, Bottom, Top, and Center.
- Possible settings for Filling include:
-
Axis fill to the axis None no filling Bottom fill to the bottom of the plot Top fill to the top of the plot Above fill to the row above Below fill to the row below - TimelinePlot will place events in different rows. The overall placement in different rows can be affected using PlotLayout and the spacing between rows can controlled using Spacings.
- Possible settings for PlotLayout include:
-
"Grouped" each dataset uses a minimum number of rows 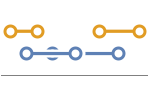
"Overlapped" each dataset uses a single row 
"Packed" use minimum number of rows for all events 
"Stacked" each event has a separate row 
"Vertical","VerticalGrouped",… vertical forms of layouts 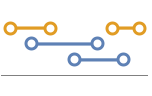
"Reverse","ReverseVertical",… reversed forms of layouts - Possible settings for Spacings include:
-
Automatic space rows evenly apart None no space between rows, but space to axis {s1,s2,…} use space s1 from axis to first row, then space s2, etc. - Style and other specifications from options and other constructs in TimelinePlot are effectively applied in the order PlotStyle, then Style and other wrappers, with later specifications overriding earlier ones.
-
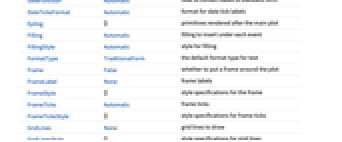
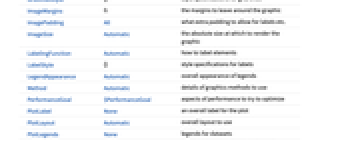
AlignmentPoint Center the default point in the graphic to align with AspectRatio Automatic overall ratio of width to height Axes True whether to draw a time axis AxesLabel None axes labels AxesOrigin Automatic where to draw a time axis AxesStyle {} style specifications for the axes Background None background color for the plot BaselinePosition Automatic how to align with a surrounding text baseline BaseStyle {} base style specifications for the graphic ContentSelectable Automatic whether to allow contents to be selected CoordinatesToolOptions Automatic detailed behavior of the coordinates tool DateFunction Automatic how to convert dates to standard form DateTicksFormat Automatic format for date tick labels Epilog {} primitives rendered after the main plot Filling Automatic filling to insert under each event FillingStyle Automatic style for filling FormatType TraditionalForm the default format type for text Frame False whether to put a frame around the plot FrameLabel None frame labels FrameStyle {} style specifications for the frame FrameTicks Automatic frame ticks FrameTicksStyle {} style specifications for frame ticks GridLines None grid lines to draw GridLinesStyle {} style specifications for grid lines ImageMargins 0. the margins to leave around the graphic ImagePadding All what extra padding to allow for labels etc. ImageSize Automatic the absolute size at which to render the graphic LabelingFunction Automatic how to label elements LabelStyle {} style specifications for labels LegendAppearance Automatic overall appearance of legends Method Automatic details of graphics methods to use PerformanceGoal $PerformanceGoal aspects of performance to try to optimize PlotLabel None an overall label for the plot PlotLayout Automatic overall layout to use PlotLegends None legends for datasets PlotMarkers None markers to use to indicate each event PlotRange All range of values to include PlotRangeClipping False whether to clip at the plot range PlotRangePadding Automatic how much to pad the range of values PlotRegion Automatic the final display region to be filled PlotStyle Automatic style for events PlotTheme $PlotTheme overall theme for the plot PreserveImageOptions Automatic whether to preserve image options when displaying new versions of the same graphic Prolog {} primitives rendered before the main plot RotateLabel True whether to rotate y labels on the frame Spacings Automatic spacing between datasets and axis Ticks Automatic axes ticks TicksStyle {} style specifications for axes ticks TimeZone $TimeZone time zone to use for the plot
List of all options
Examples
open allclose allBasic Examples (4)
Scope (34)
Data (14)
Plot a timeline using DateObject:
Using TimeObject:
Using DateString specifications:
Plot the "Date" property from a list of entities:
Use a specific property for a list of entities:
Use a specific property for a class of entities:
Using DateList specifications:
Use DateFunction to prepend a year to {month,day} lists:
Using AbsoluteTime specifications:
TimeSeries shows the overall range of dates:
EventSeries shows the discrete event dates:
Keys in an Association are used as labels:
Tabular Data (1)
Generate tabular data and generate DateObject instances that could be used:
Plot the scientists' dates of birth:
Use PivotToColumns to split LifeSpan column based on the area of knowledge of the scientists:
Display the lifespans for the mathematicians and physicists separately:
Wrappers (4)
Use wrappers on individual data, datasets, or collections of datasets:
Use PopupWindow to provide additional drilldown information:
Use Legended to add an additional legend:
Layouts (4)
Pack the events in each dataset:
Use a single row for all events in each dataset:
Use a single row for each event:
Plot time increasing from the right:
Plot time increasing from the bottom:
Place all events in the same row:
Place all events along the axis:
Presentation (5)
Use a theme with a bold color scheme:
Use unique markers for each dataset:
Use PlotStyle to change styles of events:
Use Filling to fill the events:
Change the FillingStyle:
Labeling and Legending (6)
Use Labeled to add bubble labels:
Specify locations for the labels:
Entity and EntityClass automatically create bubble labels when possible:
Create automatic placeholder legends for each dataset:
Use Legended to highlight a specific event:
PlotLegends->"Expressions" automatically picks up labels:
Options (41)
AspectRatio (1)
AxesOrigin (2)
The axis is below the events by default:
Change the axis position along with PlotLayout:
FillingStyle (4)
FillingStyle follows PlotStyle by default:
LabelingFunction (4)
Events automatically get a tooltip with the date or date range:
Entities are automatically labeled with a bubble:
Do not add tooltips or any other labels:
Write a custom label format to put in a Tooltip:
PerformanceGoal (3)
PlotLayout (3)
PlotLegends (2)
PlotMarkers (3)
Use unique PlotMarkers to distinguish sets of events:
PlotRange (2)
PlotStyle (4)
Spacings (4)
TimeZone (2)
Text
Wolfram Research (2015), TimelinePlot, Wolfram Language function, https://reference.wolfram.com/language/ref/TimelinePlot.html (updated 2025).
CMS
Wolfram Language. 2015. "TimelinePlot." Wolfram Language & System Documentation Center. Wolfram Research. Last Modified 2025. https://reference.wolfram.com/language/ref/TimelinePlot.html.
APA
Wolfram Language. (2015). TimelinePlot. Wolfram Language & System Documentation Center. Retrieved from https://reference.wolfram.com/language/ref/TimelinePlot.html