ListContourPlot3D
ListContourPlot3D[farr]
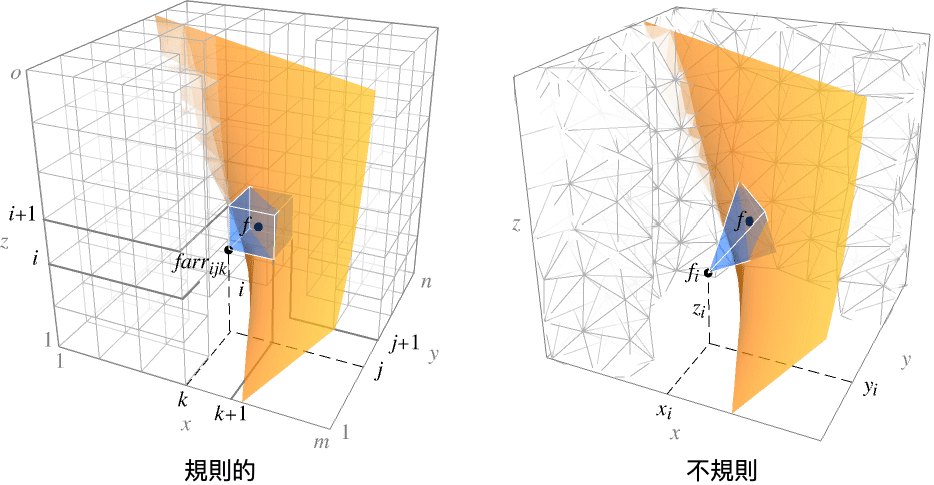
点{k,j,i}の値がfarr[[i,j,k]]の配列 farr から等高線プロットを生成する.
ListContourPlot3D[{{x1,y1,z1,f1},{x2,y2,z2,f2},…}]
点{xi,yi,zi}における値 fiから等高線プロットを生成する.
詳細とオプション


- ListContourPlot3Dは,等値面あるいはレベル集合プロットとしても知られている.
- ListContourPlot3Dは補間された関数
 が定数値 d1,d2等を持つ等位面を構築する.
 - 関数
 は規則的なデータについては
 で値 farr[[i,j,k]]を持つ.
 - 関数
 は不規則データについては
 で値 fiを持つ.
 - この関数は曲面
 を可視化する.ただし,領域
 は規則的なデータについてはデカルト積
 ,不規則データについては{{x1,y1,z1},…,{xn,yn,zn}}の凸包である.
 - ListContourPlot3D[Tabular[…]cspec]は,列指定 cspec を使って表オブジェクトから値を抽出し,これをプロットする.
- 次は,表データのプロットに使用可能な列指定 cspec の形式である.
-
{colx,coly,colz,colf} 列 f と列 x, y, z をプロットする - ListContourPlot3Dによってプロットされた等高面プロットには,不連続な部分が含まれることがある.
- デフォルトによりListContourPlot3Dは各等高線レベルを不透明な白い曲面として,表面法線を外側に向けて表示する.
- ListContourPlot3Dは,デフォルトで,f の値で等間隔に置かれた3つの等高線レベルを表示する.
- Contours->{f0}というオプション設定の場合,ListContourPlot3Dは f=f0というたった1つの等高線レベルしか示さない.
- ListContourPlot3Dには,Graphics3Dと同じオプションに以下の追加・変更を加えたオプションが使える. [全オプションのリスト]
-
Axes True 軸を描くかどうか BoundaryStyle Automatic 境界3Dボックスの比 BoxRatios {1,1,1} 領域の境界をどのように描くか ColorFunction Automatic 等高面をどのように彩色するか ColorFunctionScaling True ColorFunctionの引数をスケールするかどうか Contours 3 どの等高面を表示するか,またその数 ContourStyle White 等高面のスタイル DataRange Automatic データを推測するための座標の値の範囲 MaxPlotPoints Automatic 含める点の最大数 Mesh Automatic 各方向に何本のメッシュラインを描くか MeshFunctions {#1&,#2&,#3&} メッシュ区切りの置き方の決定方法 MeshShading None メッシュラインの間の領域にどのように陰影付けするか MeshStyle Automatic メッシュ区切りのスタイル Method Automatic 補間とデータ整理のためのメソッド PerformanceGoal $PerformanceGoal パフォーマンスのどの面について最適化するか PlotLegends None 曲面の凡例 PlotRange {Full,Full,Full,Automatic} 含む値の範囲 PlotTheme $PlotTheme プロットの全体的なテーマ RegionFunction (True&) 点を含めるかどうかの決定方法 ScalingFunctions None 個々の座標をどのようにスケールするか TextureCoordinateFunction Automatic テクスチャの座標をどのように決めるか TextureCoordinateScaling True TextureCoordinateFunctionの引数をスケールするかどうか - ListContourPlot3Dは滑らかな等高線を得るために,値を線形に補間する.
- array は実数の矩形配列でなければならない.実数ではない要素があると,プロットのそれに当たる部分に穴が開く.
- ListContourPlot3D[array]はデフォルトにより,各データ点の x,y,z の座標の値が1から始まって連続する整数であると解釈する.
- DataRange->{{xmin,xmax},{ymin,ymax},{zmin,zmax}}の設定は,使用するこれ以外の範囲の座標値を指定する.
- array はSparseArrayオブジェクトでもよい.
- MeshFunctionsとRegionFunctionの関数に渡される引数は x,y,z,f である.デフォルトで,ColorFunctionとTextureCoordinateFunctionの関数には,これらの引数をスケールしたものが与えられる.
- 次は,ScalingFunctionsの可能な設定である.
-
{sx,sy,sz} x,y,z の各軸をスケールする - 次は,よく使われる組込みのスケーリング関数 s である.
-
"Log" 
自動目盛ラベル付きの対数スケール "Log10" 
10のベキ乗に目盛が付いた,10を底とする対数スケール "SignedLog" 
0と負の数を含む対数に似たスケール "Reverse" 
座標の向きを逆にする - ListContourPlot3DはGraphics3D[GraphicsComplex[data]]を返す.
- 3D曲面に影響するテーマ
-

"DarkMesh" 色の濃いメッシュライン 
"GrayMesh" グレーのメッシュライン 
"LightMesh" 色の薄いメッシュライン 
"ZMesh" 垂直に配置されたメッシュライン 
"ThickSurface" 曲面に厚みを与える

全オプションのリスト


例題
すべて開くすべて閉じるスコープ (7)
データ (5)
![]() 値からなる通常のデータについては,
値からなる通常のデータについては,![]() ,
, ![]() ,
, ![]() のデータ範囲は整数値であるとみなされる:
のデータ範囲は整数値であるとみなされる:
明示的な ![]() ,
, ![]() ,
, ![]() のデータ範囲をDataRangeを使って与える:
のデータ範囲をDataRangeを使って与える:
![]() からなる不規則データについては,
からなる不規則データについては,![]() ,
, ![]() ,
, ![]() のデータ範囲はデータから推測される:
のデータ範囲はデータから推測される:
MaxPlotPointsを使って使用する点の数を制限する:
オプション (64)
BoundaryStyle (3)
ColorFunction (5)
ColorFunctionはContourStyleより優先度が高い:
ColorFunctionはMeshShadingより優先度が低い:
ContourStyle (7)
MaxPlotPoints (3)
Mesh (6)
Noneを使ってメッシュを描かないようにする:
MeshShading (5)
MeshShadingは,スタイリングに関してはContourStyleより優先度が高い:
MeshShadingをAutomaticに設定し,いくつかのセグメントにContourStyle を使う:
MeshShadingはColorFunctionとともに使うことができる:
ScalingFunctions (4)
デフォルトで,ContourPlot3Dはすべての方向に線形スケールを使用する:
TextureCoordinateFunction (5)
テキスト
Wolfram Research (2007), ListContourPlot3D, Wolfram言語関数, https://reference.wolfram.com/language/ref/ListContourPlot3D.html (2025年に更新).
CMS
Wolfram Language. 2007. "ListContourPlot3D." Wolfram Language & System Documentation Center. Wolfram Research. Last Modified 2025. https://reference.wolfram.com/language/ref/ListContourPlot3D.html.
APA
Wolfram Language. (2007). ListContourPlot3D. Wolfram Language & System Documentation Center. Retrieved from https://reference.wolfram.com/language/ref/ListContourPlot3D.html