



RegionPlot3D
RegionPlot3D[pred,{x,xmin,xmax},{y,ymin,ymax},{z,zmin,zmax}]
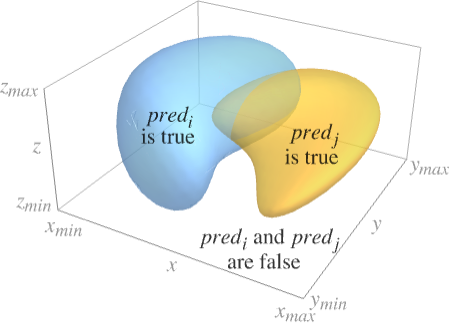
pred がTrueである3D領域を示すプロットを作成する.
RegionPlot3D[{pred1,pred2,…},…]
prediに対応する複数の領域をプロットする.
詳細とオプション
- 述部 pred は任意の不等式の論理結合でよい.
- RegionPlot3Dでプロットされた領域には不連続な部分が含まれることがある.
- RegionPlot3Dは,事実上Blockを使って,x,y,z を局所的なものとして扱う.
- RegionPlot3Dは属性HoldAllを有し,x,y,z に数値を割り当てた後で初めて pred を評価する.場合によってはEvaluateを使ってまず pred を記号的に評価した方が効率的かもしれない.
- RegionPlot3Dには,Graphics3Dのオプションに以下の追加・変更を加えたものが設定できる. [全オプションのリスト]
-
Axes True 軸を描くかどうか BoundaryStyle Automatic 領域間の境界をどのように描くか BoxRatios {1,1,1} 境界3Dボックスの比 ColorFunction Automatic 曲面の彩色方法 ColorFunctionScaling True ColorFunctionの引数をスケールするかどうか EvaluationMonitor None 各関数の評価時に評価される式 MaxRecursion Automatic 許容される再帰分割の最大数 Mesh Automatic 各方向に描くメッシュラインの本数 MeshFunctions {#1&,#2&,#3&} メッシュラインの置き方の決定方法 MeshShading None メッシュライン間の領域の陰影付けをどうするか MeshStyle Automatic メッシュラインのスタイル Method Automatic 曲面の細分化のためのメソッド NormalsFunction Automatic 有効な表面法線をどのように決定するか PerformanceGoal $PerformanceGoal パフォーマンスのどの面について最適化するか PlotLegends None 曲面の凡例 PlotPoints Automatic 各方向のサンプル点の初期の数 PlotRange Full プロットに含む値の範囲 PlotStyle Automatic 各領域の曲面のスタイルのためのグラフィックス指示子 PlotTheme $PlotTheme プロットの全体的なテーマ ScalingFunctions None 個々の座標をどのようにスケールするか TextureCoordinateFunction Automatic テクスチャ座標をどのように決めるか TextureCoordinateScaling True TextureCoordinateFunctionの引数をスケールするかどうか WorkingPrecision MachinePrecision 内部計算の精度 - RegionPlot3Dは,まずPlotPointsで指定された均等な間隔のサンプル点の3D格子上で pred を評価する.次に適応的アルゴリズムを用いて,pred がTrueとなるすべての領域の境界を求めるために最高MaxRecursion回まで再分割する.
- RegionPlot3Dは有限個のサンプル点しか使わないので,pred がTrueとなる領域を見逃す可能性もあるので注意されたい.結果の検証にはPlotPointsとMaxRecursionの設定値を大きくしてみるとよい.
- デフォルト設定のPlotRangeFullでは,RegionPlot3Dは xmin から xmax まで等の全範囲を明示的に含む.
- MeshAllの設定では,RegionPlot3Dは各領域を求めるために使ったすべての部分分割を表示するように明示的にメッシュラインを描く.
- RegionPlot3Dは一般に正の領域のみを見付けることができる.線のみあるいは点のみの領域は見付けられない.
- MeshFunctionsの関数に渡される引数は x,y,z である.ColorFunctionとTextureCoordinateFunctionの関数にはデフォルトでこれらの引数のスケールされたバージョンが与えられる.
- RegionPlot3DはGraphics3D[GraphicsComplex[data]]を返す.
- 次は,ScalingFunctionsの可能な設定である.
-
{sx,sy,sz} x,y,z の各軸をスケールする - 次は,よく使われる組込みのスケーリング関数 s である.
-
"Log" 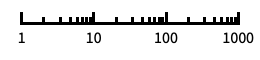
自動目盛ラベル付きの対数スケール "Log10" 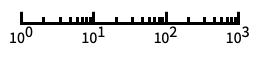
10のベキ乗に目盛が付いた,10を底とする対数スケール "SignedLog" 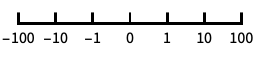
0と負の数を含む対数に似たスケール "Reverse" 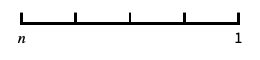
座標の向きを逆にする
全オプションのリスト
例題
すべて開く すべて閉じる例 (6)
RegionPlot3D[x ^ 2 + y ^ 3 - z ^ 2 > 0, {x, -2, 2}, {y, -2, 2}, {z, -2, 2}]RegionPlot3D[{x + y + z < -2, x + y + z > 2}, {x, -2, 2}, {y, -2, 2}, {z, -2, 2}]RegionPlot3D[x ^ 2 + y ^ 2 + z ^ 2 < 1 && x ^ 2 + y ^ 2 < z ^ 2, {x, -1, 1}, {y, -1, 1}, {z, -1, 1}, PlotPoints -> 35, PlotRange -> All]RegionPlot3D[x y z < 1, {x, -5, 5}, {y, -5, 5}, {z, -5, 5}, PlotStyle -> Directive[Yellow, Opacity[0.5]], Mesh -> None]RegionPlot3D[Sphere[]]RegionPlot3D[Sin[x] Cos[y] + Sin[y] Cos[z] + Sin[z] Cos[x] > 0, {x, y, z}∈ Ball[{0, 0, 0}, 10], PlotPoints -> 60, Mesh -> None, PlotStyle -> Directive[Orange, Specularity[White, 50], Opacity[0.9]], Boxed -> False, Axes -> False]スコープ (12)
サンプリング (3)
関数がTrueではない部分は除外される:
RegionPlot3D[x ^ 2 + y ^ 2 ≤ z ^ 2 + 1, {x, -2, 2}, {y, -2, 2}, {z, -2, 2}]RegionPlot3D[x ^ 2 + y ^ 2 + z ^ 2 ≤ 4 && y ^ 2 + z ^ 2 ≤ 3, {x, -2, 2}, {y, -2, 2}, {z, -2, 2}]RegionPlot3D[x y z ≥ 1, {x, -2, 2}, {y, -2, 2}, {z, -2, 2}]プレゼンテーション (9)
ある範囲に明示的なPlotStyleを与える:
RegionPlot3D[(x ^ 2 + y ^ 2 + z ^ 2) - (x ^ 4 + y ^ 4 + z ^ 4) > 1 / 2, {x, -1, 1}, {y, -1, 1}, {z, -1, 1}, PlotStyle -> Orange]RegionPlot3D[{x ^ 2 + y ^ 2 ≤ 1, x ^ 2 + z ^ 2 ≤ 1, y ^ 2 + z ^ 2 ≤ 1}, {x, -2, 2}, {y, -2, 2}, {z, -2, 2}, PlotStyle -> {Red, Orange, Yellow}, Mesh -> None]RegionPlot3D[z ^ 2 - 1 <= x ^ 2 + y ^ 2 ≤ z ^ 2 + 1, {x, -2.3, 2.3}, {y, -2.3, 2.3}, {z, -2, 2}, PlotLabel -> z ^ 2 - 1 <= x ^ 2 + y ^ 2 ≤ z ^ 2 + 1, PlotStyle -> Directive[Specularity[White, 10], Opacity[0.85], Purple], PlotPoints -> 20, AxesLabel -> Automatic, AxesEdge -> {{-1, 0}, {1, 0}, {-1, 0}}, Mesh -> False]RegionPlot3D[x ^ 2 + y ^ 2 + z ^ 2 ≤ 4 && y ^ 2 + z ^ 2 ≤ 2, {x, -2, 2}, {y, -2, 2}, {z, -2, 2}, Mesh -> 9, MeshFunctions -> {#2&, #3&}, MeshStyle -> Red]RegionPlot3D[x y z ≥ -1, {x, -5, 5}, {y, -5, 5}, {z, -5, 5}, Mesh -> 8, MeshFunctions -> {Function[{x, y, z}, Norm[{x, y, z}]]}, MeshShading -> {Directive[Yellow, Opacity[0.4]], FaceForm[Cyan, Red]}]RegionPlot3D[x y z ≥ -8, {x, -5, 5}, {y, -5, 5}, {z, -5, 5}, ColorFunction -> Function[{x, y, z}, Hue[Rescale[x y z, {1, 5 ^ 3}]]], ColorFunctionScaling -> False, Mesh -> None]RegionPlot3D[z ^ 2 - 1 <= x ^ 2 + y ^ 2 ≤ z ^ 2 + 1, {x, -2.3, 2.3}, {y, -2.3, 2.3}, {z, -2, 2}, PlotTheme -> "Business"]RegionPlot3D[z ^ 2 - 1 <= x ^ 2 + y ^ 2 ≤ z ^ 2 + 1, {x, -2.3, 2.3}, {y, -2.3, 2.3}, {z, -2, 2}, PlotTheme -> "Monochrome"]RegionPlot3D[x ^ 2 + y ^ 2 < z^2, {x, -10, 10}, {y, -10, 10}, {z, 0, 10}, ScalingFunctions -> {None, None, "Log"}]オプション (82)
Axes (3)
デフォルトで,Axesが描かれる:
RegionPlot3D[x ^ 2 + (2y) ^ 2 + (3z) ^ 2 ≤ 1, {x, -1, 1}, {y, -1 / 2, 1 / 2}, {z, -1 / 3, 1 / 3}]RegionPlot3D[x ^ 2 + (2y) ^ 2 + (3z) ^ 2 ≤ 1, {x, -1, 1}, {y, -1 / 2, 1 / 2}, {z, -1 / 3, 1 / 3}, Axes -> False]{RegionPlot3D[x ^ 2 + (2y) ^ 2 + (3z) ^ 2 ≤ 1, {x, -1, 1}, {y, -1 / 2, 1 / 2}, {z, -1 / 3, 1 / 3}, Axes -> {True, False, False}], RegionPlot3D[x ^ 2 + (2y) ^ 2 + (3z) ^ 2 ≤ 1, {x, -1, 1}, {y, -1 / 2, 1 / 2}, {z, -1 / 3, 1 / 3}, Axes -> {False, True, False}], RegionPlot3D[x ^ 2 + (2y) ^ 2 + (3z) ^ 2 ≤ 1, {x, -1, 1}, {y, -1 / 2, 1 / 2}, {z, -1 / 3, 1 / 3}, Axes -> {False, False, True}]}AxesLabel (4)
RegionPlot3D[x y z < 1, {x, -5, 5}, {y, -5, 5}, {z, -5, 5}]
RegionPlot3D[x y z < 1, {x, -5, 5}, {y, -5, 5}, {z, -5, 5}, AxesLabel -> z]RegionPlot3D[x y z < 1, {x, -5, 5}, {y, -5, 5}, {z, -5, 5}, AxesLabel -> {X, Y, Z}]RegionPlot3Dで指定された変数に基づくラベルを使う:
RegionPlot3D[x y z < 1, {x, -5, 5}, {y, -5, 5}, {z, -5, 5}, AxesLabel -> Automatic]AxesOrigin (2)
AxesStyle (3)
RegionPlot3D[x ^ 2 + (2y) ^ 2 + (3z) ^ 2 ≤ 1, {x, -1, 1}, {y, -1 / 2, 1 / 2}, {z, -1 / 3, 1 / 3}, AxesStyle -> Red]RegionPlot3D[x ^ 2 + (2y) ^ 2 + (3z) ^ 2 ≤ 1, {x, -1, 1}, {y, -1 / 2, 1 / 2}, {z, -1 / 3, 1 / 3}, AxesStyle -> {{Thick, Brown}, {Thick, Blue}, {Thick, Green}}]RegionPlot3D[x ^ 2 + (2y) ^ 2 + (3z) ^ 2 ≤ 1, {x, -1, 1}, {y, -1 / 2, 1 / 2}, {z, -1 / 3, 1 / 3}, AxesStyle -> Green, TicksStyle -> StandardBlue]BoundaryStyle (3)
RegionPlot3D[x y z ≥ 1, {x, -5, 5}, {y, -5, 5}, {z, -5, 5}, Mesh -> None]Noneを使って境界線を描かないようにする:
RegionPlot3D[x y z ≥ 1, {x, -5, 5}, {y, -5, 5}, {z, -5, 5}, BoundaryStyle -> None, Mesh -> None]RegionPlot3D[x y z ≥ 1, {x, -5, 5}, {y, -5, 5}, {z, -5, 5}, BoundaryStyle -> Red, Mesh -> None]BoxRatios (2)
RegionPlot3D[x ^ 2 + (2y) ^ 2 + (3z) ^ 2 ≤ 1, {x, -1, 1}, {y, -1 / 2, 1 / 2}, {z, -1 / 3, 1 / 3}]RegionPlot3D[x ^ 2 + (2y) ^ 2 + (3z) ^ 2 ≤ 1, {x, -1, 1}, {y, -1 / 2, 1 / 2}, {z, -1 / 3, 1 / 3}, BoxRatios -> Automatic]ColorFunction (5)


Table[RegionPlot3D[x y z ≥ 1, {x, -5, 5}, {y, -5, 5}, {z, -5, 5}, ColorFunction -> Function[{x, y, z}, f], PlotLabel -> f, AxesEdge -> {{-1, 0}, {1, 0}, {-1, 0}}], {f, {Hue[x], Hue[y], Hue[z]}}]
RegionPlot3D[x y z ≥ 1, {x, -5, 5}, {y, -5, 5}, {z, -5, 5}, ColorFunction -> "DarkRainbow"]スケールされていない  ,
 ,
 の値の関数に従って範囲に色付けする:
RegionPlot3D[x y z ≥ 1, {x, -5, 5}, {y, -5, 5}, {z, -5, 5}, ColorFunction -> Function[{x, y, z}, Hue[Rescale[x y z, {1, 5 ^ 3}]]], ColorFunctionScaling -> False]ColorFunctionはPlotStyleより優先順位が高い:
RegionPlot3D[x y z ≥ 1, {x, -5, 5}, {y, -5, 5}, {z, -5, 5}, ColorFunction -> "BlueGreenYellow", PlotStyle -> Red]ColorFunctionはMeshShadingより優先順位が低い:
RegionPlot3D[x y z ≥ 1, {x, -5, 5}, {y, -5, 5}, {z, -5, 5}, ColorFunction -> "BlueGreenYellow", Mesh -> 8, MeshShading -> {{{Automatic, StandardGray}, {StandardGray, Automatic}}, {{StandardGray, Automatic}, {Automatic, StandardGray}}}]ColorFunctionScaling (1)


ImageSize (7)
Tiny,Small,Medium,Largeのような名前付きのサイズを使う:
{RegionPlot3D[x ^ 2 + (2y) ^ 2 + (3z) ^ 2 ≤ 1, {x, -1, 1}, {y, -1 / 2, 1 / 2}, {z, -1 / 3, 1 / 3}, ImageSize -> Tiny], RegionPlot3D[x ^ 2 + (2y) ^ 2 + (3z) ^ 2 ≤ 1, {x, -1, 1}, {y, -1 / 2, 1 / 2}, {z, -1 / 3, 1 / 3}, ImageSize -> Small]}{RegionPlot3D[x ^ 2 + (2y) ^ 2 + (3z) ^ 2 ≤ 1, {x, -1, 1}, {y, -1 / 2, 1 / 2}, {z, -1 / 3, 1 / 3}, ImageSize -> 150], RegionPlot3D[x ^ 2 + (2y) ^ 2 + (3z) ^ 2 ≤ 1, {x, -1, 1}, {y, -1 / 2, 1 / 2}, {z, -1 / 3, 1 / 3}, AspectRatio -> 1.5, ImageSize -> 150]}{RegionPlot3D[x ^ 2 + (2y) ^ 2 + (3z) ^ 2 ≤ 1, {x, -1, 1}, {y, -1 / 2, 1 / 2}, {z, -1 / 3, 1 / 3}, ImageSize -> {Automatic, 150}], RegionPlot3D[x ^ 2 + (2y) ^ 2 + (3z) ^ 2 ≤ 1, {x, -1, 1}, {y, -1 / 2, 1 / 2}, {z, -1 / 3, 1 / 3}, AspectRatio -> 2, ImageSize -> {Automatic, 150}]}{RegionPlot3D[x ^ 2 + (2y) ^ 2 + (3z) ^ 2 ≤ 1, {x, -1, 1}, {y, -1 / 2, 1 / 2}, {z, -1 / 3, 1 / 3}, ImageSize -> UpTo[200]], RegionPlot3D[x ^ 2 + (2y) ^ 2 + (3z) ^ 2 ≤ 1, {x, -1, 1}, {y, -1 / 2, 1 / 2}, {z, -1 / 3, 1 / 3}, AspectRatio -> 2, ImageSize -> UpTo[200]]}グラフィックスの幅と高さを指定して,必要な場合はスペースで充填する:
RegionPlot3D[x ^ 2 + (2y) ^ 2 + (3z) ^ 2 ≤ 1, {x, -1, 1}, {y, -1 / 2, 1 / 2}, {z, -1 / 3, 1 / 3}, ImageSize -> {200, 250}, Background -> StandardBrown]AspectRatioFullと設定すると,使用可能なスペースが塗り潰される:
RegionPlot3D[x ^ 2 + (2y) ^ 2 + (3z) ^ 2 ≤ 1, {x, -1, 1}, {y, -1 / 2, 1 / 2}, {z, -1 / 3, 1 / 3}, AspectRatio -> Full, ImageSize -> {200, 250}, Background -> StandardBrown]{RegionPlot3D[x ^ 2 + (2y) ^ 2 + (3z) ^ 2 ≤ 1, {x, -1, 1}, {y, -1 / 2, 1 / 2}, {z, -1 / 3, 1 / 3}, ImageSize -> {UpTo[150], UpTo[100]}], RegionPlot3D[x ^ 2 + (2y) ^ 2 + (3z) ^ 2 ≤ 1, {x, -1, 1}, {y, -1 / 2, 1 / 2}, {z, -1 / 3, 1 / 3}, AspectRatio -> 2, ImageSize -> {UpTo[150], UpTo[100]}]}ImageSizeFullを使ってオブジェクト内の使用可能なスペースを塗り潰す:
Framed[Pane[RegionPlot3D[x ^ 2 + (2y) ^ 2 + (3z) ^ 2 ≤ 1, {x, -1, 1}, {y, -1 / 2, 1 / 2}, {z, -1 / 3, 1 / 3}, ImageSize -> Full, Background -> StandardBrown], {200, 200}]]Framed[Pane[RegionPlot3D[x ^ 2 + (2y) ^ 2 + (3z) ^ 2 ≤ 1, {x, -1, 1}, {y, -1 / 2, 1 / 2}, {z, -1 / 3, 1 / 3}, AspectRatio -> Full, ImageSize -> {Scaled[0.5], Scaled[0.5]}, Background -> StandardBrown], {200, 200}]]Mesh (7)
RegionPlot3D[x y z ≥ -1, {x, -5, 5}, {y, -5, 5}, {z, -5, 5}, Mesh -> All]RegionPlot3D[x y z ≥ -1, {x, -5, 5}, {y, -5, 5}, {z, -5, 5}, Mesh -> None]RegionPlot3D[x y z ≥ -1, {x, -5, 5}, {y, -5, 5}, {z, -5, 5}, Mesh -> 5] 方向に3本のメッシュラインを,
 方向に6本のメッシュラインを使う:
RegionPlot3D[x y z ≥ -1, {x, -5, 5}, {y, -5, 5}, {z, -5, 5}, Mesh -> {3, 6}, MeshFunctions -> {#1&, #2&}]RegionPlot3D[x y z ≥ -1, {x, -5, 5}, {y, -5, 5}, {z, -5, 5}, Mesh -> {{-2, 2}, {0}, {-2, 0, 2}}]RegionPlot3D[x y z ≥ -1, {x, -5, 5}, {y, -5, 5}, {z, -5, 5}, Mesh -> {{{-2, Red}, {2, Red}}, {{0, Thick}}, {{-2, Green}, {0, Green}, {2, Green}}}]RegionPlot3D[x y z ≥ 5, {x, -5, 5}, {y, -5, 5}, {z, -5, 5}, Mesh -> 10]MeshFunctions (2)


Table[RegionPlot3D[x y z ≥ -1, {x, -5, 5}, {y, -5, 5}, {z, -5, 5}, Mesh -> 10, MeshFunctions -> {Function[{x, y, z}, Evaluate[f]]}, PlotLabel -> f], {f, {x, y, z}}]RegionPlot3D[x y z ≥ -1, {x, -5, 5}, {y, -5, 5}, {z, -5, 5}, Mesh -> 10, MeshFunctions -> {Function[{x, y, z}, Norm[{x, y, z}]]}]MeshShading (5)
RegionPlot3D[x y z ≥ -1, {x, -5, 5}, {y, -5, 5}, {z, -5, 5}, MeshFunctions -> {#1 - #2&}, MeshShading -> {Red, Blue}]MeshShadingはスタイリングに関してはContourStyleよりも優先順位が高い:
RegionPlot3D[x y z ≥ -1, {x, -5, 5}, {y, -5, 5}, {z, -5, 5}, MeshFunctions -> {#1 - #2&}, MeshShading -> {None, Blue}]MeshShadingをAutomaticにして,ある線分にPlotStyleを使う:
RegionPlot3D[x y z ≥ -1, {x, -5, 5}, {y, -5, 5}, {z, -5, 5}, MeshFunctions -> {#1 - #2&}, MeshShading -> {Red, Automatic}, PlotStyle -> Directive[Opacity[0.5], Yellow]]MeshShadingはColorFunctionとともに使うことができる:
RegionPlot3D[x y z ≥ -1, {x, -5, 5}, {y, -5, 5}, {z, -5, 5}, MeshFunctions -> {#1 - #2&}, MeshShading -> {StandardGray, Automatic}, ColorFunction -> Function[{x, y, z}, Hue[z]]]RegionPlot3D[x y z ≥ -1, {x, -5, 5}, {y, -5, 5}, {z, -5, 5}, MeshShading -> Table[RGBColor[r, g, b], {r, 0, 1, 1 / 5}, {g, 0, 1, 1 / 5}, {b, 0, 1, 1 / 5}], Mesh -> 5, Lighting -> "Neutral"]MeshStyle (2)

RegionPlot3D[x y z ≥ -1, {x, -5, 5}, {y, -5, 5}, {z, -5, 5}, MeshFunctions -> {#1&}, MeshStyle -> Dashed, Mesh -> 5]

RegionPlot3D[x y z ≥ -1, {x, -5, 5}, {y, -5, 5}, {z, -5, 5}, Mesh -> 5, MeshFunctions -> {#1&, #2&}, MeshStyle -> {Dashed, Blue}]NormalsFunction (4)
RegionPlot3D[x ^ 2 + y ^ 2 + z ^ 2 < 1, {x, -1, 1}, {y, -1, 1}, {z, -1, 1}, Mesh -> None]Noneを使ってすべての多面体に平面的な陰影付けを施す:
RegionPlot3D[x ^ 2 + y ^ 2 + z ^ 2 < 1, {x, -1, 1}, {y, -1, 1}, {z, -1, 1}, NormalsFunction -> None, Mesh -> None]RegionPlot3D[x ^ 2 + y ^ 2 + z ^ 2 < 1, {x, -1, 1}, {y, -1, 1}, {z, -1, 1}, Mesh -> None, NormalsFunction -> Function[{x, y, z}, RandomReal[{-1, 1}, {3}]]]NormalsFunctionは切り取られた部分には適用されない:
RegionPlot3D[x ^ 2 + y ^ 2 + z ^ 2 < 3 / 2, {x, -1, 1}, {y, -1, 1}, {z, -1, 1}, NormalsFunction -> Function[{x, y, z}, RandomReal[{-1, 1}, {3}]], Mesh -> None]PerformanceGoal (2)
PlotLegends (3)
RegionPlot3D[{x ^ 2 + y ^ 2 ≤ 1, x ^ 2 + z ^ 2 ≤ 1, y ^ 2 + z ^ 2 ≤ 1}, {x, -2, 2}, {y, -2, 2}, {z, -2, 2}, PlotLegends -> {"aaa", "bbb", "ccc"}]RegionPlot3D[x y z ≥ -1, {x, -5, 5}, {y, -5, 5}, {z, -5, 5}, ColorFunction -> "TemperatureMap", PlotLegends -> Automatic]Placedを使って凡例をプロットの上に置く:
RegionPlot3D[x y z ≥ -1, {x, -5, 5}, {y, -5, 5}, {z, -5, 5}, ColorFunction -> "AvocadoColors", PlotLegends -> Placed[Automatic, Above]]PlotPoints (1)
PlotStyle (5)
RegionPlot3D[x y z ≥ -1, {x, -5, 5}, {y, -5, 5}, {z, -5, 5}]Noneを使って境界曲面にワイヤの枠を示す:
RegionPlot3D[x y z ≥ -1, {x, -5, 5}, {y, -5, 5}, {z, -5, 5}, PlotStyle -> None]RegionPlot3D[x y z ≥ -1, {x, -5, 5}, {y, -5, 5}, {z, -5, 5}, PlotStyle -> Directive[Specularity[White, 40], Orange], Mesh -> None]ColorFunctionはPlotStyleよりも優先順位が高い:
RegionPlot3D[x y z ≥ -1, {x, -5, 5}, {y, -5, 5}, {z, -5, 5}, Mesh -> None, PlotStyle -> Directive[Opacity[0.5], Red], ColorFunction -> Function[{x, y, z}, Hue[z]]]MeshShadingはPlotStyleよりも優先順位が高い:
RegionPlot3D[x y z ≥ -1, {x, -5, 5}, {y, -5, 5}, {z, -5, 5}, Mesh -> 5, MeshFunctions -> {#3&}, PlotStyle -> Directive[Opacity[0.5], Yellow], MeshShading -> {Red, Automatic}]PlotTheme (2)
ScalingFunctions (5)
RegionPlot3D[x ^ 2 + y ^ 2 < z^2, {x, -10, 10}, {y, -10, 10}, {z, 0, 10}]RegionPlot3D[x ^ 2 + y ^ 2 < z^2, {x, -10, 10}, {y, -10, 10}, {z, 0, 10}, ScalingFunctions -> {None, None, "Log"}]RegionPlot3D[x ^ 2 + y ^ 2 < z^2, {x, -10, 10}, {y, -10, 10}, {z, -10, 10}, ScalingFunctions -> {None, None, "SignedLog"}]ScalingFunctionsを使って  方向の座標の向きを逆にする:
RegionPlot3D[x ^ 2 + y ^ 2 < z^2, {x, -10, 10}, {y, -10, 10}, {z, 0, 10}, ScalingFunctions -> {None, None, "Reverse"}]RegionPlot3D[x ^ 2 + y ^ 2 < z^2, {x, -10, 10}, {y, -10, 10}, {z, 0, 10}, ScalingFunctions -> {None, None, {-Log[#]&, Exp[-#]&}}]TextureCoordinateFunction (4)


RegionPlot3D[(x ^ 2 + y ^ 2 + z ^ 2) - (x ^ 4 + y ^ 4 + z ^ 4) > 1 / 2, {x, -1, 1}, {y, -1, 1}, {z, -1, 1}, Mesh -> None, PlotStyle -> Texture[ExampleData[{"ColorTexture", "MultiSpiralsPattern"}]]]

RegionPlot3D[(x ^ 2 + y ^ 2 + z ^ 2) - (x ^ 4 + y ^ 4 + z ^ 4) > 1 / 2, {x, -1, 1}, {y, -1, 1}, {z, -1, 1}, Mesh -> None, TextureCoordinateFunction -> ({#1, #3}&), PlotStyle -> Texture[ExampleData[{"ColorTexture", "MultiSpiralsPattern"}]]]RegionPlot3D[(x ^ 2 + y ^ 2 + z ^ 2) - (x ^ 4 + y ^ 4 + z ^ 4) > 1 / 2, {x, -1, 1}, {y, -1, 1}, {z, -1, 1}, Mesh -> None, TextureCoordinateScaling -> False, PlotStyle -> Texture[ExampleData[{"ColorTexture", "MultiSpiralsPattern"}]]]テクスチャを使ってパラメータがどのように曲面にマップされるかをハイライトする:
texture = ArrayPlot[{{1, 1, 1, 2, 1, 1}, {2, 0, 0, 2, 0, 0}, {2, 0, 0, 2, 0, 0}, {2, 1, 1, 1, 1, 1}, {2, 0, 0, 2, 0, 0}, {2, 0, 0, 2, 0, 0}}, ColorRules -> {1 -> Red, 2 -> Blue, 0 -> White}, Frame -> False, PlotRangePadding -> None, ImagePadding -> None, ImageSize -> 100]RegionPlot3D[(x ^ 2 + y ^ 2 + z ^ 2) - (x ^ 4 + y ^ 4 + z ^ 4) > 1 / 2, {x, -1, 1}, {y, -1, 1}, {z, -1, 1}, Mesh -> None, PlotStyle -> Texture[texture]]TextureCoordinateScaling (1)
テクスチャにスケールされたあるいはスケールされていない座標を使う:
texture = ArrayPlot[{{1, 1, 1, 2, 1, 1}, {2, 0, 0, 2, 0, 0}, {2, 0, 0, 2, 0, 0}, {2, 1, 1, 1, 1, 1}, {2, 0, 0, 2, 0, 0}, {2, 0, 0, 2, 0, 0}}, ColorRules -> {1 -> Red, 2 -> Blue, 0 -> White}, Frame -> False, PlotRangePadding -> None, ImagePadding -> None, ImageSize -> 100]Table[RegionPlot3D[(x ^ 2 + y ^ 2 + z ^ 2) - (x ^ 4 + y ^ 4 + z ^ 4) > 1 / 2, {x, -1, 1}, {y, -1, 1}, {z, -1, 1}, Mesh -> None, PlotStyle -> Texture[texture], TextureCoordinateScaling -> s, PlotLabel -> s], {s, {True, False}}]Ticks (6)
RegionPlot3D[Sin[x y] >= z, {x, -2, 2}, {y, -2, 2}, {z, -2, 2}]RegionPlot3D[Sin[x y] >= z, {x, -2, 2}, {y, -2, 2}, {z, -2, 2}, Ticks -> None]RegionPlot3D[Sin[x y] >= z, {x, -2, 2}, {y, -2, 2}, {z, -2, 2}, Ticks -> {{-2, .5, 2}, {-2, 0, 2}, {-2, 1, 2}}]RegionPlot3D[Sin[x y] >= z, {x, -2, 2}, {y, -2, 2}, {z, -2, 2}, Ticks -> {{{-2, -a}, {.5, b}, {2, a}}, {{-2, -a}, {0, c}, {2, a}}, {{-2, -a}, {1, d}, {2, a}}}]RegionPlot3D[Sin[x y] >= z, {x, -2, 2}, {y, -2, 2}, {z, -2, 2}, Ticks -> {{{-2, -a, .01}, {.5, b, .01}, {2, a, .01}}, {{-2, -a, .35}, {0, c, .26}, {2, a, .18}}, {{-2, -a, .01}, {1, d, .12}, {2, a, .2}}}]RegionPlot3D[Sin[x y] >= z, {x, -2, 2}, {y, -2, 2}, {z, -2, 2}, Ticks -> {{{-2, -a, .01, Directive[Thick, Red]}, {.5, b, .01, Directive[Thick, Red]}, {2, a, .01, Directive[Thick, Red]}}, {{-2, -a, .35, Directive[Blue]}, {0, c, .26, Directive[Blue]}, {2, a, .18, Directive[Blue]}}, {{-2, -a, .01, Directive[Thick, Green]}, {1, d, .12, Directive[Thick, Green]}, {2, a, .2, Directive[Thick, Darker@Green]}}}]TicksStyle (3)
デフォルトで,目盛と目盛ラベルには軸と同じスタイルが使われる:
RegionPlot3D[Sin[x y] >= z, {x, -2, 2}, {y, -2, 2}, {z, -2, 2}, AxesStyle -> Directive[Red, Bold]]RegionPlot3D[Sin[x y] >= z, {x, -2, 2}, {y, -2, 2}, {z, -2, 2}, TicksStyle -> Directive[Red, Thick]]RegionPlot3D[Sin[x y] >= z, {x, -2, 2}, {y, -2, 2}, {z, -2, 2}, TicksStyle -> {Directive[Red, 16], Directive[Blue, 16], Directive[Green, 16]}]アプリケーション (3)
RegionPlot3D[x < 2y + z + 3 && y > x + 2z - 4, {x, -2, 2}, {y, -2, 2}, {z, -2, 2}, Mesh -> None, PlotPoints -> 50]RegionPlot3D[-1 ≤ x ≤ 1 && -1 ≤ y ≤ 1 && -1 ≤ z ≤ 1, {x, -2, 2}, {y, -2, 2}, {z, -2, 2}, Mesh -> None, PlotPoints -> 50]RegionPlot3D[-1 ≤ x ≤ 1 && -1 ≤ y ≤ 1 && -1 ≤ z ≤ 1 && Not[-1 / 2 ≤ x ≤ 1 / 2 && -1 / 2 ≤ y ≤ 1 / 2 && -1 / 2 ≤ z ≤ 1 / 2] && y ≥ 0, {x, -2, 2}, {y, -2, 2}, {z, -2, 2}, Mesh -> None, PlotPoints -> 50]RegionPlot3D[x ^ 2 + y ^ 2 + z ^ 2 ≤ 3, {x, -2, 2}, {y, -2, 2}, {z, -2, 2}, Mesh -> None]RegionPlot3D[1 ≤ x ^ 2 + y ^ 2 + z ^ 2 ≤ 3 && y ≥ 0, {x, -2, 2}, {y, -2, 2}, {z, -2, 2}, Mesh -> None, PlotPoints -> 50]RegionPlot3D[x ^ 2 + y ^ 2 + 1 / 2z ^ 2 ≤ 3, {x, -3, 3}, {y, -3, 3}, {z, -3, 3}, Mesh -> None, PlotPoints -> 35]RegionPlot3D[1 ≤ x ^ 2 + y ^ 2 + 1 / 2z ^ 2 ≤ 3 && y ≥ 0, {x, -3, 3}, {y, -3, 3}, {z, -3, 3}, Mesh -> None, PlotPoints -> 50]RegionPlot3D[x ^ 2 + y ^ 2 + z ^ 2 ≤ 3 && y ≥ 0 && y ≥ x + z, {x, -2, 2}, {y, -2, 2}, {z, -2, 2}, Mesh -> None, PlotPoints -> 50]PolyhedronDataの範囲を他の不等式と組み合せる:
dod = PolyhedronData["Dodecahedron", "RegionFunction"][x, y, z]RegionPlot3D[Evaluate[N[dod && Abs[x y z] > 1 / 20]], {x, -1.5, 1.5}, {y, -1.5, 1.5}, {z, -1.5, 1.5}, Mesh -> None, PlotPoints -> 75]特性と関係 (8)
面積にRegionPlotを使う:
RegionPlot[x ^ 2 + y ^ 2 < 1, {x, -2, 2}, {y, -2, 2}]ContourPlotとContourPlot3Dを方程式系に使う:
ContourPlot[Abs[Nest[(# ^ 2 + x + I y)&, x + I y, 8]] == 2, {x, -1.5, 0.5}, {y, -1.1, 1.1}]ContourPlot3D[-(x ^ 4 + y ^ 4 + z ^ 4) + (x ^ 2 + y ^ 2 + z ^ 2) == 1 / 2, {x, -1, 1}, {y, -1, 1}, {z, -1, 1}, Mesh -> None, ContourStyle -> Orange]複素平面上の領域にComplexRegionPlotを使う:
ComplexRegionPlot[Re[z ^ 3] > Im[z ^ 3], {z, 2}]RegionFunctionを使って他のプロットを制限する:
DensityPlot[Sin[x y], {x, -1.5, 0.5}, {y, -1.1, 1.1}, RegionFunction -> Function[{x, y, z}, Abs[Nest[(# ^ 2 + x + I y)&, x + I y, 8]] < 2]]Plot3D[Sin[x y], {x, -1.5, 0.5}, {y, -1.1, 1.1}, RegionFunction -> Function[{x, y, z}, Abs[Nest[(# ^ 2 + x + I y)&, x + I y, 8]] < 2]]ParametricPlot3Dをパラメトリック曲線と曲面に使う:
ParametricPlot3D[{r Cos[t], r Sin[t], r t / 6}, {r, 1, 2}, {t, 0, 6Pi}, Mesh -> None]IntegrateまたはNIntegrateをある範囲での積分に使う:
Integrate[x ^ 2Boole[x y z < 1 && -5 < x < 5 && -5 < y < 5 && -5 < z < 5], {x, -∞, ∞}, {y, -∞, ∞}, {z, -∞, ∞} ]NIntegrate[x ^ 2Boole[x y z < 1 && -5 < x < 5 && -5 < y < 5 && -5 < z < 5], {x, -∞, ∞}, {y, -∞, ∞}, {z, -∞, ∞} ]RegionPlot3D[x y z < 1, {x, -5, 5}, {y, -5, 5}, {z, -5, 5}]Maximize,NMaximizeあるいはFindMaximumをある範囲における最適化に使う:
Maximize[{x ^ 2 + y - z ^ 2, 1 ≤ x ^ 2 - y ^ 2 ≤ 4 && 1 ≤ x ^ 2 - z ^ 2 ≤ 4 && x y z ≤ 1 && x ≥ 0 && y ≥ 0 && z ≥ 0}, {x, y, z}]NMaximize[{x ^ 2 + y - z ^ 2, 1 ≤ x ^ 2 - y ^ 2 ≤ 4 && 1 ≤ x ^ 2 - z ^ 2 ≤ 4 && x y z ≤ 1 && x ≥ 0 && y ≥ 0 && z ≥ 0}, {x, y, z}]FindMaximum[{x ^ 2 + y - z ^ 2, 1 ≤ x ^ 2 - y ^ 2 ≤ 4 && 1 ≤ x ^ 2 - z ^ 2 ≤ 4 && x y z ≤ 1 && x ≥ 0 && y ≥ 0 && z ≥ 0}, {x, y, z}]Reduceを使ってある範囲の円柱表現を得る:
Reduce[x ^ 2 + y ^ 2 < 4 && x ^ 2 + z ^ 2 < 4, {x, y, z}]FindInstanceを使ってある範囲における特定のサンプルを求める:
FindInstance[x ^ 2 + y ^ 2 < 4 && x ^ 2 + z ^ 2 < 4, {x, y, z}]おもしろい例題 (2)
RegionPlot3D[1 ≤ Norm[{x, y, z}, 1] && Norm[{x, y, z}] ≤ 1, {x, -1, 1}, {y, -1, 1}, {z, -1, 1}, Mesh -> None, PlotStyle -> Directive[Opacity[0.5], Pink, Specularity[White, 20]], PlotPoints -> 60, NormalsFunction -> "Average"]RegionPlot3D[y ^ 2 + z ^ 2 ≤ 3 && x ^ 2 + z ^ 2 ≤ 3, {x, -2, 2}, {y, -2, 2}, {z, -2, 2}, Mesh -> None, ColorFunction -> Function[{x, y, z}, Hue@Rescale[x y z, {-2, 2}]], ColorFunctionScaling -> False, PlotPoints -> 50]テキスト
Wolfram Research (2007), RegionPlot3D, Wolfram言語関数, https://reference.wolfram.com/language/ref/RegionPlot3D.html (2022年に更新).
CMS
Wolfram Language. 2007. "RegionPlot3D." Wolfram Language & System Documentation Center. Wolfram Research. Last Modified 2022. https://reference.wolfram.com/language/ref/RegionPlot3D.html.
APA
Wolfram Language. (2007). RegionPlot3D. Wolfram Language & System Documentation Center. Retrieved from https://reference.wolfram.com/language/ref/RegionPlot3D.html