ContourPlot3D[f,{x,xmin,xmax},{y,ymin,ymax},{z,zmin,zmax}]
x, y, z の関数としての f の三次元等高線プロットを作成する.
ContourPlot3D[f==g,{x,xmin,xmax},{y,ymin,ymax},{z,zmin,zmax}]
である曲面の等高線をプロットする.
ContourPlot3D[…,{x,y,z}∈reg]
変数{x,y,z}が,幾何学領域 reg にあると解釈する.
ContourPlot3D
ContourPlot3D[f,{x,xmin,xmax},{y,ymin,ymax},{z,zmin,zmax}]
x, y, z の関数としての f の三次元等高線プロットを作成する.
ContourPlot3D[f==g,{x,xmin,xmax},{y,ymin,ymax},{z,zmin,zmax}]
である曲面の等高線をプロットする.
ContourPlot3D[…,{x,y,z}∈reg]
変数{x,y,z}が,幾何学領域 reg にあると解釈する.
詳細とオプション
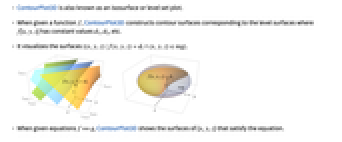
- ContourPlot3Dは,等位面あるいは等位集合プロットとしても知られている.
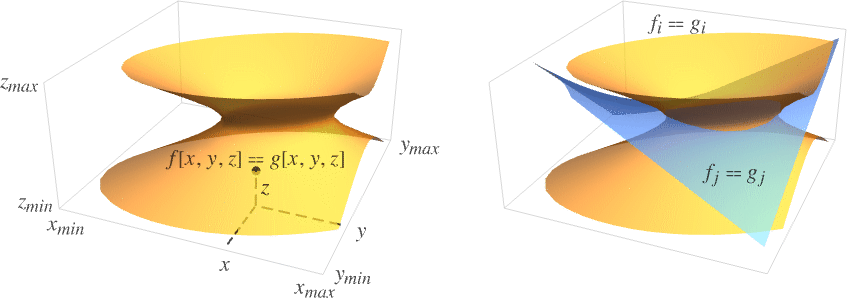
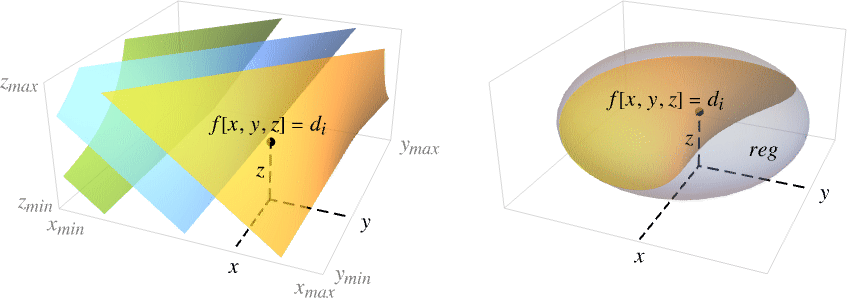
- ContourPlot3Dは,関数 f が与えられると f[x,y,z]が一定の値 d1,d2等を持つレベル曲面に対応する等高線曲面を構築する.
- これは,曲面

を可視化する. - ContourPlot3Dは,方程式 f==g が与えられると方程式を満足する{x,y,z}の曲面を表示する.
- これは,曲面

を可視化する. - ContourPlot3Dは,実質的にBlockを使い変数 x, y, z を局所的なものとして扱う.
- ContourPlot3Dには属性HoldAllがあり,x, y, z に特定の数値を割り当てた後で f と g を評価する.場合によっては,Evaluateを使ってまず f と g を記号的に評価した方がより効率的かもしれない.
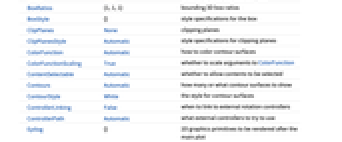
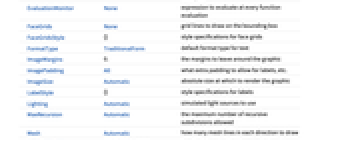
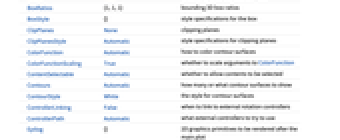
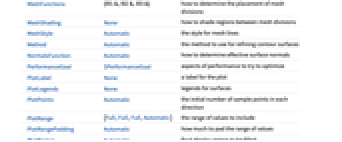
- ContourPlot3DはGraphics3Dのオプションに以下の追加・変更を加えたものを使うことができる. [全オプションのリスト]
- ContourPlot3Dはまず,PlotPointsで指定された等間隔のサンプル点の三次元格子で f を評価する.次に適応的アルゴリズムを用いて,滑らかな等高線を得るために最高MaxRecursion回まで再帰的に部分分割する.
- ContourPlot3Dは有限個のサンプル点しか使わないので,関数の特徴を見付けられない可能性もあるので注意されたい.結果の検証にはPlotPointsとMaxRecursionの設定値を大きくしてみるとよい.
- MeshFunctions,RegionFunctionの関数に渡される引数は x, y, z, f である.ColorFunctionとTextureCoordinateFunctionの関数には,デフォルトで,これらの引数をスケールしたものが与えられる.
- 次は,ScalingFunctionsの可能な設定である.
-
sf f 等高線の値をスケールする {sx,sy,sz} x,y,z の各軸をスケールする {sx,sy,sz,sf} x,y,z の各軸と f 等高線の値をスケールする - 次は,よく使われる組込みのスケーリング関数 s である.
-
"Log" 

自動目盛ラベル付きの対数スケール "Log10" 

10のベキ乗に目盛が付いた,10を底とする対数スケール "SignedLog" 

0と負の数を含む対数に似たスケール "Reverse" 
座標の向きを逆にする "Infinite" 

無限スケール - ContourPlot3DはGraphics3D[GraphicsComplex[data]]を返す.
- 3D曲面に影響するテーマ
-
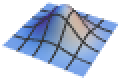
"DarkMesh" 色の濃いメッシュライン 
"GrayMesh" グレーのメッシュライン 
"LightMesh" 色の薄いメッシュライン 
"ZMesh" 垂直に配置されたメッシュライン 
"ThickSurface" 曲面に厚みを与える
全オプションのリスト
例題
すべて開く すべて閉じる例 (4)
ContourPlot3D[x ^ 3 + y ^ 2 - z ^ 2 == 0, {x, -2, 2}, {y, -2, 2}, {z, -2, 2}]ContourPlot3D[x ^ 3 + y ^ 2 - z ^ 2, {x, -2, 2}, {y, -2, 2}, {z, -2, 2}]ContourPlot3D[x ^ 3 + y ^ 2 - z ^ 2, {x, y, z}∈Ball[{0, 0, 0}, 3]]ContourPlot3D[x ^ 4 + y ^ 4 + z ^ 4 - (x ^ 2 + y ^ 2 + z ^ 2) ^ 2 + 3(x ^ 2 + y ^ 2 + z ^ 2) == 3, {x, -2, 2}, {y, -2, 2}, {z, -2, 2}, Mesh -> None, ContourStyle -> Directive[Orange, Opacity[0.8], Specularity[White, 30]]]スコープ (16)
サンプリング (6)
ContourPlot3D[x + y + z, {x, y, z}∈Ball[]]ContourPlot3D[x y z, {x, y, z}∈ImplicitRegion[x + y <= z, {x, y, z}]]関数が急激に変化している部分ではより多くの点がサンプルとして取られる:
ContourPlot3D[Sin[x y] == z, {x, 0, 2}, {y, 0, 2}, {z, -1, 1}, Mesh -> All, MaxRecursion -> 1]ContourPlot3D[Sqrt[x y z], {x, -1, 1}, {y, -1, 1}, {z, -1, 1}]PlotPointsとMaxRecursionを使って適応的サンプリングを制御する:
Grid[Table[ContourPlot3D[Sin[3x]Sin[3y]Sin[3z] == 1 / 2, {x, 0, 3}, {y, 0, 3}, {z, -1, 1}, Mesh -> None, BoxRatios -> Automatic, PlotPoints -> pp, MaxRecursion -> mr], {mr, {0, 1}}, {pp, {5, 10}}]]RegionFunctionを使って内部の特徴を示す:
ContourPlot3D[x ^ 2 + y ^ 2 + z ^ 2, {x, -2, 2}, {y, -2, 2}, {z, -2, 2}, Contours -> 5, RegionFunction -> Function[{x, y, z}, x < 0 || y > 0], ContourStyle -> {Red, Orange, Yellow, Green, Blue}, Mesh -> None]プレゼンテーション (10)
ContourPlot3D[x ^ 2 + y ^ 2 - z ^ 2 == 1, {x, -2, 2}, {y, -2, 2}, {z, -2, 2}, AxesEdge -> {{-1, -1}, {1, -1}, {-1, -1}}, Ticks -> None, Mesh -> 5, AxesLabel -> {x, y, z}, PlotLabel -> x ^ 2 + y ^ 2 - z ^ 2 == 1]ContourPlot3D[16x ^ 3 + 16y ^ 3 - 31z ^ 3 + 24x ^ 2z - 48x ^ 2y - 48x y ^ 2 + 24y ^ 2z - 93.5307z ^ 2 - 72z == 0, {x, -2, 2}, {y, -2, 2}, {z, -2.3, 2}, ColorFunction -> Function[{x, y, z, f}, ColorData["Rainbow"][z]], Mesh -> 4]ContourPlot3D[x ^ 4 + y ^ 4 + z ^ 4 - x ^ 2 - y ^ 2 - z ^ 2 + 0.5 == 0, {x, -1, 1}, {y, -1, 1}, {z, -1, 1}, Mesh -> None, PlotPoints -> 35, ContourStyle -> Directive[Specularity[White, 50], Orange], Lighting -> "Neutral"]ContourPlot3D[{Abs[Sin[x]Sin[y]Sin[z]] == 0.5, Abs[Cos[x]Cos[y]Cos[z]] == 0.5}, {x, 0, 3}, {y, 0, 3}, {z, 0, 3}, ContourStyle -> {Red, Blue}, Mesh -> None]ContourPlot3D[x ^ 2 + y ^ 2 - z ^ 2, {x, -3, 3}, {y, -3, 3}, {z, -3, 3}, Contours -> {-3, 0, 3}, ContourStyle -> {Purple, Green, Cyan}, Mesh -> 5, MeshStyle -> GrayLevel[0.3], RegionFunction -> Function[{x, y, z}, x < 0 || y > 0]]ContourPlot3D[x ^ 2 + y ^ 2 + z ^ 2, {x, -1, 1}, {y, -1, 1}, {z, -1, 1}, ContourStyle -> Opacity[0.5], Mesh -> None, ColorFunction -> (Hue[#4 / 4]&)]ContourPlot3D[x ^ 2 - y ^ 2 == z, {x, -1, 1}, {y, -1, 1}, {z, -1, 1}, MeshFunctions -> {#1 - #2&, #1 + #2&}, MeshStyle -> {Purple, Orange}, Lighting -> "Neutral", ContourStyle -> Gray]ContourPlot3D[x ^ 2 - y ^ 2 == z, {x, -1, 1}, {y, -1, 1}, {z, -1, 1}, MeshFunctions -> {#1 - #2&, #1 + #2&}, MeshShading -> {{Yellow, Blue}, {Green, Cyan}}]ContourPlot3D[Sqrt[x y z], {x, -1, 1}, {y, -1, 1}, {z, -1, 1}, ContourStyle -> {Red, Blue, Green}, PlotLegends -> Automatic]ContourPlot3D[{Abs[Sin[x]Sin[y]Sin[z]] == 0.5, Abs[Cos[x]Cos[y]Cos[z]] == 0.5}, {x, 0, 3}, {y, 0, 3}, {z, 0, 3}, ContourStyle -> {Green, Orange}, Mesh -> None, PlotLegends -> "Expressions"]暗い背景にコントラストのはっきりしたカラースキームのテーマを使う:
ContourPlot3D[x ^ 2 + y ^ 2 + z ^ 2, {x, -1, 1}, {y, -1, 1}, {z, -1, 1}, PlotTheme -> "Marketing"]ContourPlot3D[x ^ 2 + x y - z ^ 2, {x, -10, 10}, {y, -10, 10}, {z, -10, 10}, ScalingFunctions -> {"Reverse", None, None}]オプション (102)
Axes (2)
デフォルトで,ContourPlot3DにはAxesが描かれる:
ContourPlot3D[x^4 + y^4 + z^4 - (x^2 + y^2 + z^2)^2 + 3 (x^2 + y^2 + z^2) == 3, {x, -2, 2}, {y, -2, 2}, {z, -2, 2}]ContourPlot3D[x^4 + y^4 + z^4 - (x^2 + y^2 + z^2)^2 + 3 (x^2 + y^2 + z^2) == 3, {x, -2, 2}, {y, -2, 2}, {z, -2, 2}, Axes -> False]ContourPlot3Dで軸を個別に描く:
{ContourPlot3D[x^4 + y^4 + z^4 - (x^2 + y^2 + z^2)^2 + 3 (x^2 + y^2 + z^2) == 3, {x, -2, 2}, {y, -2, 2}, {z, -2, 2}, Axes -> {True, False, False}], ContourPlot3D[x^4 + y^4 + z^4 - (x^2 + y^2 + z^2)^2 + 3 (x^2 + y^2 + z^2) == 3, {x, -2, 2}, {y, -2, 2}, {z, -2, 2}, Axes -> {False, True, False}], ContourPlot3D[x^4 + y^4 + z^4 - (x^2 + y^2 + z^2)^2 + 3 (x^2 + y^2 + z^2) == 3, {x, -2, 2}, {y, -2, 2}, {z, -2, 2}, Axes -> {False, False, True}]}AxesLabel (4)
ContourPlot3D[x^4 + y^4 + z^4 - (x^2 + y^2 + z^2)^2 + 3 (x^2 + y^2 + z^2) == 3, {x, -2, 2}, {y, -2, 2}, {z, -2, 2}, Axes -> True]ContourPlot3D[x^4 + y^4 + z^4 - (x^2 + y^2 + z^2)^2 + 3 (x^2 + y^2 + z^2) == 3, {x, -2, 2}, {y, -2, 2}, {z, -2, 2}, Axes -> True, AxesLabel -> z]ContourPlot3D[x^4 + y^4 + z^4 - (x^2 + y^2 + z^2)^2 + 3 (x^2 + y^2 + z^2) == 3, {x, -2, 2}, {y, -2, 2}, {z, -2, 2}, Axes -> True, AxesLabel -> {X, Y, Z}]ContourPlot3Dで指定された変数に基づくラベルを使う:
ContourPlot3D[x^4 + y^4 + z^4 - (x^2 + y^2 + z^2)^2 + 3 (x^2 + y^2 + z^2) == 3, {x, -2, 2}, {y, -2, 2}, {z, -2, 2}, Axes -> True, AxesLabel -> Automatic]AxesOrigin (2)
AxesStyle (4)
ContourPlot3D[x^4 + y^4 + z^4 - (x^2 + y^2 + z^2)^2 + 3 (x^2 + y^2 + z^2) == 3, {x, -2, 2}, {y, -2, 2}, {z, -2, 2}, AxesStyle -> StandardRed]ContourPlot3D[x^4 + y^4 + z^4 - (x^2 + y^2 + z^2)^2 + 3 (x^2 + y^2 + z^2) == 3, {x, -2, 2}, {y, -2, 2}, {z, -2, 2}, AxesStyle -> {{Thick, StandardBrown}, {Thick, StandardBlue}, {Thick, StandardGreen}}]ContourPlot3D[x^4 + y^4 + z^4 - (x^2 + y^2 + z^2)^2 + 3 (x^2 + y^2 + z^2) == 3, {x, -2, 2}, {y, -2, 2}, {z, -2, 2}, AxesStyle -> StandardGreen, TicksStyle -> StandardGray]ContourPlot3D[x^4 + y^4 + z^4 - (x^2 + y^2 + z^2)^2 + 3 (x^2 + y^2 + z^2) == 3, {x, -2, 2}, {y, -2, 2}, {z, -2, 2}, AxesStyle -> StandardGreen, LabelStyle -> StandardGray]BoundaryStyle (3)
ContourPlot3D[x ^ 2 + y ^ 2 - z ^ 2, {x, -2, 2}, {y, -2, 2}, {z, -2, 2}, BoundaryStyle -> Red, Mesh -> None]Noneを使って境界線を描かない:
ContourPlot3D[x ^ 2 + y ^ 2 - z ^ 2, {x, -2, 2}, {y, -2, 2}, {z, -2, 2}, BoundaryStyle -> None, Mesh -> None]BoundaryStyleはRegionFunctionで切り取られた穴に適用される:
ContourPlot3D[x ^ 2 + y ^ 2 - z ^ 2, {x, -2, 2}, {y, -2, 2}, {z, -2, 2}, BoundaryStyle -> Red, Mesh -> None, RegionFunction -> Function[{x, y, z, w}, x ^ 2 + y ^ 2 + z ^ 2 ≤ 4]]BoxRatios (1)
Automaticを使って曲面の自然尺を示す:
ContourPlot3D[Sin[x y] == z, {x, -2, 2}, {y, -2, 2}, {z, -1, 1}]ContourPlot3D[Sin[x y] == z, {x, -2, 2}, {y, -2, 2}, {z, -1, 1}, BoxRatios -> Automatic]ColorFunction (5)
Table[ContourPlot3D[x ^ 2 + y ^ 2 + z ^ 2, {x, -2, 2}, {y, -2, 2}, {z, -2, 2}, ColorFunction -> Function[{x, y, z, f}, Evaluate[c]], PlotLabel -> c, Axes -> None], {c, {Hue[x], Hue[y], Hue[z], Hue[f]}}]ContourPlot3D[x ^ 2 + y ^ 2 + z ^ 2, {x, -2, 2}, {y, -2, 2}, {z, -2, 2}, Mesh -> None, Contours -> 4, ColorFunction -> "DarkRainbow"]ColorFunctionはContourStyleより優先順位が高い:
ContourPlot3D[x ^ 2 + y ^ 2 + z ^ 2, {x, -2, 2}, {y, -2, 2}, {z, -2, 2}, Mesh -> None, Contours -> 4, ColorFunction -> "DarkRainbow", ContourStyle -> Directive[Opacity[0.5], Red]]ContourPlot3D[x ^ 2 + y ^ 2 + z ^ 2, {x, -2, 2}, {y, -2, 2}, {z, -2, 2}, ColorFunction -> Function[{x, y, z, f}, If[z < 0, Red, Green]], ColorFunctionScaling -> False]ColorFunctionはMeshShadingより優先順位が低い:
ContourPlot3D[x ^ 2 + y ^ 2 + z ^ 2, {x, -2, 2}, {y, -2, 2}, {z, -2, 2}, ColorFunction -> Function[{x, y, z, f}, Hue[z]], MeshFunctions -> {#3&}, MeshShading -> {Automatic, StandardGray}]ColorFunctionScaling (2)
ContourPlot3D[x ^ 2 + y ^ 2 + z ^ 2, {x, -1, 1}, {y, -1, 1}, {z, -1, 1}, Mesh -> None, Contours -> 4, ColorFunction -> Function[{x, y, z, f}, Hue[f / 5]], ColorFunctionScaling -> False]ContourPlot3D[x ^ 2 + y ^ 2 == z ^ 2, {x, -2, 2}, {y, -2, 2}, {z, -2, 2}, ColorFunction -> Function[{x, y, z, f}, Hue[Sin[x]Sin[y]]], ColorFunctionScaling -> False, Mesh -> None]Contours (4)
ContourPlot3D[x ^ 3 + y ^ 2 - z ^ 2, {x, -2, 2}, {y, -2, 2}, {z, -2, 2}, Contours -> 5, Mesh -> None]ContourPlot3D[x ^ 3 + y ^ 2 - z ^ 2, {x, -2, 2}, {y, -2, 2}, {z, -2, 2}, Contours -> Automatic, Mesh -> None]ContourPlot3D[x ^ 3 + y ^ 2 - z ^ 2, {x, -2, 2}, {y, -2, 2}, {z, -2, 2}, Contours -> {-2, 2}, Mesh -> None]ContourPlot3D[x ^ 3 + y ^ 2 - z ^ 2, {x, -2, 2}, {y, -2, 2}, {z, -2, 2}, Contours -> {{-2, Red}, {2, Blue}}, Mesh -> None]ContourStyle (8)
ContourPlot3D[x ^ 2 + y ^ 2 + z ^ 2, {x, -2, 2}, {y, -2, 2}, {z, -2, 2}, Mesh -> None, ContourStyle -> Opacity[0.5]]ContourPlot3D[x ^ 2 + y ^ 2 + z ^ 2, {x, -2, 2}, {y, -2, 2}, {z, -2, 2}, Mesh -> None, ContourStyle -> {Red, Green, Blue}]FaceFormを使って内側と外側を異なる色にする:
ContourPlot3D[x ^ 2 + y ^ 2 - z ^ 2 == 1, {x, -2, 2}, {y, -2, 2}, {z, -2, 2}, Mesh -> 5, ContourStyle -> {FaceForm[Yellow, Blue]}]ContourPlot3D[x ^ 2 + y ^ 2 + z ^ 2, {x, -2, 2}, {y, -2, 2}, {z, -2, 2}, Contours -> 4, Mesh -> None, ContourStyle -> {Blue, Opacity[0.5]}]ContourPlot3D[Evaluate[Table[x ^ 2 + y ^ 2 + z ^ 2 == i, {i, 1, 9, 1.5}]], {x, 0, 2}, {y, 0, 2}, {z, 0, 2}, Contours -> 6, Mesh -> None, ContourStyle -> Directive[Opacity[0.5], Orange]]ContourPlot3D[{x ^ 2 + y ^ 2 + z ^ 2 == 2, x ^ 2 + y ^ 2 == z ^ 2}, {x, -2, 2}, {y, -2, 2}, {z, -2, 2}, Mesh -> None, ContourStyle -> {Red, Yellow}]ColorFunctionはContourStyleよりも優先順位が高い:
ContourPlot3D[x ^ 2 + y ^ 2 + z ^ 2 == 1, {x, -1, 1}, {y, -1, 1}, {z, -1, 1}, Mesh -> None, ContourStyle -> Directive[Opacity[0.5], Red], ColorFunction -> Function[{x, y, z, f}, Hue[z]]]MeshShadingはContourStyleよりも優先順位が高い:
ContourPlot3D[x ^ 2 + y ^ 2 + z ^ 2 == 1, {x, -1, 1}, {y, -1, 1}, {z, -1, 1}, MeshFunctions -> {#3&}, ContourStyle -> Directive[Opacity[0.5], Yellow], MeshShading -> {Red, Automatic}]EvaluationMonitor (2)
ContourPlot3Dが関数のサンプルを取っている点を示す:
ListPointPlot3D[Reap[ContourPlot3D[Sin[x y] == z, {x, -2, 2}, {y, -2, 2}, {z, -2, 2}, EvaluationMonitor :> Sow[{x, y, z}], PlotPoints -> 5]][[-1, 1]], BoxRatios -> Automatic, PlotStyle -> PointSize[Tiny]]Block[{k = 0}, ContourPlot3D[Sin[x y] == z, {x, -2, 2}, {y, -2, 2}, {z, -2, 2}, EvaluationMonitor :> k++];k]ImageSize (7)
Tiny,Small,Medium,Large等の名前付きのサイズを使う:
{ContourPlot3D[x^4 + y^4 + z^4 - (x^2 + y^2 + z^2)^2 + 3 (x^2 + y^2 + z^2) == 3, {x, -2, 2}, {y, -2, 2}, {z, -2, 2}, ImageSize -> Tiny], ContourPlot3D[x^4 + y^4 + z^4 - (x^2 + y^2 + z^2)^2 + 3 (x^2 + y^2 + z^2) == 3, {x, -2, 2}, {y, -2, 2}, {z, -2, 2}, ImageSize -> Small]}{ContourPlot3D[x^4 + y^4 + z^4 - (x^2 + y^2 + z^2)^2 + 3 (x^2 + y^2 + z^2) == 3, {x, -2, 2}, {y, -2, 2}, {z, -2, 2}, ImageSize -> 150], ContourPlot3D[x^4 + y^4 + z^4 - (x^2 + y^2 + z^2)^2 + 3 (x^2 + y^2 + z^2) == 3, {x, -2, 2}, {y, -2, 2}, {z, -2, 2}, AspectRatio -> 1.5, ImageSize -> 150]}{ContourPlot3D[x^4 + y^4 + z^4 - (x^2 + y^2 + z^2)^2 + 3 (x^2 + y^2 + z^2) == 3, {x, -2, 2}, {y, -2, 2}, {z, -2, 2}, ImageSize -> {Automatic, 150}], ContourPlot3D[x^4 + y^4 + z^4 - (x^2 + y^2 + z^2)^2 + 3 (x^2 + y^2 + z^2) == 3, {x, -2, 2}, {y, -2, 2}, {z, -2, 2}, AspectRatio -> .75, ImageSize -> {Automatic, 150}]}{ContourPlot3D[x^4 + y^4 + z^4 - (x^2 + y^2 + z^2)^2 + 3 (x^2 + y^2 + z^2) == 3, {x, -2, 2}, {y, -2, 2}, {z, -2, 2}, ImageSize -> UpTo[200]], ContourPlot3D[x^4 + y^4 + z^4 - (x^2 + y^2 + z^2)^2 + 3 (x^2 + y^2 + z^2) == 3, {x, -2, 2}, {y, -2, 2}, {z, -2, 2}, AspectRatio -> .75, ImageSize -> UpTo[200]]}グラフィックスの幅と高さを指定して,必要な場合はスペースを充填する:
ContourPlot3D[x^4 + y^4 + z^4 - (x^2 + y^2 + z^2)^2 + 3 (x^2 + y^2 + z^2) == 3, {x, -2, 2}, {y, -2, 2}, {z, -2, 2}, ImageSize -> {200, 200}, Background -> StandardBlue]AspectRatioFullと設定すると使用可能なスペースが埋められる:
ContourPlot3D[x^4 + y^4 + z^4 - (x^2 + y^2 + z^2)^2 + 3 (x^2 + y^2 + z^2) == 3, {x, -2, 2}, {y, -2, 2}, {z, -2, 2}, AspectRatio -> Full, ImageSize -> {200, 200}, Background -> StandardBlue]{ContourPlot3D[x^4 + y^4 + z^4 - (x^2 + y^2 + z^2)^2 + 3 (x^2 + y^2 + z^2) == 3, {x, -2, 2}, {y, -2, 2}, {z, -2, 2}, ImageSize -> {UpTo[150], UpTo[100]}], ContourPlot3D[x^4 + y^4 + z^4 - (x^2 + y^2 + z^2)^2 + 3 (x^2 + y^2 + z^2) == 3, {x, -2, 2}, {y, -2, 2}, {z, -2, 2}, AspectRatio -> 2, ImageSize -> {UpTo[150], UpTo[100]}]}ImageSizeFullを使ってオブジェクトの使用可能なスペースを充填する:
Framed[Pane[ContourPlot3D[x^4 + y^4 + z^4 - (x^2 + y^2 + z^2)^2 + 3 (x^2 + y^2 + z^2) == 3, {x, -2, 2}, {y, -2, 2}, {z, -2, 2}, ImageSize -> Full, Background -> StandardBlue], {200, 100}]]Framed[Pane[ContourPlot3D[x^4 + y^4 + z^4 - (x^2 + y^2 + z^2)^2 + 3 (x^2 + y^2 + z^2) == 3, {x, -2, 2}, {y, -2, 2}, {z, -2, 2}, AspectRatio -> Full, ImageSize -> {Scaled[0.5], Scaled[0.5]}, Background -> StandardBlue], {200, 200}]]MaxRecursion (1)
Mesh (6)
{ContourPlot3D[Sin[x y] == z, {x, -2, 2}, {y, -2, 2}, {z, -1, 1}, Mesh -> Full, MaxRecursion -> 1], ContourPlot3D[Sin[x y] == z, {x, -2, 2}, {y, -2, 2}, {z, -1, 1}, Mesh -> All, MaxRecursion -> 1]}Noneを使ってメッシュを描かないようにする:
ContourPlot3D[x ^ 2 + y ^ 2 - z ^ 2, {x, -2, 2}, {y, -2, 2}, {z, -2, 2}, Mesh -> None]ContourPlot3D[x ^ 2 + y ^ 2 - z ^ 2, {x, -2, 2}, {y, -2, 2}, {z, -2, 2}, Mesh -> 5, MeshFunctions -> {#1&, #2&, #3&}]ContourPlot3D[x ^ 2 + y ^ 2 - z ^ 2 == 0, {x, -2, 2}, {y, -2, 2}, {z, -2, 2}, Mesh -> 5, MeshFunctions -> {#1&, #2&, #3&}]
方向に5本のメッシュレベルを,
方向に10本のメッシュレベルを使う:
ContourPlot3D[x ^ 2 + y ^ 2 - z ^ 2, {x, -2, 2}, {y, -2, 2}, {z, -2, 2}, Mesh -> {5, 10}, MeshFunctions -> {#1&, #2&}]ContourPlot3D[x ^ 2 + y ^ 2 - z ^ 2 == 0, {x, -2, 2}, {y, -2, 2}, {z, -2, 2}, Mesh -> {5, 10}, MeshFunctions -> {#1&, #2&}]ContourPlot3D[x ^ 2 + y ^ 2 - z ^ 2 == 0, {x, -2, 2}, {y, -2, 2}, {z, -2, 2}, Mesh -> {{0}, {0}}, MeshFunctions -> {#1&, #2&}]ContourPlot3D[x ^ 2 + y ^ 2 - z ^ 2 == 0, {x, -2, 2}, {y, -2, 2}, {z, -2, 2}, Mesh -> {{{0, Thick}}, {{0, Red}}}]MeshFunctions (2)
Table[ContourPlot3D[x ^ 2 + y ^ 2 + z ^ 2 == 1, {x, -1, 1}, {y, -1, 1}, {z, -1, 1}, PlotLabel -> f, MeshFunctions -> {Function[{x, y, z}, f]}, Axes -> None], {f, {x, y, z}}]ContourPlot3D[x ^ 3 + y ^ 2 - z ^ 2, {x, -2, 2}, {y, -2, 2}, {z, -2, 2}, MeshFunctions -> (Norm[{#1, #2, #3}]&)]MeshShading (5)
ContourPlot3D[x ^ 2 + y ^ 2 - z ^ 2 == 1, {x, -2, 2}, {y, -2, 2}, {z, -2, 2}, MeshFunctions -> {#3&}, MeshShading -> {Red, Blue}]MeshShadingはスタイリングに関してContourStyleより優先順位が高い:
ContourPlot3D[x ^ 2 + y ^ 2 - z ^ 2 == 1, {x, -2, 2}, {y, -2, 2}, {z, -2, 2}, MeshFunctions -> {#3&}, MeshShading -> {None, Blue}]MeshShadingをAutomaticに設定し,ContourStyleをある部分に使う:
ContourPlot3D[x ^ 2 + y ^ 2 - z ^ 2 == 1, {x, -2, 2}, {y, -2, 2}, {z, -2, 2}, MeshFunctions -> {#3&}, MeshShading -> {Red, Automatic}, ContourStyle -> Directive[Opacity[0.5], Yellow]]MeshShadingはColorFunctionとともに使うことができる:
ContourPlot3D[x ^ 2 + y ^ 2 - z ^ 2 == 1, {x, -2, 2}, {y, -2, 2}, {z, -2, 2}, MeshFunctions -> {#3&}, MeshShading -> {StandardGray, Automatic}, ColorFunction -> Function[{x, y, z, f}, Hue[z]]]ContourPlot3D[x ^ 2 + y ^ 2 - z ^ 2 == 1, {x, -2, 2}, {y, -2, 2}, {z, -2, 2}, MeshShading -> Table[RGBColor[r, g, b], {r, 0, 1, 1 / 5}, {g, 0, 1, 1 / 5}, {b, 0, 1, 1 / 5}], Mesh -> 5, Lighting -> "Neutral"]MeshStyle (2)
ContourPlot3D[x ^ 2 + y ^ 2 - z ^ 2 == 1, {x, -2, 2}, {y, -2, 2}, {z, -2, 2}, MeshFunctions -> {#1&}, MeshStyle -> Dashed, Mesh -> 5]ContourPlot3D[x ^ 2 + y ^ 2 - z ^ 2 == 1, {x, -2, 2}, {y, -2, 2}, {z, -2, 2}, Mesh -> 5, MeshFunctions -> {#1&, #2&}, MeshStyle -> {Dashed, Blue}]NormalsFunction (3)
ContourPlot3D[x ^ 2 + y ^ 2 - z ^ 2 == 1, {x, -2, 2}, {y, -2, 2}, {z, -2, 2}, Mesh -> None]Noneを使ってすべての多角形に平坦な陰影付けを行う:
ContourPlot3D[x ^ 2 + y ^ 2 - z ^ 2 == 1, {x, -2, 2}, {y, -2, 2}, {z, -2, 2}, NormalsFunction -> None, Mesh -> None]ContourPlot3D[x ^ 2 + y ^ 2 - z ^ 2 == 1, {x, -2, 2}, {y, -2, 2}, {z, -2, 2}, Mesh -> None, NormalsFunction -> Function[{x, y, z, u, v}, RandomReal[{-1, 1}, {3}]]]PerformanceGoal (2)
Timing[ContourPlot3D[Sin[x ^ 2 + y ^ 2] == z, {x, -2, 2}, {y, -2, 2}, {z, -2, 2}, PerformanceGoal -> "Quality"]]Timing[ContourPlot3D[Sin[x ^ 2 + y ^ 2] == z, {x, -2, 2}, {y, -2, 2}, {z, -2, 2}, PerformanceGoal -> "Speed"]]PlotLegends (3)
ContourPlot3D[{x ^ 2 + y ^ 2 - z ^ 2 == 1, x ^ 2 + y ^ 2 + z ^ 2 == 2}, {x, -2, 2}, {y, -2, 2}, {z, -2, 2}, ContourStyle -> {Yellow, Red}, PlotLegends -> "Expressions"]Placedを使った凡例の置き方を変える:
ContourPlot3D[{x ^ 2 + y ^ 2 - z ^ 2 == 1, x ^ 2 + y ^ 2 + z ^ 2 == 2}, {x, -2, 2}, {y, -2, 2}, {z, -2, 2}, ContourStyle -> {Yellow, Red}, PlotLegends -> Placed["Expressions", Below]]SwatchLegendを使って凡例を変更する:
ContourPlot3D[{x ^ 2 + y ^ 2 - z ^ 2 == 1, x ^ 2 + y ^ 2 + z ^ 2 == 2}, {x, -2, 2}, {y, -2, 2}, {z, -2, 2}, ContourStyle -> {Yellow, Red}, PlotLegends -> SwatchLegend["Expressions", LegendFunction -> "Frame"]]PlotPoints (1)
PlotRange (2)
,
,
範囲全体(Full)で等高線を示す:
ContourPlot3D[x ^ 2 + y ^ 2 + z ^ 2 == 2, {x, -2, 2}, {y, -2, 2}, {z, -2, 2}]ContourPlot3D[x ^ 2 + y ^ 2 + z ^ 2 == 2, {x, -2, 2}, {y, -2, 2}, {z, -2, 2}, PlotRange -> Automatic]PlotTheme (4)
ContourPlot3D[x ^ 2 + y ^ 2 - z ^ 2, {x, -2, 2}, {y, -2, 2}, {z, -2, 2}, PlotTheme -> "Detailed"]ContourPlot3D[x ^ 2 + y ^ 2 - z ^ 2, {x, -2, 2}, {y, -2, 2}, {z, -2, 2}, PlotTheme -> "Detailed", FaceGrids -> None]ContourPlot3D[x ^ 2 + y ^ 2 + z ^ 2, {x, -1, 1}, {y, -1, 1}, {z, -1, 1}, PlotTheme -> "Minimal"]ContourPlot3D[x ^ 4 + y ^ 4 + z ^ 4 - (x ^ 2 + y ^ 2 + z ^ 2) ^ 2 + 3(x ^ 2 + y ^ 2 + z ^ 2) == 3, {x, -2, 2}, {y, -2, 2}, {z, -2, 2}, PlotTheme -> "ThickSurface"]RegionFunction (2)
Table[ContourPlot3D[x ^ 2 + y ^ 2 + z ^ 2, {x, -1, 1}, {y, -1, 1}, {z, -1, 1}, Mesh -> None, Axes -> None, Contours -> 4, RegionFunction -> Function[{x, y, z}, Evaluate[f]], PlotLabel -> f], {f, {-1 / 2 < x < 1 / 2, -1 / 2 < y < 1 / 2, -1 / 2 < z < 1 / 2}}]ContourPlot3D[x ^ 2 + y ^ 2 + z ^ 2, {x, -1, 1}, {y, -1, 1}, {z, -1, 1}, Contours -> 4, Mesh -> None, Axes -> None, RegionBoundaryStyle -> None, RegionFunction -> Function[{x, y, z}, x < 0 || y > 0]]RegionBoundaryStyle (4)
ContourPlot3D[x ^ 3 + y ^ 2 - z ^ 2 == 0, {x, y, z}∈Ball[]]ContourPlot3D[x ^ 3 + y ^ 2 - z ^ 2 == 0, {x, -1, 1}, {y, -1, 1}, {z, -1, 1}, RegionFunction -> Function[{x, y, z, f}, x + y > 0]]Noneを使って領域は描かないようにする:
ContourPlot3D[x ^ 3 + y ^ 2 - z ^ 2 == 0, {x, y, z}∈Ball[], RegionBoundaryStyle -> None]カスタムのRegionBoundaryStyleを使う:
ContourPlot3D[x ^ 3 + y ^ 2 - z ^ 2 == 0, {x, y, z}∈Ball[], RegionBoundaryStyle -> Directive[Yellow, Opacity[.8]]]ScalingFunctions (4)
デフォルトで,ContourPlot3Dはすべての方向に線形スケールを使う:
ContourPlot3D[x ^ 2 + y ^ 2 == 1 / z, {x, -2, 2}, {y, -2, 2}, {z, 0, 20}]ContourPlot3D[x ^ 2 + y ^ 2 == 1 / z, {x, -2, 2}, {y, -2, 2}, {z, 0, 20}, ScalingFunctions -> {None, None, "Log"}, PlotRange -> All]ContourPlot3D[x ^ 2 + y ^ 2 == 1 / z, {x, -2, 2}, {y, -2, 2}, {z, 0, 20}, ScalingFunctions -> {None, None, "Reverse"}]関数とその逆関数を指定して関数によって定義されたスケールを使う:
ContourPlot3D[x ^ 2 + y ^ 2 == 1 / z, {x, -2, 2}, {y, -2, 2}, {z, 0, 10}, ScalingFunctions -> {None, None, {-Log[#]&, Exp[-#]&}}]TextureCoordinateFunction (5)
ContourPlot3D[x ^ 2 + y ^ 2 - z ^ 2 == 1, {x, -2, 2}, {y, -2, 2}, {z, -2, 2}, Mesh -> None, Lighting -> "Neutral", ContourStyle -> Texture[ExampleData[{"ColorTexture", "WavesPattern"}]]]ContourPlot3D[x ^ 2 + y ^ 2 - z ^ 2 == 1, {x, -2, 2}, {y, -2, 2}, {z, -2, 2}, Mesh -> None, Lighting -> "Neutral", TextureCoordinateFunction -> ({#1, #3}&), ContourStyle -> Texture[ExampleData[{"ColorTexture", "WavesPattern"}]]]ContourPlot3D[x ^ 2 + y ^ 2 - z ^ 2, {x, -2, 2}, {y, -2, 2}, {z, -2, 2}, Mesh -> None, Lighting -> "Neutral", ContourStyle -> {Texture[ExampleData[{"ColorTexture", "Ash"}]], Texture[ExampleData[{"ColorTexture", "Amboyna"}]], Texture[ExampleData[{"ColorTexture", "Laurel"}]]}]ContourPlot3D[x ^ 2 + y ^ 2 - z ^ 2 == 1, {x, -2, 2}, {y, -2, 2}, {z, -2, 2}, Mesh -> None, Lighting -> "Neutral", TextureCoordinateScaling -> False, ContourStyle -> Texture[ExampleData[{"ColorTexture", "WavesPattern"}]]]テクスチャを使ってパラメータがどのように曲面にマップされるかをハイライトする:
texture = ArrayPlot[{{1, 1, 1, 2, 1, 1}, {2, 0, 0, 2, 0, 0}, {2, 0, 0, 2, 0, 0}, {2, 1, 1, 1, 1, 1}, {2, 0, 0, 2, 0, 0}, {2, 0, 0, 2, 0, 0}}, ColorRules -> {1 -> Red, 2 -> Blue, 0 -> White}, Frame -> False, PlotRangePadding -> None, ImagePadding -> None, ImageSize -> 100]ContourPlot3D[x ^ 2 + y ^ 2 - z ^ 2 == 1, {x, -2, 2}, {y, -2, 2}, {z, -2, 2}, Mesh -> None, Lighting -> "Neutral", ContourStyle -> Texture[texture]]TextureCoordinateScaling (1)
テクスチャにスケールされたあるいはスケールされていない座標を使う:
texture = ArrayPlot[{{1, 1, 1, 2, 1, 1}, {2, 0, 0, 2, 0, 0}, {2, 0, 0, 2, 0, 0}, {2, 1, 1, 1, 1, 1}, {2, 0, 0, 2, 0, 0}, {2, 0, 0, 2, 0, 0}}, ColorRules -> {1 -> Red, 2 -> Blue, 0 -> White}, Frame -> False, PlotRangePadding -> None, ImagePadding -> None, ImageSize -> 100]Table[ContourPlot3D[x ^ 2 + y ^ 2 - z ^ 2 == 1, {x, -2, 2}, {y, -2, 2}, {z, -2, 2}, Mesh -> None, Lighting -> "Neutral", ContourStyle -> Texture[texture], TextureCoordinateScaling -> s, PlotLabel -> s], {s, {True, False}}]Ticks (6)
ContourPlot3D[x ^ 2 + y ^ 2 - z ^ 4 == 0, {x, -2, 2}, {y, -2, 2}, {z, -2, 2}]TicksNoneを使って目盛も目盛ラベルも描かないようにする:
ContourPlot3D[x ^ 2 + y ^ 2 - z ^ 4 == 0, {x, -2, 2}, {y, -2, 2}, {z, -2, 2}, Ticks -> None]ContourPlot3D[x ^ 2 + y ^ 2 - z ^ 4 == 0, {x, -2, 2}, {y, -2, 2}, {z, -2, 2}, Ticks -> {{-2, .5, 2}, {-2, 0, 2}, {-2, 1, 2}}]ContourPlot3D[x ^ 2 + y ^ 2 - z ^ 4 == 0, {x, -2, 2}, {y, -2, 2}, {z, -2, 2}, Ticks -> {{{-2, -a}, {.5, b}, {2, a}}, {{-2, -a}, {0, c}, {2, a}}, {{-2, -a}, {1, d}, {2, a}}}]ContourPlot3D[x ^ 2 + y ^ 2 - z ^ 4 == 0, {x, -2, 2}, {y, -2, 2}, {z, -2, 2}, Ticks -> {{{-2, -a, .1}, {.5, b, .1}, {2, a, .1}}, {{-2, -a, .08}, {0, c, .08}, {2, a, .08}}, {{-2, -a, .05}, {1, d, .05}, {2, a, .05}}}]ContourPlot3D[x ^ 2 + y ^ 2 - z ^ 4 == 0, {x, -2, 2}, {y, -2, 2}, {z, -2, 2}, Ticks -> {{{-2, -a, .05, Directive[Thick, Red]}, {.5, b, .05, Directive[Thick, Red]}, {2, a, .01, Directive[Thick, Red]}}, {{-2, -a, .05, Directive[Blue]}, {0, c, .05, Directive[Blue]}, {2, a, .05, Directive[Blue]}}, {{-2, -a, .1, Directive[Thick, Green]}, {1, d, .1, Directive[Thick, Green]}, {2, a, .1, Directive[Thick, Darker@Green]}}}]TicksStyle (3)
デフォルトで,目盛と目盛ラベルには軸と同じスタイルが使われる:
ContourPlot3D[x ^ 2 + y ^ 2 - z ^ 4 == 0, {x, -2, 2}, {y, -2, 2}, {z, -2, 2}, AxesStyle -> Directive[StandardRed, Thick]]ContourPlot3D[x ^ 2 + y ^ 2 - z ^ 4 == 0, {x, -2, 2}, {y, -2, 2}, {z, -2, 2}, TicksStyle -> Directive[StandardRed, Thick]]ContourPlot3D[x ^ 2 + y ^ 2 - z ^ 4 == 0, {x, -2, 2}, {y, -2, 2}, {z, -2, 2}, TicksStyle -> {Directive[StandardRed, Thick], Directive[StandardBlue], Directive[StandardGray, Thick]}]アプリケーション (5)
楕円体の表面 [詳細]:
Table[ContourPlot3D[Evaluate[e], {x, -2, 2}, {y, -2, 2}, {z, -2, 2}, Mesh -> None, AxesLabel -> Automatic, Ticks -> None, PlotLabel -> e], {e, {(x / 2) ^ 2 + y ^ 2 + z ^ 2 == 1, x ^ 2 + (y / 2) ^ 2 + z ^ 2 == 1, x ^ 2 + y ^ 2 + (z / 2) ^ 2 == 1}}]Integrate[Boole[(x / 2) ^ 2 + y ^ 2 + z ^ 2 ≤ 1], {x, -2, 2}, {y, -2, 2}, {z, -2, 2}]NIntegrate[Boole[(x / 2) ^ 2 + y ^ 2 + z ^ 2 ≤ 1], {x, -2, 2}, {y, -2, 2}, {z, -2, 2}]円錐面 [詳細]:
Table[ContourPlot3D[Evaluate[e], {x, -2, 2}, {y, -2, 2}, {z, -2, 2}, Mesh -> None, AxesLabel -> Automatic, Ticks -> None, PlotLabel -> e], {e, {-x ^ 2 + y ^ 2 + z ^ 2 == 0, x ^ 2 - y ^ 2 + z ^ 2 == 0, x ^ 2 + y ^ 2 - z ^ 2 == 0}}]ContourPlot3D[{x ^ 2 + y ^ 2 - z ^ 2 == 1, x ^ 2 + y ^ 2 + z ^ 2 == 1, x ^ 2 + y ^ 2 - z ^ 2 == -1}, {x, -2, 2}, {y, -2, 2}, {z, -2, 2}, BoxRatios -> Automatic, RegionFunction -> Function[{x, y, z}, x < 0 || y > 0], ContourStyle -> {Yellow, Magenta, Cyan}, Mesh -> 3]Meshを使って双曲放物面が二重に罫線を引いた曲面であることを示す:
ContourPlot3D[x ^ 2 - y ^ 2 == z, {x, -1, 1}, {y, -1, 1}, {z, -1, 1}, MeshFunctions -> {#1 - #2&, #1 + #2&}, MeshStyle -> {Purple, Orange}, Lighting -> "Neutral", ContourStyle -> Gray]陰的に定義されたトーラス [詳細]:
torus[{R_, r_}, {x_, y_, z_}] := (x^2 + y^2 + z^2 + R^2 - r^2)^2 == 4R^2(x^2 + z^2);torus[{2, 1}, {x, y, z}]ContourPlot3D[ Evaluate[torus[{3, 1}, {x, y, z}]], {x, -5, 5}, {y, -5, 5}, {z, -5, 5}, Mesh -> None, ContourStyle -> Directive[Orange, Specularity[White, 20]], PlotPoints -> 25, PlotRange -> Automatic, BoxRatios -> Automatic]ElectroStaticPotential[q_, p_, r_] := Sum[ (q[[i]]/Norm[r - p[[i]]]), {i, Length[q]}]ElectroStaticPotential[{Subscript[q, 1], Subscript[q, 2]}, {{Subscript[x, 1], Subscript[y, 1], Subscript[z, 1]}, {Subscript[x, 2], Subscript[y, 2], Subscript[z, 2]}}, {x, y, z}]//TraditionalFormContourPlot3D[Evaluate[ElectroStaticPotential[{1, -1}, {{-1, 0, 0}, {1, 0, 0}}, {x, y, z}]], {x, -6, 6}, {y, 0, 4}, {z, -4, 4}, Contours -> {-0.75, -0.25, -0.1, 0, 0.1, 0.25, 0.75}, ContourStyle -> Table[Hue[i / 7], {i, 0, 6}], Mesh -> None]ContourPlot3D[Evaluate[ElectroStaticPotential[{1, 1}, {{-1, 0, 0}, {1, 0, 0}}, {x, y, z}]], {x, -3, 3}, {y, 0, 2}, {z, -2, 2}, Contours -> {1, 1.5, 2}, ContourStyle -> Table[Hue[i / 3], {i, 0, 2}], Mesh -> None]ContourPlot3D[Evaluate[ElectroStaticPotential[{2, -1, -1}, {{0, 0, 0}, {1, 0, -1}, {-1, 0, -1}}, {x, y, z}]], {x, -4, 4}, {y, 0, 4}, {z, -6, 6}, Contours -> {-0.75, -0.25, -0.1, 0, 0.1, 0.25, 0.75}, ContourStyle -> Table[Hue[i / 7], {i, 0, 6}], Mesh -> None ]特性と関係 (8)
ContourPlot3Dは,必要なところではより多くの点をサンプルとして取る:
ContourPlot3D[Sin[x y] == z, {x, -2, 2}, {y, -2, 2}, {z, -2, 2}, Mesh -> All, MaxRecursion -> 1]陰的曲面のプロットは関連関数のゼロ等高線を求めるのと同じである:
{ContourPlot3D[x ^ 2 + y ^ 2 - z ^ 4, {x, -2, 2}, {y, -2, 2}, {z, -2, 2}, Contours -> {0}], ContourPlot3D[x ^ 2 + y ^ 2 - z ^ 4 == 0, {x, -2, 2}, {y, -2, 2}, {z, -2, 2}]}ContourPlot3D[x ^ 2 + y ^ 2 == z ^ 4, {x, -1, 1}, {y, -1, 1}, {z, -1, 1}, Mesh -> None, ContourStyle -> FaceForm[Red, Yellow]]ContourPlot3D[z ^ 4 == x ^ 2 + y ^ 2, {x, -1, 1}, {y, -1, 1}, {z, -1, 1}, Mesh -> None, ContourStyle -> FaceForm[Red, Yellow]]ListContourPlot3Dをデータのプロットに使う:
data = Flatten[Table[{x, y, z, Sin[x y] - z}, {x, -2, 2, 0.2}, {y, -2, 2, 0.2}, {z, -2, 2, 0.2}], 2];ListContourPlot3D[data]RegionPlot3Dを三次元の陰的範囲に使う:
RegionPlot3D[Sin[x y] ≥ z, {x, -2, 2}, {y, -2, 2}, {z, -2, 2}]Plot3Dを曲面に使う:
Plot3D[Sin[x y], {x, -2, 2}, {y, -2, 2}]ParametricPlot3Dを三次元のパラメトリック曲線と範囲に使う:
{ParametricPlot3D[{Cos[u], Sin[u], u / (6Pi)}, {u, 0, 6Pi}], ParametricPlot3D[{u + v, u - v, u ^ 2 - v ^ 2}, {u, -2, 2}, {v, -2, 2}]}ContourPlotとDensityPlotを二次元の等高線と密度に使う:
{ContourPlot[Sin[x y], {x, -2, 2}, {y, -2, 2}],
DensityPlot[Sin[x y], {x, -2, 2}, {y, -2, 2}]}考えられる問題 (3)
PlotPointsまたはMaxRecursionの設定値を上げて曲面の特徴を捉える:
ContourPlot3D[z ^ 2 + x z == x ^ 2z, {x, -0.5, 1.5}, {y, -1, 1}, {z, -1, 1}, Mesh -> None]ContourPlot3D[z ^ 2 + x z == x ^ 2z, {x, -0.5, 1.5}, {y, -1, 1}, {z, -1, 1}, Mesh -> None, MaxRecursion -> 4]より多くの初期点を使って等高面のより多くの構成要素を捉える:
ContourPlot3D[Sin[3x]Sin[3y]Sin[3z] == 1 / 2, {x, 0, 3}, {y, 0, 3}, {z, -1, 1}, Mesh -> None, BoxRatios -> Automatic, PlotPoints -> 5]ContourPlot3D[Sin[3x]Sin[3y]Sin[3z] == 1 / 2, {x, 0, 3}, {y, 0, 3}, {z, -1, 1}, Mesh -> None, BoxRatios -> Automatic, PlotPoints -> 10]常に負である関数の場合,ゼロ等高線を見付けるのは不可能である:
ContourPlot3D[(x ^ 2 + y ^ 2 + z ^ 2 - 1) ^ 2 == 0, {x, -1, 1}, {y, -1, 1}, {z, -1, 1}]履歴
2007 で導入 (6.0) | 2010 で更新 (8.0) ▪ 2012 (9.0) ▪ 2014 (10.0) ▪ 2016 (11.0) ▪ 2020 (12.1) ▪ 2022 (13.1)
テキスト
Wolfram Research (2007), ContourPlot3D, Wolfram言語関数, https://reference.wolfram.com/language/ref/ContourPlot3D.html (2022年に更新).
CMS
Wolfram Language. 2007. "ContourPlot3D." Wolfram Language & System Documentation Center. Wolfram Research. Last Modified 2022. https://reference.wolfram.com/language/ref/ContourPlot3D.html.
APA
Wolfram Language. (2007). ContourPlot3D. Wolfram Language & System Documentation Center. Retrieved from https://reference.wolfram.com/language/ref/ContourPlot3D.html
BibTeX
@misc{reference.wolfram_2026_contourplot3d, author="Wolfram Research", title="{ContourPlot3D}", year="2022", howpublished="\url{https://reference.wolfram.com/language/ref/ContourPlot3D.html}", note=[Accessed: 13-September-2026]}
BibLaTeX
@online{reference.wolfram_2026_contourplot3d, organization={Wolfram Research}, title={ContourPlot3D}, year={2022}, url={https://reference.wolfram.com/language/ref/ContourPlot3D.html}, note=[Accessed: 13-September-2026]}