



Graph
詳細とオプション
- Graph[…]はノートブックにグラフのプロットとして表示する.
- Graph[…]は常にGraph[vertices,edges,…]という構造を持つ最適化された標準形に変換される.
- Graphは,AtomQのような関数によって,またパターンマッチングの目的では,生のオブジェクトとして扱われる.
- u と v の間の無向辺は uv,u<->v,UndirectedEdge[u,v]あるいはTwoWayRule[u,v]で表すことができる.記号は
 ue
 で入力できる.
- u と v の間の有向辺は uv,u->v,DirectedEdge[{u,v}],Rule[u,v]のいずれかで表すことができる.記号は
 de
 で入力できる.
- u から v までのタグ付きの辺は,u
 v,u
 v,UndirectedEdge[u,v,t]あるいはDirectedEdge[u,v,t]として与えることができる.
- 無向グラフは無向辺の集合体で指定される.
- 有向グラフは有向辺の集合体で指定される.
- 混合グラフは有向辺と無向辺の集合を使って指定される.
- 頂点と辺に次の特殊ラッパーを使うことができる.
-
Annotation[a,label] 注釈を与える Button[a,action] 要素がクリックされたときに実行するアクションを定義する EventHandler[a,…] 要素の一般的なイベントハンドラを定義する Hyperlink[a,uri] 要素がハイパーリンクとして機能するようにする Labeled[a,…] 要素にラベルを付けて表示する PopupWindow[a,cont] 要素にポップアップウィンドウを加える StatusArea[a,label] 要素の上にマウスが来たときにステータスエリアに表示する Style[a,opts] 要素を指定したスタイルで示す Tooltip[a,label] 要素に任意のツールチップを加える - ラベルの可能な置き方はVertexLabelsとEdgeLabelsでそれぞれ与えられる.
- Annotationを使って注釈を頂点および辺に関連付けることができる.
-
Annotation[v,name->value] 注釈 name->value を頂点 v と関連付ける Annotation[e,name->value] 注釈 name->value を辺 e と関連付ける - data は以下のいずれでもよい.
-
タイプ"Graph"のEntity 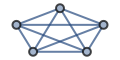
任意のGraphオブジェクト 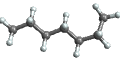
Moleculeオブジェクト 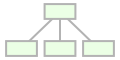
Tree式 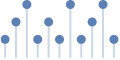
DiscreteMarkovProcessオブジェクト - 頂点には次の標準的な特性がサポートされている.
-
VertexLabels 頂点のラベルおよびラベルの置き方 VertexCoordinates 頂点の中心座標 VertexShape 頂点のグラフィックスの形 VertexSize 頂点の大きさ VertexStyle 頂点のスタイル VertexShapeFunction 頂点の形状描画関数 VertexWeight 頂点の重み - 辺には次の標準的な特性がサポートされている.
-
EdgeLabels 辺のラベルおよびラベルの置き方 EdgeStyle 辺のスタイル EdgeShapeFunction 辺の形状描画関数 EdgeWeight 辺の重み - GraphにはGraphicsと同じオプションに以下の追加・変更を加えたものが使える. [全オプションのリスト]
-
AnnotationRules {} グラフ,辺,頂点の注釈 DirectedEdges Automatic RuleをDirectedEdgeとして解釈するかどうか EdgeLabels None 辺のラベルとその置き方 EdgeLabelStyle Automatic 辺のラベルのスタイル EdgeShapeFunction Automatic 辺のグラフィックス形状を生成する EdgeStyle Automatic 辺のスタイル EdgeWeight Automatic 辺の重み GraphHighlight {} ハイライトするグラフ要素 GraphHighlightStyle Automatic ハイライトするスタイル GraphLayout Automatic 辺と頂点をどのように配置するか PerformanceGoal Automatic パフォーマンスのどの面について最適化するか PlotTheme $PlotTheme グラフの全体的なテーマ VertexCoordinates Automatic 頂点座標 VertexLabels None 頂点のラベルとその置き方 VertexLabelStyle Automatic 頂点ラベルのスタイル VertexShape Automatic 頂点のグラフィックスの形状 VertexShapeFunction Automatic 頂点のグラフィックス形状を生成する VertexSize Medium 頂点の大きさ VertexStyle Automatic 頂点のスタイル VertexWeight Automatic 頂点の重み - PPlotThemeの可能な設定には,共通の基本テーマ.色の特徴テーマ,フォントの特徴テーマ,サイズの特徴テーマがある.
- グラフの特徴テーマは頂点と辺のプロットに影響する.次の特徴テーマを使うことができる.
-

"LargeGraph" 大きいグラフ 
"ClassicLabeled" 従来のグラフ 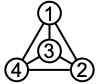
"IndexLabeled" 指標付きのラベルがあるグラフ 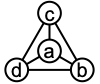
"NameLabeled" 名前のラベル付きグラフ - AnnotationRules->{a->{name1->val1,…},…}は特性 name1->val1等を a と関連付ける.a は頂点,辺,グラフそのもののいずれでもよい.a についての次の文字列には特別な意味がある.
-
"DefaultEdgeProperties" デフォルトの辺の特性 "DefaultVertexProperties" デフォルトの頂点特性 "GraphProperties" グラフそのものの特性 - VertexCoordinates->Automaticの設定では,頂点の置き方と辺の経路指定はGraphLayoutの設定に基づいて自動的に計算される.
- 辺のスタイルその他の指定は事実上PlotTheme,EdgeStyle,GraphHighlightStyle,Styleその他のラッパー,EdgeShapeFunctionの順に適用され,後の指定が先の指定を無効にする.
- 頂点のスタイルその他の指定は事実上PlotTheme,VertexStyle,GraphHighlightStyle,Styleその他のラッパー,VertexShapeFunctionの順に適用され,後の指定が先の指定を無効にする.
- 辺のラベルのスタイルやその他の指定は事実上PlotTheme,EdgeLabelStyle,GraphHighlightStyle,Labeled,EdgeLabelsの順に適用され,後の指定が先の指定を無効にする.
- 頂点ラベルのスタイルやその他の指定は事実上PlotTheme,VertexLabelStyle,GraphHighlightStyle,Labeled,VertexLabelsの順に適用され,後の指定が先の指定を無効にする.
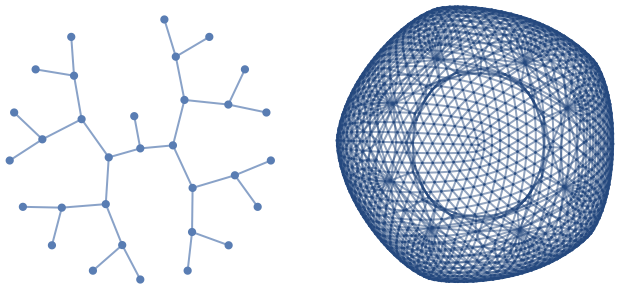
全オプションのリスト
例題
すべて開く すべて閉じる例 (5)
Graph[{12, 23, 31}]Graph[{12, 23, 31}]Graph[{12, 23, 31}, VertexStyle -> Directive[Orange, EdgeForm[Orange]], EdgeStyle -> Green]Graph[{1, 2, Style[3, Red]}, {12, 23, Style[31, Blue]}]Graph[{12, 23, Labeled[31, "hello"]}, VertexLabels -> "Name"]Graph[{12, 23, 31}, VertexShapeFunction -> "Diamond", VertexSize -> Medium]Graph[{12, 23, 31}, EdgeShapeFunction -> "CarvedArcArrow"]スコープ (28)
接続性 (9)
 で入力する:
Graph[{12, 23, 31}]
 で入力する:
Graph[{12, 23, 31}]Graph[{1 -> 2, 2 -> 3, 3 -> 1}]Graph[{1 -> 2, 2 -> 3, 3 -> 1}, DirectedEdges -> False]頂点の明示的なリストを与え,孤立した頂点のあるグラフを指定する:
Graph[{1, 2, 3, 4}, {12, 23, 31}]Graph[{}]Through[{VertexCount, EdgeCount}[%]]VertexListとEdgeListを使って辺と頂点を得る:
{g1, g2} = {Graph[{12, 23, 31}], Graph[{23, 12, 31}]}EdgeList /@ {g1, g2}VertexList /@ {g1, g2}明示的な頂点のリストを使ってVertexListで使われる順序を制御する:
{g1, g2} = {Graph[{1, 2, 3}, {23, 12, 31}], Graph[{3, 2, 1}, {23, 12, 31}]}VertexList /@ {g1, g2}{Graph[{12, 22}], Graph[{12, 22}]}{Graph[{ab, bc, ca}], Graph[{"foo""bar", "bar""gnu", "gnu""foo"}],
Graph[{[image][image], [image][image], [image][image]}]}VertexList /@ %ラッパー (5)
{Graph[{Style[1, Red], 2, 3}, {12, 23, 31}], Graph[{1, 2, 3}, {Style[12, Red], 23, 31}]}{Graph[{1, 2, Labeled[Style[3, Red], "hello"]}, {12, 23, 31}], Graph[{1, 2, 3}, {Style[Labeled[12, "hello"], Red], 23, 31}]}Tooltipのようなラッパーでインタラクティブな動作を加える:
Graph[{12, 23, Tooltip[Style[31, Red], "hello"]}]Graph[{12, 23, Tooltip[Style[31, Red], Plot[Sin[x], {x, 0, 2Pi}]]}]Buttonを使って辺や頂点がクリックされたときにアクションが起るようにする:
{Graph[{12, 23, Button[Style[31, Red], Speak["Edge from 3 to 1"]]}], Graph[{1, 2, Button[Style[3, Red], Speak["Vertex 3"]]}, {12, 23, 31}, VertexSize -> Medium]}PopupWindowを使って情報のドリルダウンを提供する:
Graph[{12, 23, PopupWindow[Style[31, Red], DateListPlot[FinancialData["IBM", "Jan. 1, 2004"]]]}]スタイル付け (8)
{Graph[{12, 23, 31}, VertexStyle -> Green], Graph[{12, 23, 31}, EdgeStyle -> Green]}{Graph[{12, 23, 31}, VertexStyle -> {1 -> Green, Orange}], Graph[{12, 23, 31}, EdgeStyle -> {12 -> Green, Orange}]}{Graph[{Style[1, Green], 2, 3}, {12, 23, 31}, VertexStyle -> Orange], Graph[{Style[12, Green], 23, 31}, EdgeStyle -> Orange]}Table[Graph[{12, 23, 31}, VertexSize -> s, PlotLabel -> s], {s, {Tiny, Small, Medium, Large}}]Table[Graph[{12, 23, 31}, VertexSize -> s, PlotLabel -> s], {s, {0.1, 0.2, 0.5, 1}}]VertexShapeFunctionの組込みコレクションを使う:
Table[Graph[{12, 23, 31}, VertexShapeFunction -> s, VertexSize -> 0.2, PlotLabel -> s], {s, {"Triangle", "Square", "Rectangle", "Pentagon", "Hexagon", "Octagon"}}]Table[Graph[{12, 23, 31}, VertexShapeFunction -> s, VertexSize -> 0.2, PlotLabel -> Style[s, 9]], {s, ResourceData["VertexShapeFunction", "Rounded"]}]Table[Graph[{12, 23, 31}, VertexShapeFunction -> s, VertexSize -> 0.2, PlotLabel -> s], {s, ResourceData["VertexShapeFunction", "Concave"]}]Graph[{12, 23, 31}, VertexShapeFunction -> { 1 -> "Square"}, VertexSize -> 0.2]Graph[{12, 23, 31}, VertexShapeFunction -> { 1 -> "Square", "Triangle"}, VertexSize -> 0.2]任意のGraphics,ImageあるいはGraphics3Dを頂点の形として使う:
Table[Graph[{12, 23, 31}, VertexShape -> s, VertexSize -> Medium], {s, {[image], [image], [image]}}]EdgeShapeFunctionの組込みコレクションを使う:
Table[Graph[{12, 23, 31}, EdgeShapeFunction -> {{ef, "ArrowSize" -> 0.1}}, PlotLabel -> ef], {ef, {"BoxLine", "DiamondLine", "DotLine"}}]Table[Graph[{12, 23, 31}, EdgeShapeFunction -> {{ef, "ArrowSize" -> 0.1}}, PlotLabel -> Style[ef, 9]], {ef, ResourceData["EdgeShapeFunction", "FilledArrow"]}]Table[Graph[{12, 23, 31}, EdgeShapeFunction -> {{ef, "ArrowSize" -> 0.1}}, PlotLabel -> Style[ef, 9]], {ef, ResourceData["EdgeShapeFunction", "UnfilledArrow"]}]Table[Graph[{12, 23, 31}, EdgeShapeFunction -> {{ef, "ArrowSize" -> 0.1}}, PlotLabel -> Style[ef, 9]], {ef, ResourceData["EdgeShapeFunction", "CarvedArrow"]}]Graph[{12, 23, 31}, EdgeShapeFunction -> {12 -> "FilledArrow"}]Graph[{12, 23, 31}, EdgeShapeFunction -> {12 -> "FilledArrow", "CarvedArrow"}]ラベル付け (6)
{Graph[{12, 23, Labeled[31, "hello"]}], Graph[{1, 2, Labeled[3, "hello"]}, {12, 23, 31}]}Table[Graph[{1, 2, Labeled[3, l]}, {12, 23, 31}, ImagePadding -> 25], {l, {Sin[x], [image], [image]}}]Table[Graph[{12, 23, Labeled[31, l]}], {l, {Sin[x], [image], [image]}}]Placedを使って記号的な内側の位置を含む頂点ラベルの置き方を制御する:
Table[Graph[{1, 2, Labeled[3, Placed["■■", p]]}, {12, 23, 31}, PlotLabel -> p, VertexSize -> Large, VertexShapeFunction -> "Square"], {p, {Left, Right, Bottom, Top}}]Table[Graph[{1, 2, Labeled[3, Placed["■■", p]]}, {12, 23, 31}, PlotLabel -> p, VertexShapeFunction -> "Square", VertexSize -> Small], {p, {Before, After, Below, Above}}]Table[Graph[{1, 2, Labeled[3, Placed["■", p]]}, {12, 23, 31}, VertexSize -> 0.25, VertexShapeFunction -> "Square", PlotLabel -> p, BaselinePosition -> Axis], {p, {{0, 0}, {1 / 2, 1 / 2}, {1, 1}}}]Placedをラッパーを使って複数のラベルを置く:
Graph[{1, 2, Labeled[3, Placed[{"lbl1", "lbl2"}, {Above, Below}]]}, {12, 23, 31}]Graph[{1, 2, Labeled[3, Placed[{"lbl1", "lbl2", "lbl3", "lbl4"}, {Above, After, Below, Before}]]}, {12, 23, 31}]VertexLabelsを使って複数のラベルを置く:
Graph[{12, 23, 31}, VertexLabels -> {3 -> Placed[{"lbl1", "lbl2"}, {Above, Below}]}]Placedを記号位置と一緒に使って辺に沿ったラベルの置き方を制御する:
Table[Graph[{Labeled[12, Placed["■■", p]], 23, 31}, PlotLabel -> p, VertexSize -> Small], {p, {"Start", "Middle", "End"}}]Table[Graph[{Labeled[12, Placed["■■", p]], 23, 31}, PlotLabel -> p, VertexSize -> Small, BaselinePosition -> Axis], {p, {0, 1 / 4, 1 / 3}}]Placedをラッパーで使って複数のラベルを置く:
Graph[{12, 23, Labeled[31, Placed[{"lbl1", "lbl2"}, {"Start", "End"}]]}]Graph[{12, 23, Labeled[31, Placed[{"lbl1", "lbl2", "lbl3"}, {"Start", "Middle", "End"}]]}]EdgeLabelsを使って複数のラベルを置く:
Graph[{12, 23, 31}, EdgeLabels -> {31 -> Placed[{"lbl1", "lbl2"}, {"Start", "End"}]}]オプション (85)
AnnotationRules (2)
DirectedEdges (2)
デフォルトで,規則のリストを与えると有向グラフが生成される:
Graph[{1 -> 2, 2 -> 3, 3 -> 1}]DirectedEdges->Falseを使って規則を無向辺として解釈する:
Graph[{1 -> 2, 2 -> 3, 3 -> 1}, DirectedEdges -> False]DirectedEdgeあるいはUndirectedEdgeを使ってグラフが有向かどうかを直接指定する:
{Graph[{12, 23, 31}], Graph[{12, 23, 31}]}EdgeLabels (7)
Graph[{12, 23, 31}, EdgeLabels -> {12 -> "Hello"}]el = {12, 23, 31};Graph[el, EdgeLabels -> Table[el[[i]] -> Subscript[e, i], {i, Length[el]}]]Graph[{12, 23, 31}, EdgeLabels -> {12 -> [image], 23 -> [image], 31 -> [image]}]Placedを記号位置と一緒に使って辺に沿ったラベルの置き方を制御する:
Table[Graph[{12, 23, 31}, EdgeLabels -> {12 -> Placed["■■■", p]}, PlotLabel -> p], {p, {"Start", "Middle", "End"}}]Table[Graph[{12, 23, 31}, EdgeLabels -> {12 -> Placed["■■■", p]}, PlotLabel -> p, BaselinePosition -> Axis], {p, {0, 1 / 3, 1 / 4}}]Table[Graph[{12, 23, 31}, EdgeLabels -> {13 -> Placed["■■■", {1 / 2, p}]}, PlotLabel -> p, BaselinePosition -> Axis], {p, {{0, 0}, {1 / 2, 1 / 2}, {1, 1}}}]Placedをラッパーで使って複数のラベルを置く:
Graph[{12, 23, Labeled[31, Placed[{"lbl1", "lbl2"}, {"Start", "End"}]]}]Graph[{12, 23, Labeled[31, Placed[{"lbl1", "lbl2", "lbl3"}, {"Start", "Middle", "End"}]]}]EdgeLabelsを使って複数のラベルを置く:
Graph[{12, 23, 31}, EdgeLabels -> {31 -> Placed[{"lbl1", "lbl2"}, {"Start", "End"}]}]TooltipとStatusAreaからの値で自動的にラベルを付ける:
Graph[{12, 23, 31}, EdgeLabels -> Placed["Name", Tooltip]]Graph[{12, 23, 31}, EdgeLabels -> Placed["Name", StatusArea]]EdgeShapeFunction (6)
EdgeShapeFunctionの組込み設定のリストを得る:
ResourceData["EdgeShapeFunction"]Graph[{12, 23, 31}, EdgeShapeFunction -> "Line"]Table[Graph[{12, 23, 31}, EdgeShapeFunction -> {{ef, "ArrowSize" -> 0.1}}, PlotLabel -> ef], {ef, {"BoxLine", "DiamondLine", "DotLine"}}]Table[Graph[{12, 23, 31}, EdgeShapeFunction -> {{ef, "ArrowSize" -> 0.1}}, PlotLabel -> Style[ef, 10]], {ef, ResourceData["EdgeShapeFunction", "FilledArrow"]}]Table[Graph[{12, 23, 31}, EdgeShapeFunction -> {{ef, "ArrowSize" -> 0.1}}, PlotLabel -> Style[ef, 9]], {ef, ResourceData["EdgeShapeFunction", "UnfilledArrow"]}]Table[Graph[{12, 23, 31}, EdgeShapeFunction -> {{ef, "ArrowSize" -> 0.1}}, PlotLabel -> Style[ef, 10]], {ef, ResourceData["EdgeShapeFunction", "CarvedArrow"]}]Graph[{12, 23, 31}, EdgeShapeFunction -> {12 -> "FilledArrow"}]Graph[{12, 23, 31}, EdgeShapeFunction -> {12 -> "FilledArrow", "CarvedArrow"}]ef[pts_List, e_] :=
Block[{s = 0.015, g = [image]}, {Arrowheads[{{s, 0.33, g}, {s, 0.67, g}}], Arrow[pts]}]Graph[{12, 23, 31}, EdgeShapeFunction -> ef]EdgeShapeFunctionはEdgeStyleと組み合せることができる:
Graph[{12, 23, 31}, EdgeStyle -> Blue, EdgeShapeFunction -> (Line[#1]&)]EdgeShapeFunctionはEdgeStyleより優先順位が高い:
Graph[{12, 23, 31}, EdgeStyle -> Blue, EdgeShapeFunction -> ({Red, Line[#1]}&)]EdgeStyle (4)
Table[Graph[{12, 23, 31}, EdgeStyle -> style, PlotLabel -> style], {style, {Gray, Dashed, Thick}}]Graph[{12, 23, 31}, EdgeStyle -> {12 -> Blue, 23 -> Dashed}]EdgeStyleはEdgeShapeFunctionと組み合せることができる:
ef1[el_, ___] := Arrow[el, 0.1]Graph[{12, 23, 31}, EdgeStyle -> Blue, EdgeShapeFunction -> ef1]EdgeShapeFunctionはEdgeStyleより優先順位が高い:
ef2[el_, ___] := {Red, Arrow[el, 0.1]}Graph[{12, 23, 31}, EdgeStyle -> Blue, EdgeShapeFunction -> ef2]EdgeStyleはBaseStyleと組み合せることができる:
Graph[{12, 23, 31}, BaseStyle -> Red, EdgeStyle -> Dashed]Graph[{12, 23, 31}, BaseStyle -> Red, EdgeStyle -> Blue]EdgeWeight (2)
Graph[{12, 23, 31}, EdgeWeight -> RandomInteger[5, 3]]WeightedAdjacencyMatrix[%]//MatrixFormGraph[{12, 23, 31}, EdgeWeight -> {a, b, c}]WeightedAdjacencyMatrix[%]//MatrixFormGraphHighlight (3)
Graph[{12, 23, 31}, VertexSize -> Tiny, GraphHighlight -> {1}]Graph[{12, 23, 31}, VertexSize -> Tiny, GraphHighlight -> {23}]Graph[{12, 23, 31}, VertexSize -> Tiny, GraphHighlight -> {1, 2, 13, 23}]GraphHighlightStyle (2)
GraphHighlightStyleの組込み設定のリストを得る:
ResourceData["GraphHighlightStyle"]GraphHighlightStyleの組込み設定を使う:
Graph[{12, 23, 31}, GraphHighlight -> {1, 23}, VertexSize -> Small, GraphHighlightStyle -> #, PlotLabel -> #]& /@ Select[ResourceData["GraphHighlightStyle"], # =!= Automatic&]GraphLayout (5)
Graph[{12, 23, 31}, GraphLayout -> Automatic]Table[Graph[Table[ii + 1, {i, 20}], GraphLayout -> l, PlotLabel -> l], {l, {"CircularEmbedding", "SpiralEmbedding"}}]el = EdgeList@GridGraph[{10, 10}];Table[
Graph[el, GraphLayout -> l, PlotLabel -> Style[l, 10]], {l, {"SpringEmbedding", "SpringElectricalEmbedding", "HighDimensionalEmbedding"}}]VertexCoordinatesはGraphLayoutの座標を無効にする:
{Graph[{12, 23, 31}, GraphLayout -> "SpringElectricalEmbedding"],
Graph[{12, 23, 31}, GraphLayout -> "SpringElectricalEmbedding", VertexCoordinates -> Table[{i, i}, {i, 0, 2}]]}AbsoluteOptionsを使ってレイアウトアルゴリズムで計算されたVertexCoordinatesを抽出する:
Graph[{12, 23, 31}]AbsoluteOptions[%, VertexCoordinates]PlotTheme (4)
ベーステーマ (2)
VertexCoordinates (3)
Graph[{12, 23, 31}]AbsoluteOptionsを使って結果の頂点座標を抽出する:
AbsoluteOptions[%, VertexCoordinates]ellipseLayout[n_, {a_, b_}] := Table[{a Cos[2Pi / n u], b Sin[2Pi / n u]}, {u, 1, n}]Graphics[Point[ellipseLayout[20, {2, 1}]]]Graph[Table[iMod[i + 1, 20, 1], {i, 20}], VertexCoordinates -> ellipseLayout[20, {2, 1}]]VertexCoordinatesはGraphLayoutより優先順位が高い:
Graph[{12, 23, 31}, VertexCoordinates -> Table[{i, i}, {i, 3}], GraphLayout -> "CircularEmbedding"]VertexLabels (14)
Graph[{12, 23, 31}, VertexLabels -> "Name"]Graph[{12, 23, 31}, VertexLabels -> {2 -> "one"}]Graph[{12, 23, 31}, VertexLabels -> Table[i -> Subscript[v, i], {i, 3}]]Graph[{12, 23, 31}, VertexLabels -> {1 -> [image], 2 -> [image], 3 -> [image]}, ImagePadding -> 30]Placedを記号位置と一緒に使って,外側位置を含むラベルの置き方を制御する:
Table[Graph[{12, 23, 31}, VertexSize -> 0.1, VertexShapeFunction -> "Square", VertexLabels -> Table[i -> Placed["■", p], {i, 3}], PlotLabel -> p], {p, {Before, After, Below, Above}}]pl = {{Before, Below}, {After, Below}, {Before, Above}, {After, Above}};Table[Graph[{12, 23, 31}, VertexSize -> 0.1, VertexShapeFunction -> "Square", VertexLabels -> Table[i -> Placed["■", p], {i, 3}], PlotLabel -> p], {p, pl}]Table[Graph[{12, 23, 31}, VertexSize -> 0.25, VertexLabels -> Table[i -> Placed[[image], p], {i, 3}], VertexShapeFunction -> "Square", PlotLabel -> p], {p, {Left, Top, Right, Bottom}}]pl = {{Left, Bottom}, {Right, Bottom}, {Left, Top}, {Right, Top}};Table[Graph[{12, 23, 31}, VertexSize -> 0.25, VertexShapeFunction -> "Square", VertexLabels -> Table[i -> Placed[[image], p], {i, 3}], PlotLabel -> p], {p, pl}]Table[Graph[{12, 23, 31}, VertexSize -> 0.25, VertexShapeFunction -> "Square", VertexLabels -> Table[i -> Placed[[image], p], {i, 3}], PlotLabel -> p, BaselinePosition -> Axis], {p, {{0, 0}, {1 / 2, 1 / 2}, {1, 1}}}]すべてのラベルを頂点の右上コーナー位置に置き,ラベル内の座標を変化させる:
Table[Graph[{12, 23, 31}, VertexSize -> 0.35, VertexShapeFunction -> "Square", VertexLabels -> Table[i -> Placed[[image], {{1, 1}, p}], {i, 3}], PlotLabel -> p, BaselinePosition -> Axis], {p, {{0, 0}, {1 / 2, 1 / 2}, {1, 1}}}]Graph[{12, 23, 31}, VertexSize -> 0.35, VertexLabels -> Placed[[image], Center], VertexShapeFunction -> "Square"]Placedをラッパーで使って複数のラベルを置く:
Graph[{1, 2, Labeled[3, Placed[{"lbl1", "lbl2"}, {Above, Below}]]}, {12, 23, 31}]Graph[{1, 2, Labeled[3, Placed[{"lbl1", "lbl2", "lbl3", "lbl4"}, {Above, After, Below, Before}]]}, {12, 23, 31}]VertexLabelsを使って複数のラベルを置く:
Graph[{12, 23, 31}, VertexLabels -> {3 -> Placed[{"lbl1", "lbl2"}, {Above, Below}]}]Placedの引数を使ってTooltipを含むフォーマットを制御する:
Graph[{12, 23, 31}, VertexLabels -> Placed["Name", Tooltip]]あるいはStatusAreaを含むフォーマットを制御する:
Graph[{12, 23, 31}, VertexLabels -> Placed["Name", StatusArea]]rotateLabel[lbl_] := Rotate[lbl, 45Degree]Graph[{12, 23, 31}, VertexLabels -> Table[i -> Placed["xxx", Below, rotateLabel], {i, 3}]]panelLabel[lbl_] := Panel[lbl, FrameMargins -> 0, Background -> StandardGray]Graph[{12, 23, 31}, VertexLabels -> Table[i -> Placed["xxx", Center, panelLabel], {i, 3}]]hyperlinkLabel[lbl_] := Hyperlink[lbl, "http://www.wolfram.com"]Graph[{12, 23, 31}, VertexLabels -> Table[i -> Placed["xxx", Center, hyperlinkLabel], {i, 3}]]VertexShape (5)
Graphics,ImageあるいはGraphics3Dを頂点の形に使う:
Table[Graph[{12, 23, 31}, VertexShape -> s, VertexSize -> Medium], {s, {[image], [image], [image]}}]Graph[{12, 23, 31}, VertexShape -> {2 -> [image]}, VertexSize -> Medium]VertexShapeはVertexSizeと組み合せることができる:
Table[Graph[{12, 23, 31}, VertexSize -> s, VertexShape -> [image], PlotLabel -> s], {s, {Small, Large}}]VertexShapeはVertexStyleの影響を受けない:
Graph[{12, 23, 31}, VertexSize -> 0.2, VertexShape -> [image], VertexStyle -> Blue]VertexShapeFunctionはVertexShapeより優先順位が高い:
Graph[{12, 23, 31}, VertexSize -> 0.1, VertexShapeFunction -> "Square", VertexShape -> [image]]VertexShapeFunction (11)
組込みのVertexShapeFunctionコレクションのリストを得る:
ResourceData["VertexShapeFunction"]"Basic"コレクションのVertexShapeFunctionの組込み設定を使う:
ResourceData["VertexShapeFunction", "Basic"]Table[Graph[{12, 23, 31}, VertexShapeFunction -> vf, VertexSize -> 0.2, PlotLabel -> vf], {vf, {"Triangle", "Square", "Rectangle", "Pentagon", "Hexagon", "Octagon"}}]Table[Graph[{12, 23, 31}, VertexShapeFunction -> vf, VertexSize -> 0.2, PlotLabel -> vf], {vf, {"DownTrapezoid", "UpTrapezoid", "Parallelogram", "FiveDown", "Circle", "Diamond", "Star", "Capsule"}}]"Rounded"コレクションのVertexShapeFunctionの組込み設定を使う:
ResourceData["VertexShapeFunction", "Rounded"]Table[Graph[{12, 23, 31}, VertexShapeFunction -> vf, VertexSize -> 0.2, PlotLabel -> Style[vf, 9]], {vf, ResourceData["VertexShapeFunction", "Rounded"]}]"Concave"コレクションのVertexShapeFunctionの組込み設定を使う:
ResourceData["VertexShapeFunction", "Concave"]Table[Graph[{12, 23, 31}, VertexShapeFunction -> vf, VertexSize -> 0.2, PlotLabel -> vf], {vf, ResourceData["VertexShapeFunction", "Concave"]}]Graph[{12, 23, 31}, VertexShapeFunction -> { 1 -> "Square"}, VertexSize -> 0.2]Graph[{12, 23, 31}, VertexShapeFunction -> { 1 -> "Square", "Triangle"}, VertexSize -> 0.2]Graph[{12, 23, 31}, VertexShapeFunction -> (Inset[[image], #]&)]vf[{xc_, yc_}, name_, {w_, h_}] :=
Block[{xmin = xc - w, xmax = xc + w, ymin = yc - h, ymax = yc + h},
Polygon[{{xmin, ymin}, {xmax, ymax}, {xmin, ymax}, {xmax, ymin}}]
];Graph[{12, 23, 31}, VertexShapeFunction -> vf, VertexSize -> 0.2]VertexShapeFunctionはVertexStyleと組み合せることができる:
vf1[{xc_, yc_}, name_, {w_, h_}] := Rectangle[{xc - w, yc - h}, {xc + w, yc + h}]Graph[{12, 23, 31}, VertexSize -> 0.2, VertexStyle -> Blue, VertexShapeFunction -> vf1]VertexShapeFunctionはVertexStyleより優先順位が高い:
vf2[{xc_, yc_}, name_, {w_, h_}] := {Red, Rectangle[{xc - w, yc - h}, {xc + w, yc + h}]}Graph[{12, 23, 31}, VertexSize -> 0.2, VertexStyle -> Blue, VertexShapeFunction -> vf2]VertexShapeFunctionはVertexSizeと組み合せることができる:
Graph[{12, 23, 31}, VertexShapeFunction -> "Star", VertexSize -> {1 -> Small, Medium}]VertexShapeFunctionはVertexShapeより優先順位が高い:
Graph[{12, 23, 31}, VertexSize -> 0.3, VertexShapeFunction -> "Star", VertexShape -> [image]]VertexSize (8)
Graph[{12, 23, 31}, VertexSize -> Automatic]Table[Graph[{12, 23, 31}, VertexSize -> s, PlotLabel -> s], {s, {Tiny, Small, Medium, Large}}]Table[Graph[{12, 23, 31}, VertexSize -> s, PlotLabel -> s], {s, 0.1, 1, 0.3}]Table[Graph[{12, 23, 31}, VertexSize -> {"Scaled", s}, PlotLabel -> {"Scaled", s}], {s, 0.1, 1, 0.3}]

Table[Graph[{12, 23, 31}, VertexSize -> s, PlotLabel -> s], {s, {{0.1, 0.2}, {0.2, 0.1}}}]Graph[{12, 23, 31}, VertexSize -> {1 -> 0.2, 2 -> 0.3}]VertexSizeはVertexShapeFunctionと組み合せることができる:
Table[Graph[{12, 23, 31}, VertexSize -> s, VertexShapeFunction -> "Square", PlotLabel -> s], {s, {0.05, 0.1, 0.2}}]VertexSizeはVertexShapeと組み合せることができる:
Table[Graph[{12, 23, 31}, VertexSize -> s, VertexShape -> [image], PlotLabel -> s], {s, {0.1, 0.2, 0.4}}]VertexStyle (5)
Table[Graph[{12, 23, 31}, VertexStyle -> style, VertexSize -> 0.2], {style, {Yellow, EdgeForm[Dashed]}}]Graph[{12, 23, 31}, VertexStyle -> {1 -> Blue, 2 -> Red}, VertexSize -> 0.2]VertexShapeFunctionはVertexStyleと組み合せることができる:
vf1[{xc_, yc_}, name_, {w_, h_}] := Rectangle[{xc - w, yc - h}, {xc + w, yc + h}]Graph[{12, 23, 31}, VertexSize -> 0.2, VertexStyle -> Blue, VertexShapeFunction -> vf1]VertexShapeFunctionはVertexStyleより優先順位が高い:
vf2[{xc_, yc_}, name_, {w_, h_}] := {Red, Rectangle[{xc - w, yc - h}, {xc + w, yc + h}]}Graph[{12, 23, 31}, VertexSize -> 0.2, VertexStyle -> Blue, VertexShapeFunction -> vf2]VertexStyleはBaseStyleと組み合せることができる:
Graph[{12, 23, 31}, VertexStyle -> LightBlue, BaseStyle -> EdgeForm[Dotted], VertexSize -> 0.2]VertexStyleはBaseStyleより優先順位が高い:
Graph[{12, 23, 31}, VertexStyle -> LightBlue, BaseStyle -> Gray, VertexSize -> 0.2]VertexShapeはVertexStyleの影響を受けない:
Graph[{12, 23, 31}, VertexSize -> 0.2, VertexShape -> [image], VertexStyle -> Blue]VertexWeight (2)
アプリケーション (4)
Graph[Table[i -> Mod[i^2, 74], {i, 100}]]Graph[Thread[Range[20] -> RandomSample[Range[20]]]]Tableを使って多くの項目に同じような注釈を設定する:
Graph[Table[Annotation[v, {VertexSize -> 0.2 + 0.2Mod[v, 5], VertexStyle -> Hue[(v/15), 1, 1]}], {v, 0, 14}], Table[vMod[v + 1, 15], {v, 0, 14}]]words = DictionaryLookup["wol*"];Flatten[Map[(Thread[#DeleteCases[Nearest[words, #, 3], #]])&, words]];Graph[%, VertexLabels -> "Name", ImageSize -> 450]特性と関係 (3)
VertexCountとEdgeCountを使って辺と頂点を数える:
g = Graph[Table[iMod[i + 1, 2], {i, 20}]]{VertexCount[g], EdgeCount[g]}VertexListとEdgeListを使って頂点と辺を標準的な順序で列挙する:
g = Graph[{12, 23, 31}];{VertexList[g], EdgeList[g]}g1 = Graph[{23, 31, 12}];{VertexList[g1], EdgeList[g1]}g2 = Graph[{31, 23, 12}];{VertexList[g2], EdgeList[g2]}グラフからAdjacencyMatrixを計算する:
g = Graph[{ab, bc, ca}];(m = AdjacencyMatrix[g]//Normal)//MatrixForm行と列の順序はVertexListで与えられる:
VertexList[g]Position[m, 1, {2}]考えられる問題 (2)
Graphオブジェクトは原子的な未加工オブジェクトである:
g = Graph[{1 -> 2, 2 -> 3, 3 -> 1}];AtomQ[g]GraphQを使ってグラフかどうかを調べる:
MatchQ[g, _ ? GraphQ]Graphでは平行辺は区別できない:
Graph[{Style[12, Red], Style[12, Blue], 23, 31}]EdgeTaggedGraphを使って各辺に一意的なタグを割り当てる:
EdgeTaggedGraph[{Style[12, Red], Style[12, Blue], 23, 31}]EdgeList[%]
 An Elementary Introduction to the Wolfram Language
テキスト
Wolfram Research (2010), Graph, Wolfram言語関数, https://reference.wolfram.com/language/ref/Graph.html (2022年に更新).
CMS
Wolfram Language. 2010. "Graph." Wolfram Language & System Documentation Center. Wolfram Research. Last Modified 2022. https://reference.wolfram.com/language/ref/Graph.html.
APA
Wolfram Language. (2010). Graph. Wolfram Language & System Documentation Center. Retrieved from https://reference.wolfram.com/language/ref/Graph.html