ListVectorPlot3D
ListVectorPlot3D[varr]
根据由向量场的值组成的三维数组生成三维向量图.
ListVectorPlot3D[{data1,data2,…}]
绘制几个向量场的数据.
更多信息和选项


- ListVectorPlot3D 也称为 3D 场图和 3D 方向图.
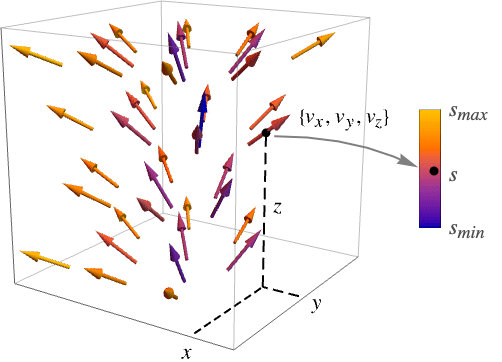
- ListVectorPlot3D 通过绘制归一化到固定长度的箭头显示向量场
 . 默认情况下,根据向量场的大小
  对箭头进行着色.
 - 向量场
 在
在  处的值为 varr〚i,j,k〛.
 - ListVectorPlot3D 默认情况下插值给出的数据,并在规则的三维网格坐标上绘制向量场的向量.
- ListVectorPlot3D 的可选项与 Graphics3D 一样,可以有以下补充和变动: [所有选项的列表]
-
BoxRatios Automatic 高宽比 ClippingStyle Automatic 如何显示向量范围之外的箭头 DataRange Automatic 对数据假设 x、y 和 z 的范围 Method Automatic 绘图时使用的方法 PerformanceGoal $PerformanceGoal 优化的目标 PlotLegends None 包括的图例 PlotRange {Full,Full,Full} 包括的 x、y、z 值的范围 PlotRangePadding Automatic 对数值范围进行多少填充 PlotTheme $PlotTheme 绘图的整体外观主题 RegionBoundaryStyle Automatic 如何设置绘图区域边界的样式 RegionFunction (True&) 确定要包含的区域 ScalingFunctions None 怎样缩放个别坐标 VectorAspectRatio Automatic 箭头的宽长比 VectorColorFunction Automatic 如何为向量着色 VectorColorFunctionScaling True 是否缩放 VectorColorFunction 的参数 VectorPoints Automatic 箭头的数量或位置 VectorRange Automatic 要显示的向量长度的范围 VectorScaling None 如何缩放箭头的大小 VectorSizes Automatic 显示出来的箭头的大小 VectorStyle Automatic 如何绘制向量 - 通过 VectorPoints->All 设置,ListVectorPlot3D 显示与给定的特定向量场数据点关联的向量.
- 各个箭头按比例缩放为适合每个点周围的边界球.
- VectorScaling 将向量的大小缩放到由 VectorSizes 给定的箭头大小的范围:smin 到 smax.
- VectorScaling->Automatic 将根据向量的大小缩放箭头的长度:
- 常见标记包括:
-

"Arrow3D" 3D 箭形标记 
"Arrow" 2D 箭形标记 
"Tube" 与场方向对齐的管段 
"Segment" 与场方向对齐的线段 - VectorColorFunction->None 将按照 VectorStyle 指定的样式绘制箭头.
- RegionFunction 和 VectorColorFunction 的参数是 x、y、z、vx、vy、vz、Norm[{vx,vy,vz}].
- ScalingFunctions 的可能设置包括:
-
{sx,sy,sz} 缩放 x、y 和 z 坐标轴 - 常见的内置缩放函数 s 包括:
-
"Log" 
对数刻度,自动进行标记 "Log10" 
以 10 为底的对数刻度,用 10 的幂进行标记 "SignedLog" 
类似对数的刻度,包含 0 和负数 "Reverse" 
反转坐标的方向 "Infinite" 
无穷刻度


所有选项的列表


范例
打开所有单元关闭所有单元范围 (15)
选项 (70)
PlotLegends (4)
PlotRange (9)
PlotRangePadding (8)
RegionBoundaryStyle (5)
VectorColorFunction (4)
从 ColorData 中使用任意命名的颜色梯度:
使用 VectorColorFunctionScaling->False 获取未经调整尺度的值:
VectorColorFunctionScaling (4)
使用 VectorColorFunctionScaling->False 获取尺度未经调整的值:
VectorMarkers (3)
VectorPoints (8)
VectorScaling (2)
VectorStyle (2)
应用 (2)
属性和关系 (12)
使用 VectorPlot3D 可视化函数:
使用 StreamPlot3D 用流线而非向量来可视化函数:
用 ListSliceVectorPlot3D 沿表面绘制向量:
使用 ListStreamPlot3D 将三维场绘制为流线图:
用 ListVectorPlot 绘制 2D 向量:
用 ListStreamPlot 以流线型代替矢量进行绘图:
用 ListVectorDensityPlot 添加标量场的密度图:
使用 ListStreamDensityPlot 绘制流而非向量:
使用 VectorDisplacementPlot 可视化位移矢量场对指定区域的影响:
使用 ListVectorDisplacementPlot 可视化位移场数据对区域的影响:
用 ListLineIntegralConvolutionPlot 绘制向量场的线积分卷积:
使用 VectorDisplacementPlot3D 可视化位移矢量场对指定三维区域的影响:
使用 ListVectorDisplacementPlot3D 根据数据可视化三维位移矢量场的效果:
用 GeoVectorPlot 在地图上绘制向量:
GeoStreamPlot 函数会使用流而非向量:
文本
Wolfram Research (2008),ListVectorPlot3D,Wolfram 语言函数,https://reference.wolfram.com/language/ref/ListVectorPlot3D.html (更新于 2022 年).
CMS
Wolfram 语言. 2008. "ListVectorPlot3D." Wolfram 语言与系统参考资料中心. Wolfram Research. 最新版本 2022. https://reference.wolfram.com/language/ref/ListVectorPlot3D.html.
APA
Wolfram 语言. (2008). ListVectorPlot3D. Wolfram 语言与系统参考资料中心. 追溯自 https://reference.wolfram.com/language/ref/ListVectorPlot3D.html 年