SliceContourPlot3D
✖
SliceContourPlot3D
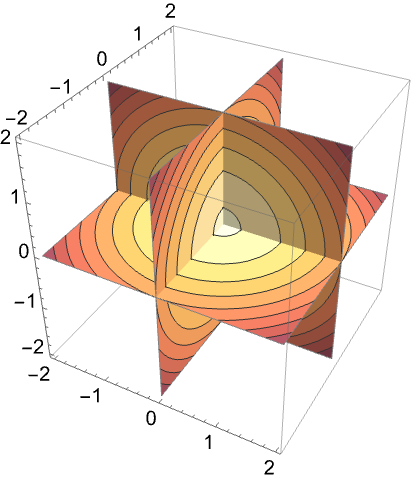
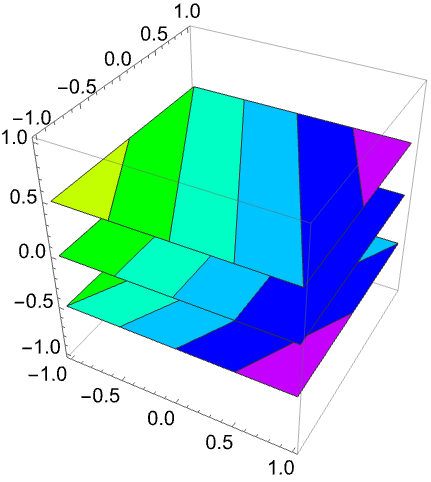
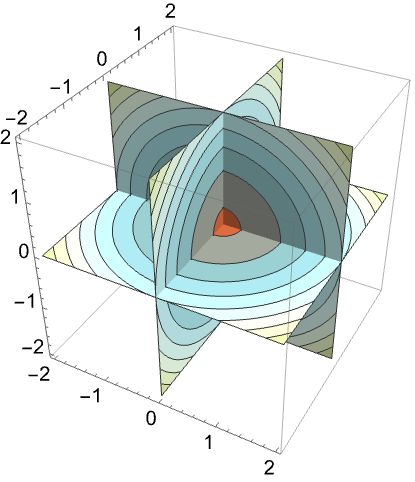
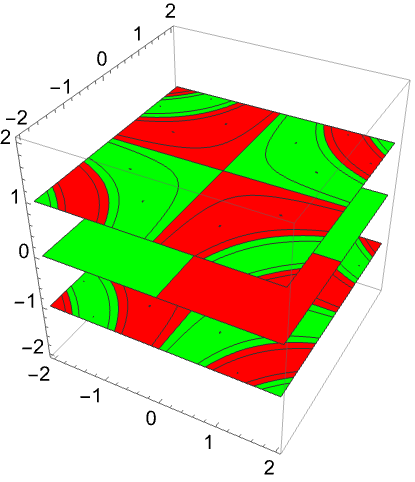
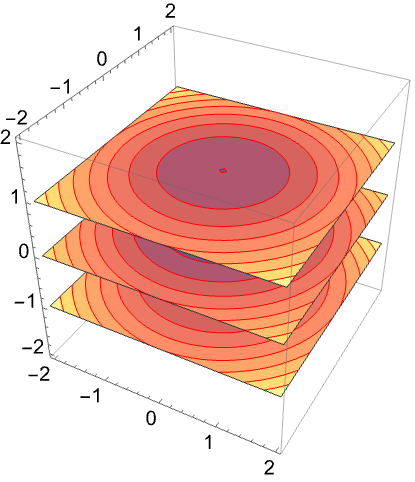
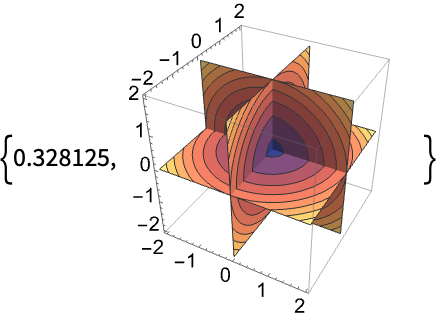
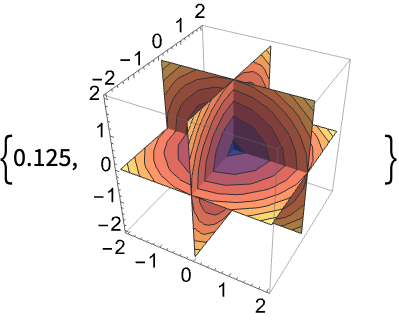
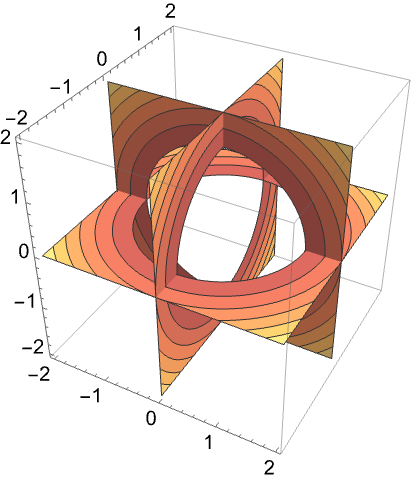
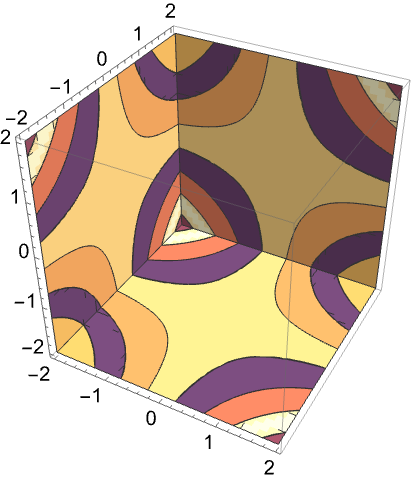
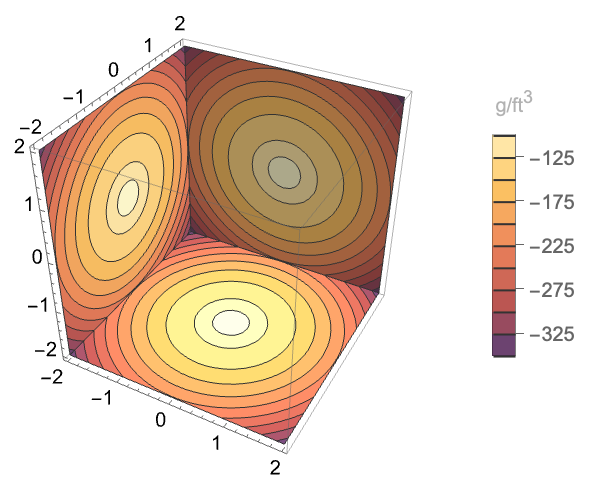
在切片曲面 surf 上,生成以 x、y、z 为函数的 f 的等高线图.
更多信息和选项


- SliceContourPlot3D 在曲面 surf 上构建等值线,对应于 f[x,y,z] 的值为常数 d1、d2 等的水平集. 默认情况下,曲线间的区域被着色,以便更容易识别值介于 di 和 di+1 之间的区域.
- 函数可视化区域
 .
. - 可以给出以下基本切片曲面 surfi:
-
Automatic 自动确定切片曲面 
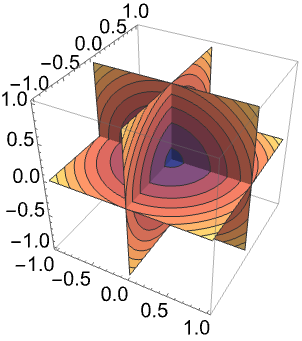
"CenterPlanes" 过中心点的坐标平面 
"BackPlanes" 图形后面的坐标平面 
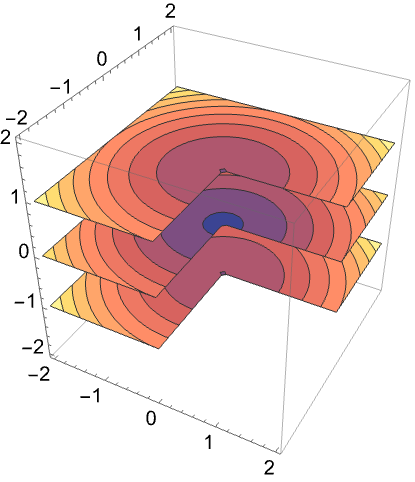
"XStackedPlanes" 沿  轴叠放的坐标平面
"YStackedPlanes" 沿  轴叠放的坐标平面
"ZStackedPlanes" 沿  轴叠放的坐标平面
"DiagonalStackedPlanes" 沿对角线叠放的坐标平面 
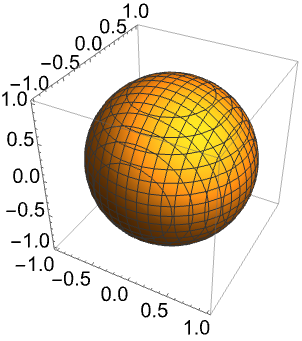
"CenterSphere" 位于中心的球面 
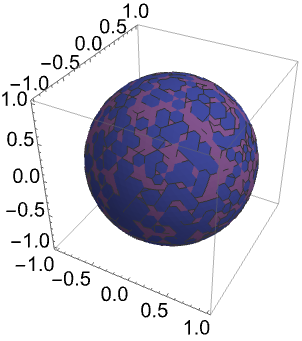
"CenterCutSphere" 切去楔形块的球面 
"CenterCutBox" 八分之一被切掉的盒子 - SliceContourPlot3D[f,{x,xmin,xmax},…] 等价于 SliceContourPlot3D[f,Automatic,{x,xmin,xmax},…] 等.
- 以下参数化可以用于基本切片曲面:
-
{"XStackedPlanes",n}, 生成 n 个等间隔平面 {"XStackedPlanes",{x1,x2,…}} 生成平面 
{"CenterCutSphere",ϕopen} 正对视点处切去角 ϕopen {"CenterCutSphere",ϕopen,ϕcenter} 以  平面上的 ϕcenter 为中心角切去角 ϕopen
 - "YStackedPlanes"、"ZStackedPlanes" 和 "XStackedPlanes" 的规范一样,在“范围”下面的例子中会展示更多的用法.
- 可以使用下列常见的切片曲面 surfi:
-
expr0 以 x、y 和 z 表示的隐方程,如 x y z-10 surfaceregion 三维空间中的二维区域,如 Hyperplane volumeregion 三维空间中的三维区域,其中 surfi 为边界曲面,如 Cuboid - 可将下列封装用于切片曲面 surfi:
-
Annotation[surf,label] 提供注释 Button[surf,action] 定义当曲面被点击时应执行的操作 EventHandler[surf,…] 为曲面定义通用事件处理程序 (general event handler) Hyperlink[surf,uri] 将曲面设置为超链接 PopupWindow[surf,cont] 为曲面添加弹出窗口 StatusArea[surf,label] 当鼠标悬停在曲面处时,在状态栏中显示的内容 Tooltip[surf,label] 为曲面添加任意提示条 - SliceContourPlot3D 与 Graphics3D 的选项相同,不同之处和更多选项如下所示: [所有选项的列表]
-
Axes True 是否绘制坐标轴 BoundaryStyle Automatic 如何设计曲面边界 BoxRatios {1,1,1} 三维边界盒的比例 ClippingStyle None 如何绘制用 PlotRange 修剪过的值 ColorFunction Automatic 如何为图上色 ColorFunctionScaling True 是否缩放传递给 ColorFunction 的参数 Contours Automatic 在每个曲面上显示多少个或显示什么样的等高线 ContourShading Automatic 如何为等高线间的区域做明暗处理 ContourStyle Automatic 等高线的样式 PerformanceGoal $PerformanceGoal 优化的目标 PlotLegends None 颜色梯度的图例 PlotPoints Automatic 每个方向上函数 f 和切片曲面 surfi 的初始样本数 PlotRange {Full,Full,Full,Automatic} 函数 f 的值域或要包括的其他值 PlotTheme $PlotTheme 图的整体主题 RegionFunction (True&) 如何决定是否要包括某个点 ScalingFunctions None 怎样缩放个别坐标 TargetUnits Automatic 想要使用的单位 WorkingPrecision MachinePrecision 内部计算时使用的精度 - 默认情况下,传递给 ColorFunction 的是经过缩放的 f 值.
- 默认情况下,RegionFunction 的变量由 x、y、z 和 f 提供.
- ScalingFunctions 的可能设置包括:
-
sf 缩放 f 等值线的值 {sx,sy,sz} 缩放 x、y 和 z 坐标轴 {sx,sy,sz,sf} 缩放 x、y 和 z 坐标轴以及 f 等值线的值 - 常见内置缩放函数 s 包括:
-
"Log" 
对数刻度,自动进行标记 "Log10" 
以 10 为底的对数刻度,用 10 的幂进行标记 "SignedLog" 
类似对数的刻度,包含 0 和负数 "Reverse" 
反转坐标的方向 "Infinite" 
无穷刻度
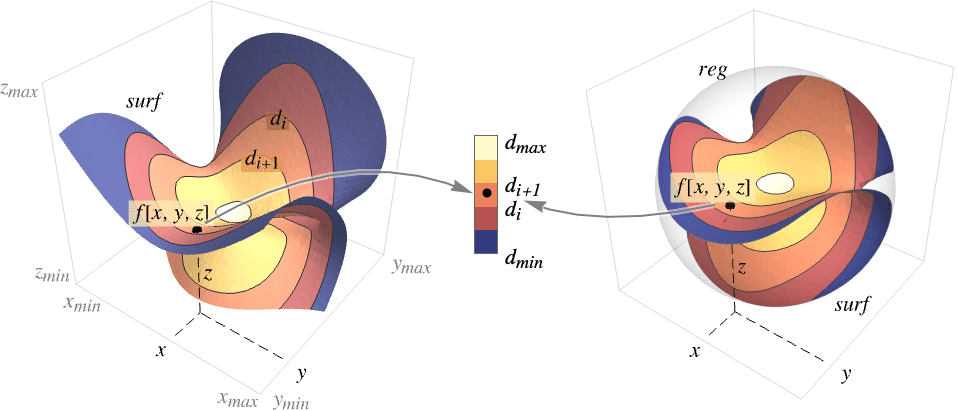
所有选项的列表


范例
打开所有单元关闭所有单元基本范例 (2)常见实例总结
范围 (24)标准用法实例范围调查
曲面 (9)
https://wolfram.com/xid/0tp1gh65gqu1tk-y8d13b

https://wolfram.com/xid/0tp1gh65gqu1tk-g49ifo

https://wolfram.com/xid/0tp1gh65gqu1tk-t9j4z8

https://wolfram.com/xid/0tp1gh65gqu1tk-533t34

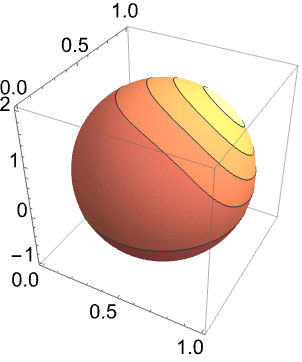
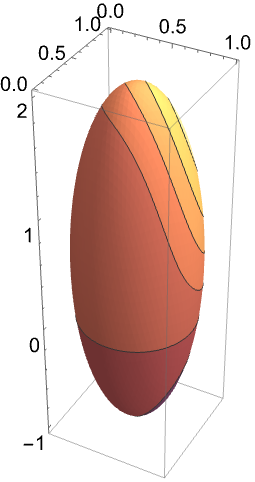
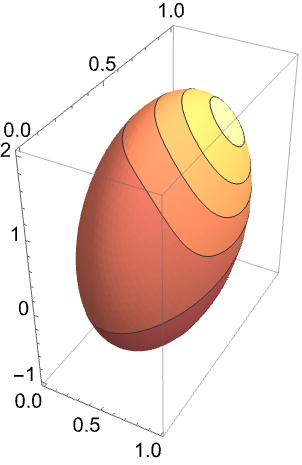
在基本几何体(volume primitive)上绘制等高线图相当于在 RegionBoundary[reg] 上绘制:
https://wolfram.com/xid/0tp1gh65gqu1tk-ldhqvm

https://wolfram.com/xid/0tp1gh65gqu1tk-7cse7o

https://wolfram.com/xid/0tp1gh65gqu1tk-cyajg1

https://wolfram.com/xid/0tp1gh65gqu1tk-5vavq1

https://wolfram.com/xid/0tp1gh65gqu1tk-7ng1gh

抽样 (4)
使用 Contours 指定等高线的数量:
https://wolfram.com/xid/0tp1gh65gqu1tk-bfpkkk

https://wolfram.com/xid/0tp1gh65gqu1tk-xuugwu

https://wolfram.com/xid/0tp1gh65gqu1tk-q5mv44
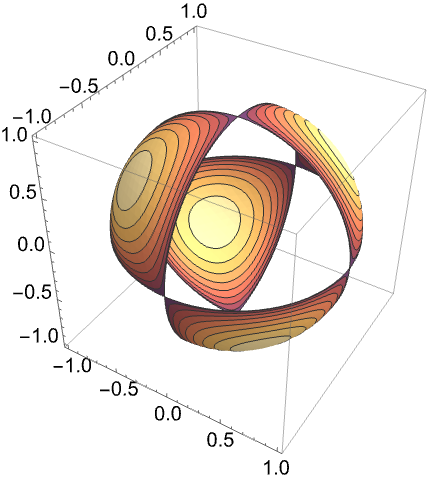
用 RegionFunction 来显示被遮挡的切片:
https://wolfram.com/xid/0tp1gh65gqu1tk-dhqoa
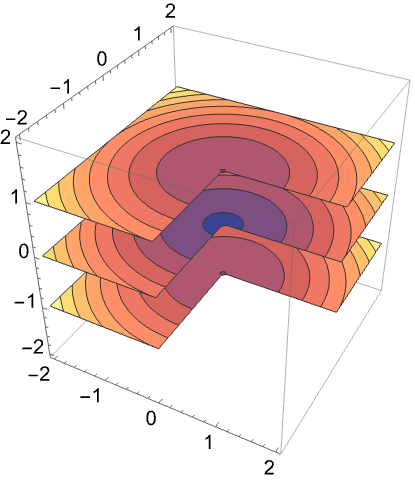
可以用包含 Cone 的区域来指定值域:
https://wolfram.com/xid/0tp1gh65gqu1tk-pu0wit

一个含有 ImplicitRegion 的公式区域(formula region):
https://wolfram.com/xid/0tp1gh65gqu1tk-j02kuu
https://wolfram.com/xid/0tp1gh65gqu1tk-fhzvnj
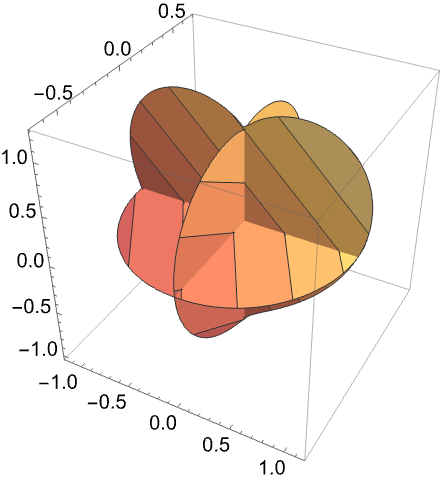
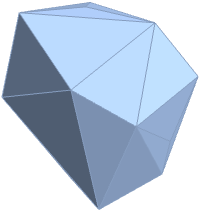
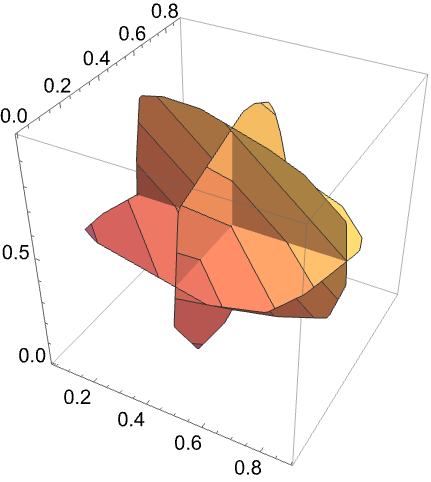
一个含有 BoundaryMeshRegion 的基于网格的区域:
https://wolfram.com/xid/0tp1gh65gqu1tk-mn7ny
https://wolfram.com/xid/0tp1gh65gqu1tk-bf1zwg
演示 (11)
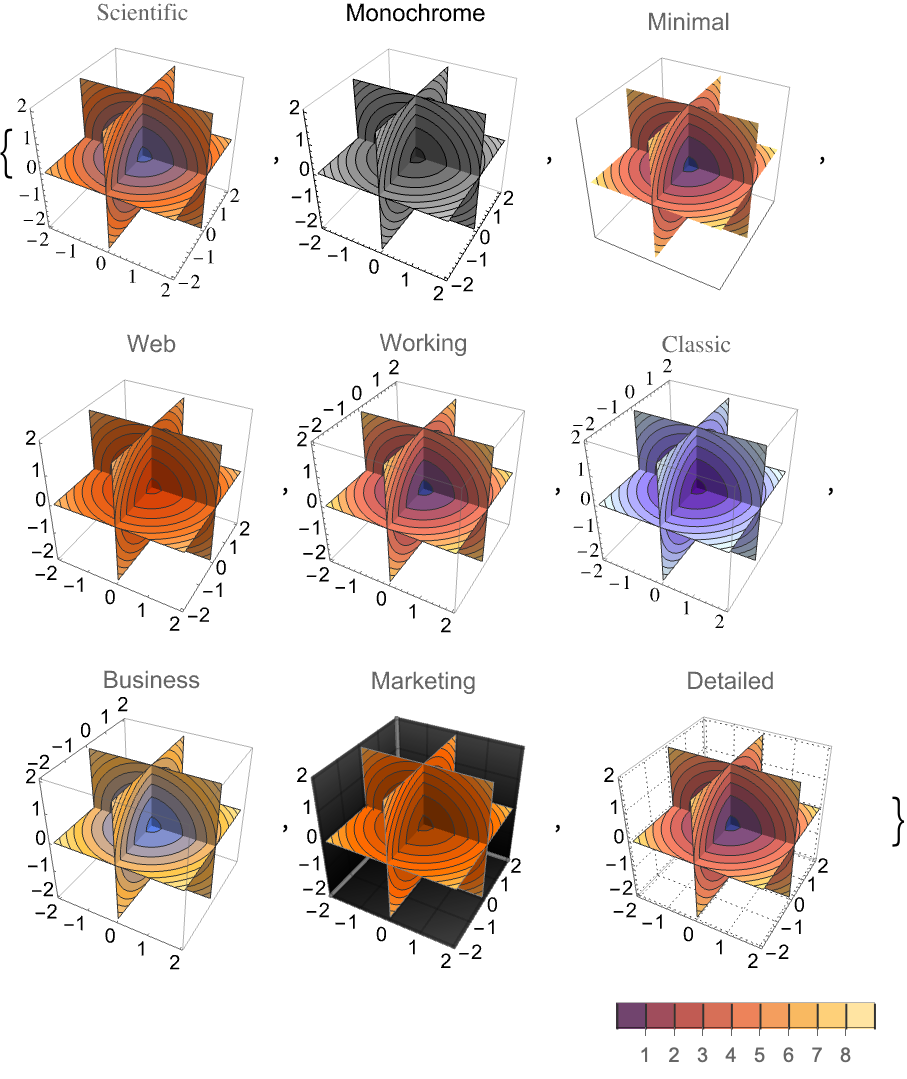
使用 PlotTheme 对整体样式进行配置:
https://wolfram.com/xid/0tp1gh65gqu1tk-qpuqqo

用 PlotLegends 显示不同数值对应的颜色:
https://wolfram.com/xid/0tp1gh65gqu1tk-rhpvcf

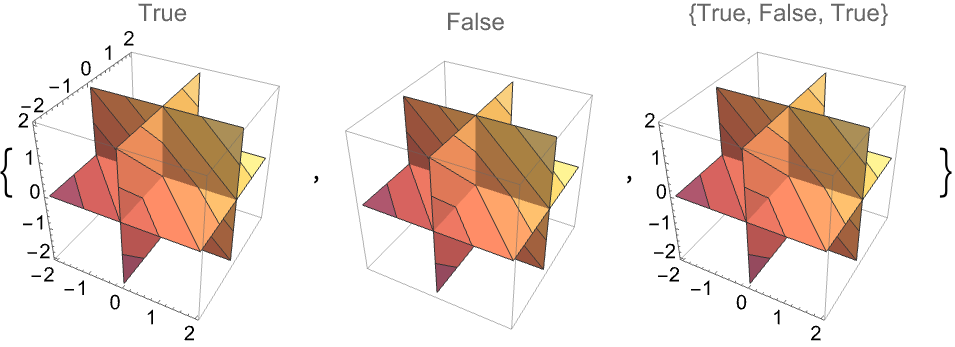
用 Axes 控制坐标轴的显示:
https://wolfram.com/xid/0tp1gh65gqu1tk-nyudgi
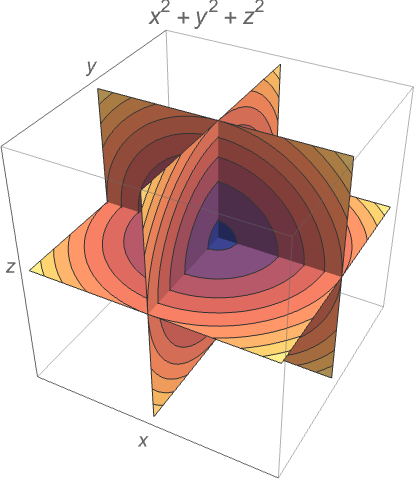
可使用 AxesLabel 为坐标轴添加标签,使用 PlotLabel 为整个图添加标签:
https://wolfram.com/xid/0tp1gh65gqu1tk-j8uski
用 ColorFunction 根据函数值为图上色:
https://wolfram.com/xid/0tp1gh65gqu1tk-2bv1by
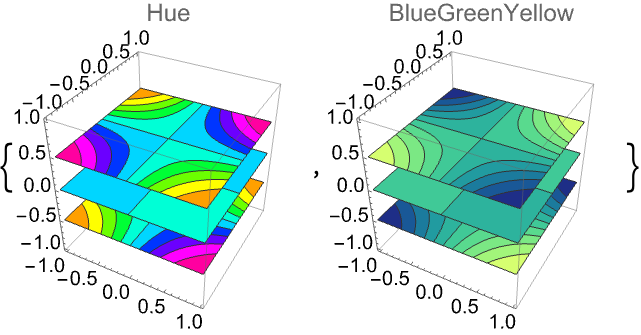
用 ContourShading 为等高线间的区域设计样式:

https://wolfram.com/xid/0tp1gh65gqu1tk-brwdo2
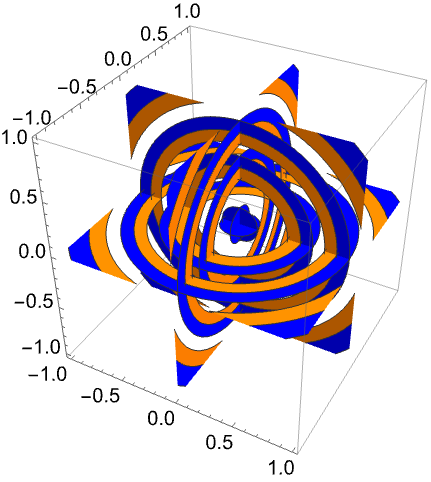
用 ContourStyle 为等高线设计样式:
https://wolfram.com/xid/0tp1gh65gqu1tk-m1arsj
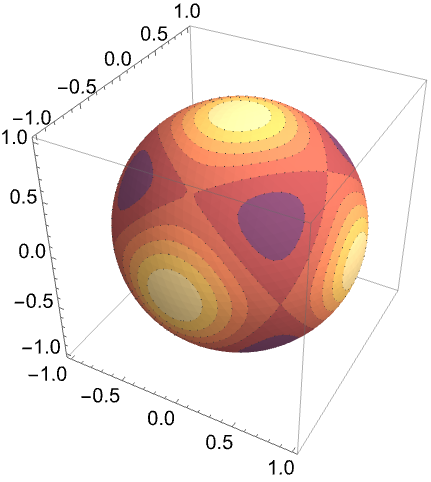
用 BoundaryStyle 为切片曲面边界设计样式:
https://wolfram.com/xid/0tp1gh65gqu1tk-cyvpky
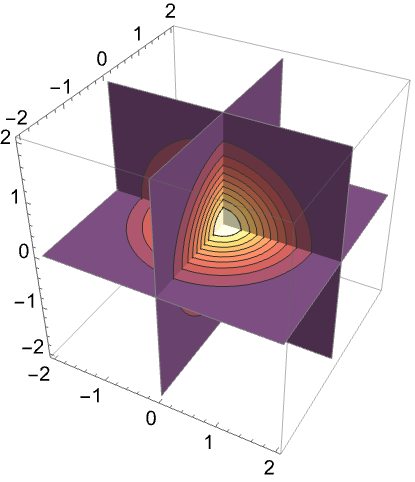
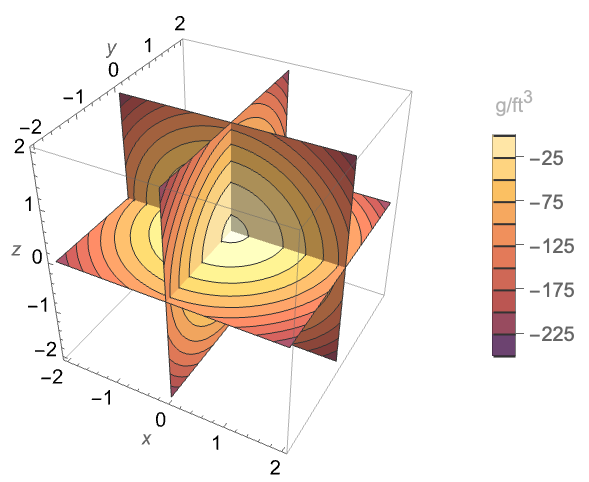
TargetUnits 指定在可视化时使用哪个单位:

https://wolfram.com/xid/0tp1gh65gqu1tk-t4u8b6
https://wolfram.com/xid/0tp1gh65gqu1tk-24omnx
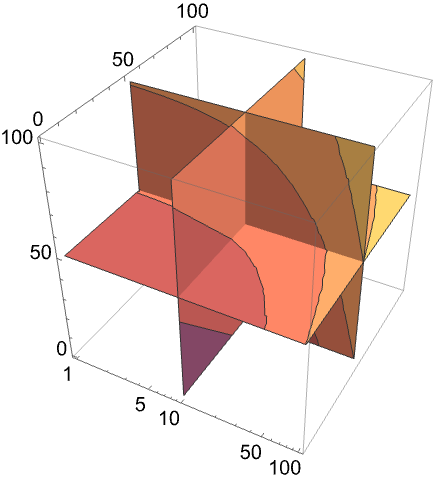
https://wolfram.com/xid/0tp1gh65gqu1tk-l3ao9
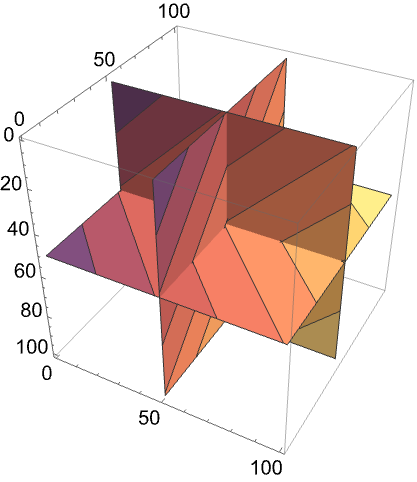
选项 (43)各选项的常用值和功能
BoundaryStyle (1)
BoxRatios (3)
ClippingStyle (2)
https://wolfram.com/xid/0tp1gh65gqu1tk-m7ibeu
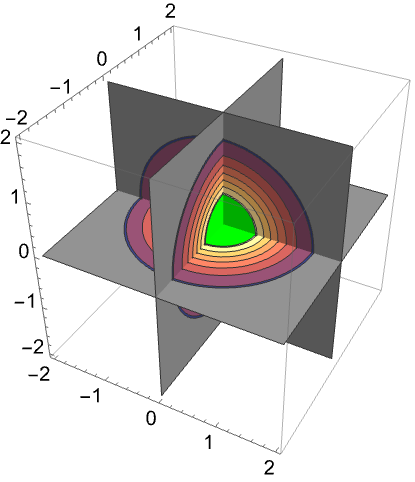
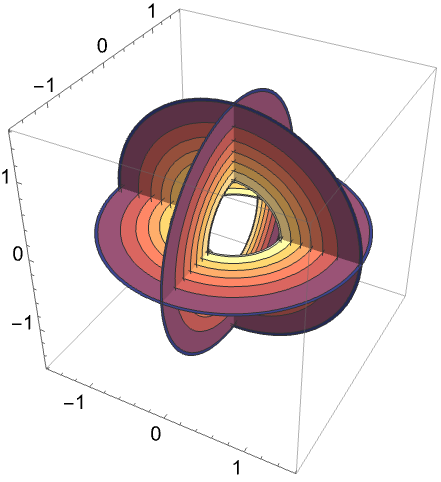
用 None 去掉剪切区域:
https://wolfram.com/xid/0tp1gh65gqu1tk-qa2soa
ColorFunction (3)
ColorFunctionScaling (2)
https://wolfram.com/xid/0tp1gh65gqu1tk-rrfrkq
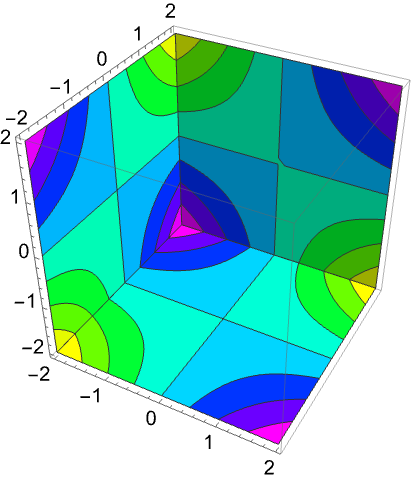
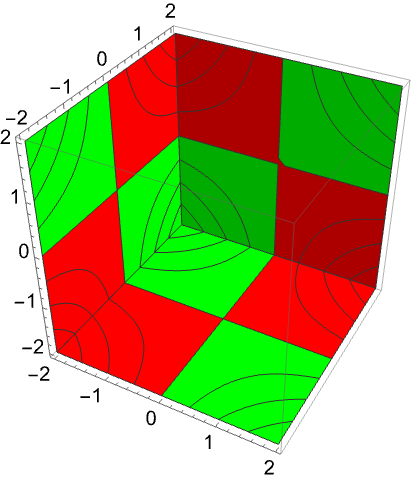
用 ColorFunctionScalingFalse 来得到未经缩放的值:
https://wolfram.com/xid/0tp1gh65gqu1tk-g000x6
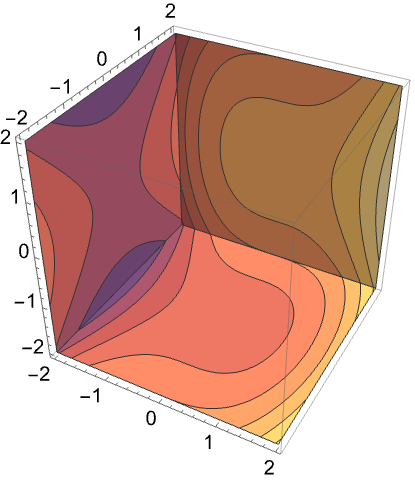
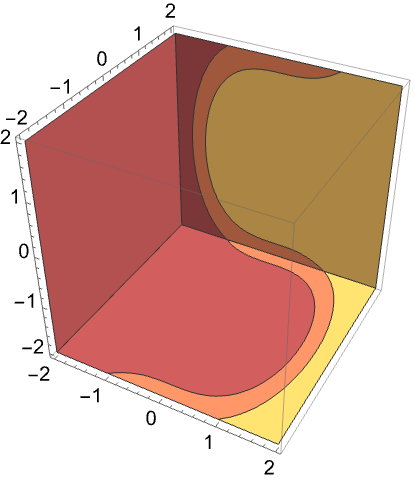
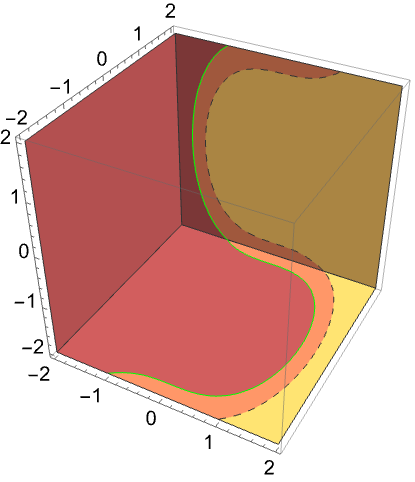
Contours (4)
https://wolfram.com/xid/0tp1gh65gqu1tk-8qd9h1
https://wolfram.com/xid/0tp1gh65gqu1tk-gsf8x7
https://wolfram.com/xid/0tp1gh65gqu1tk-rjmys1
https://wolfram.com/xid/0tp1gh65gqu1tk-ocd2kq
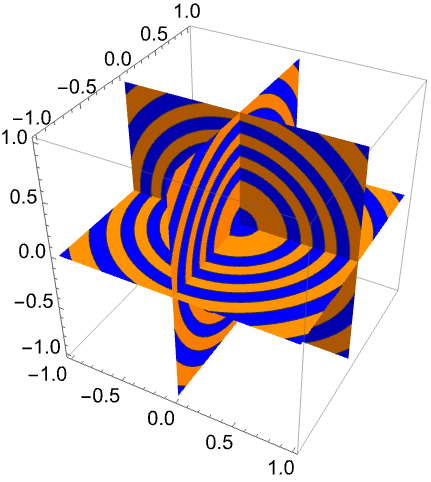
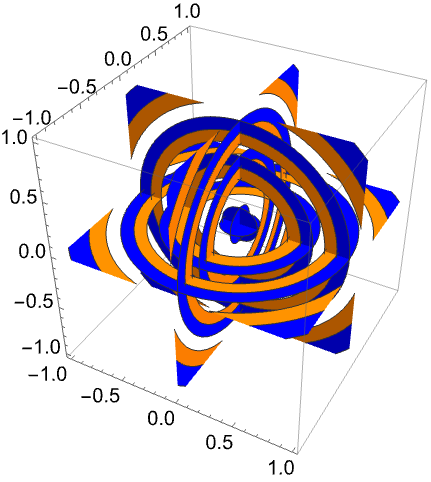
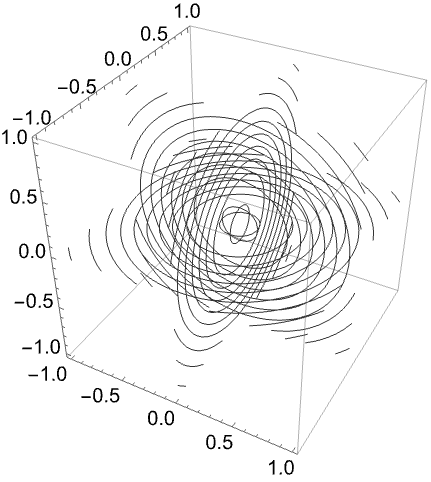
ContourShading (4)
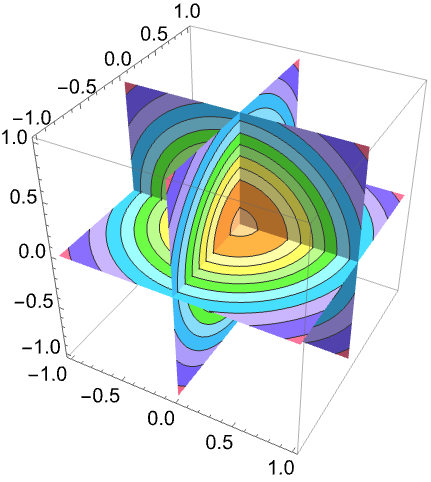
ContourShadingAutomatic 根据 ColorFunction 计算等高线区域的色调:

https://wolfram.com/xid/0tp1gh65gqu1tk-52ac5a
https://wolfram.com/xid/0tp1gh65gqu1tk-u4k26q

https://wolfram.com/xid/0tp1gh65gqu1tk-858exy
https://wolfram.com/xid/0tp1gh65gqu1tk-3g9uou
PerformanceGoal (2)
PlotLegends (4)
https://wolfram.com/xid/0tp1gh65gqu1tk-hv5wme
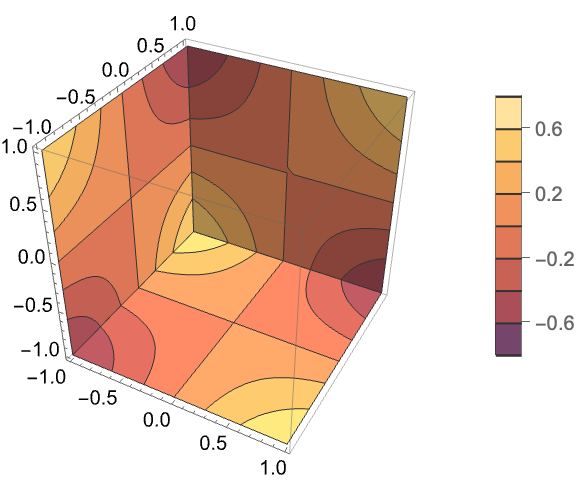
PlotLegends 自动获取 Contours 和 ContourShading 的值:

https://wolfram.com/xid/0tp1gh65gqu1tk-3bop1e
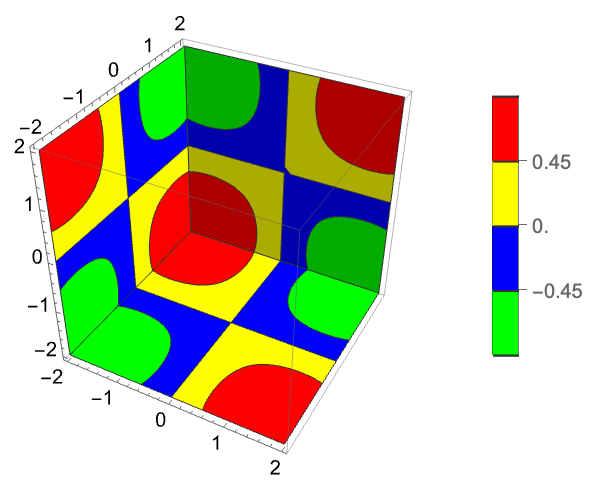
设置 ContourShadingAutomatic,可从 ColorFunction 得到颜色:
https://wolfram.com/xid/0tp1gh65gqu1tk-6ppeoh
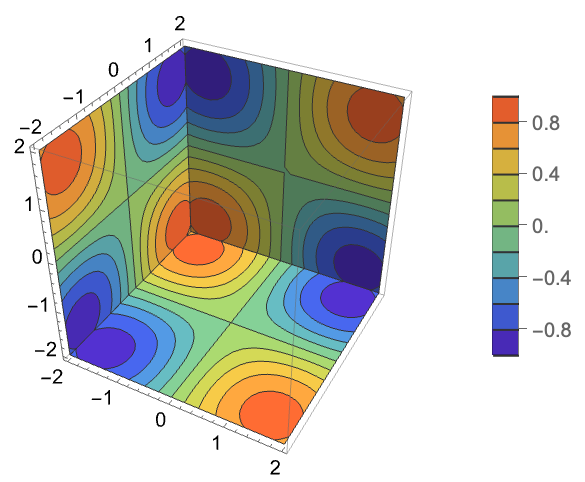
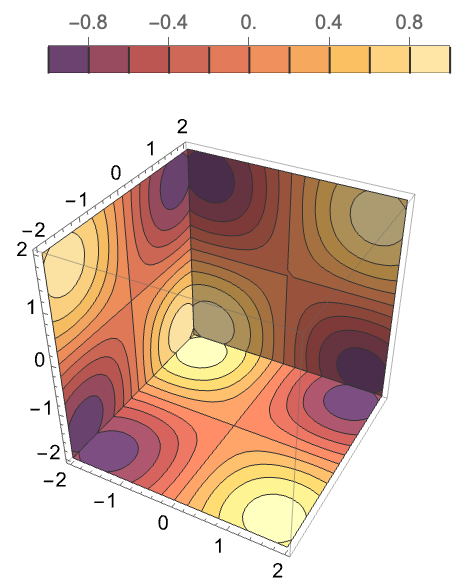
用 Placed 控制图例的位置:
https://wolfram.com/xid/0tp1gh65gqu1tk-pqj5ip
PlotRange (3)
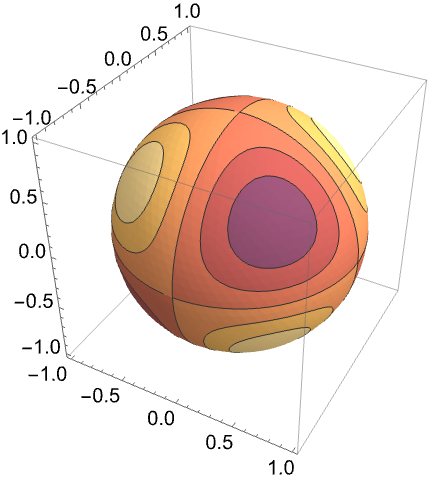
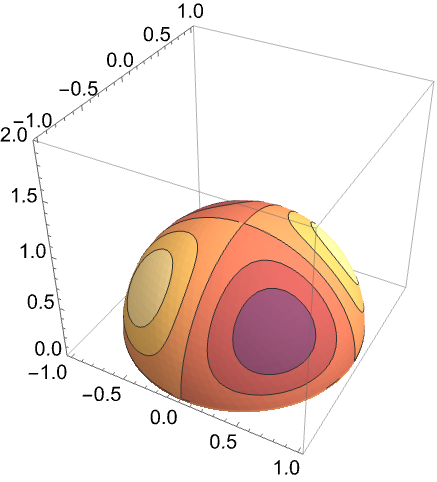
默认情况下显示 All 等高线:
https://wolfram.com/xid/0tp1gh65gqu1tk-uhazyj
https://wolfram.com/xid/0tp1gh65gqu1tk-hwlvlp
https://wolfram.com/xid/0tp1gh65gqu1tk-hjax0p
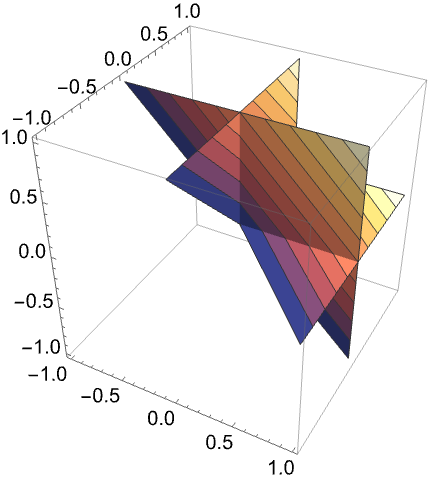
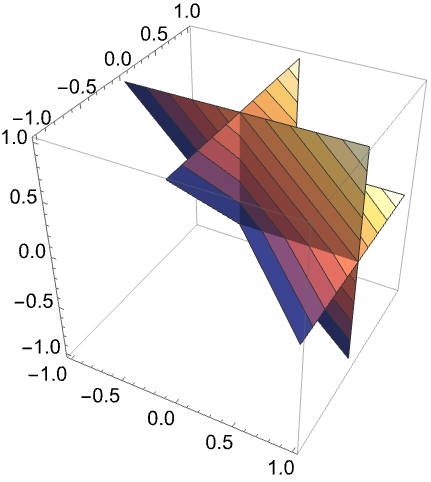
其与完整形式(fully qualified form)等价:
https://wolfram.com/xid/0tp1gh65gqu1tk-m0kjnp
PlotTheme (3)
https://wolfram.com/xid/0tp1gh65gqu1tk-ygbqhf
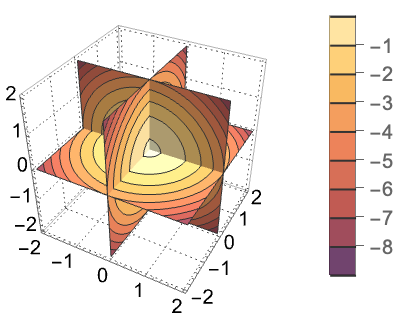
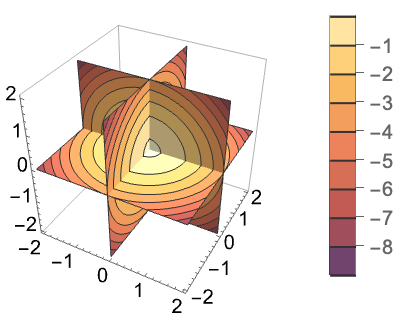
任何选项设定都可以重写 PlotTheme 的设置,在以下情况中,移除了表面的网格:
https://wolfram.com/xid/0tp1gh65gqu1tk-2dqvd3

https://wolfram.com/xid/0tp1gh65gqu1tk-g0e9g0
RegionFunction (2)
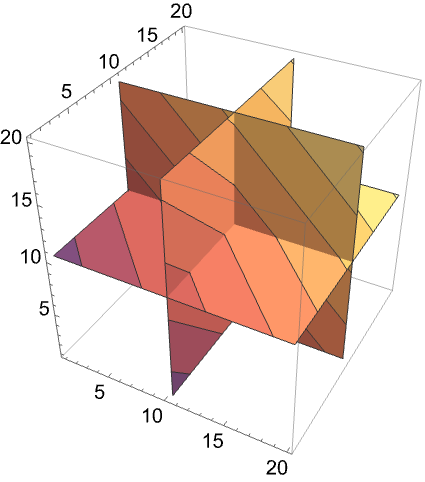
ScalingFunctions (5)
https://wolfram.com/xid/0tp1gh65gqu1tk-52n5ur
https://wolfram.com/xid/0tp1gh65gqu1tk-rgmd7s
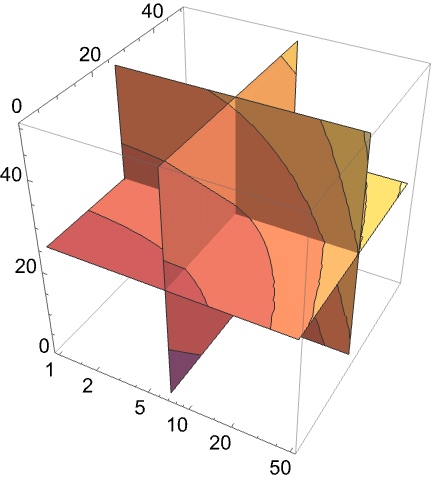
用 ScalingFunctions 缩放并反转 ![]() 轴:
轴:
https://wolfram.com/xid/0tp1gh65gqu1tk-47658g
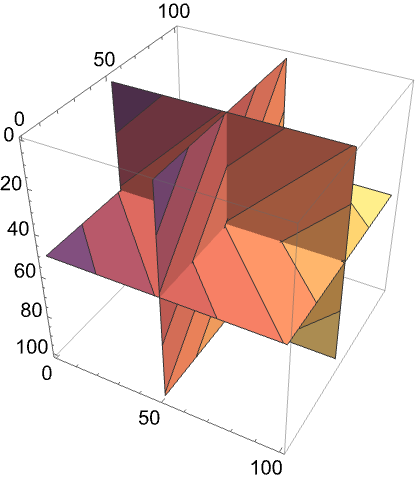
https://wolfram.com/xid/0tp1gh65gqu1tk-7lj6h6
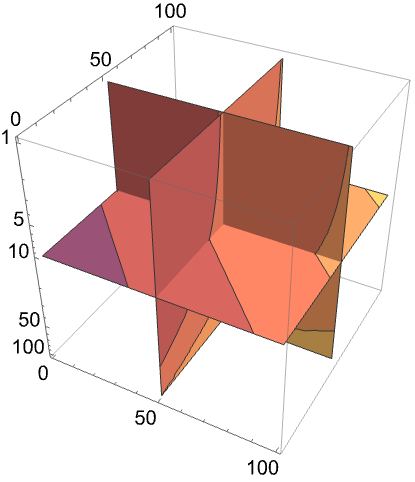
https://wolfram.com/xid/0tp1gh65gqu1tk-vw38w5
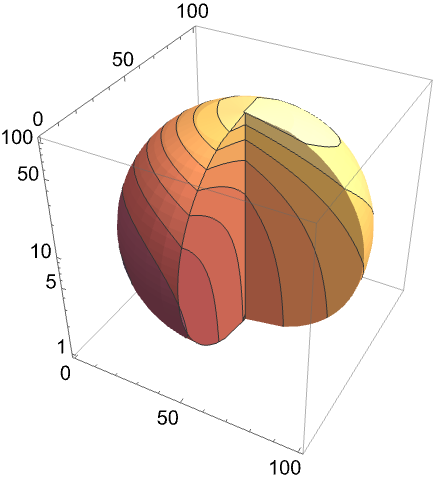
TargetUnits (2)
坐标轴和图例的标签都使用 TargetUnits 指定的单位:

https://wolfram.com/xid/0tp1gh65gqu1tk-qo473z
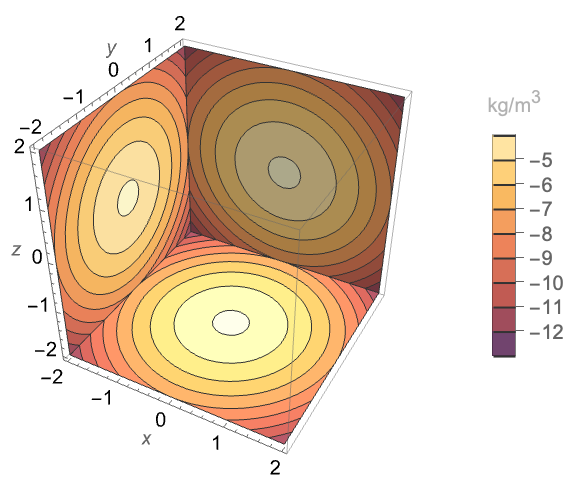
将 Quantity 指定的单位转换成 TargetUnits 指定的单位:
https://wolfram.com/xid/0tp1gh65gqu1tk-6qstx3
应用 (17)用该函数可以解决的问题范例
基础函数 (4)
https://wolfram.com/xid/0tp1gh65gqu1tk-c1wwxq
https://wolfram.com/xid/0tp1gh65gqu1tk-kkv9gr
https://wolfram.com/xid/0tp1gh65gqu1tk-lt4pqt
https://wolfram.com/xid/0tp1gh65gqu1tk-ou5i2

https://wolfram.com/xid/0tp1gh65gqu1tk-ca0wen

https://wolfram.com/xid/0tp1gh65gqu1tk-p1zn1
https://wolfram.com/xid/0tp1gh65gqu1tk-cnfe6k
https://wolfram.com/xid/0tp1gh65gqu1tk-pqgfdc

https://wolfram.com/xid/0tp1gh65gqu1tk-nylmyx
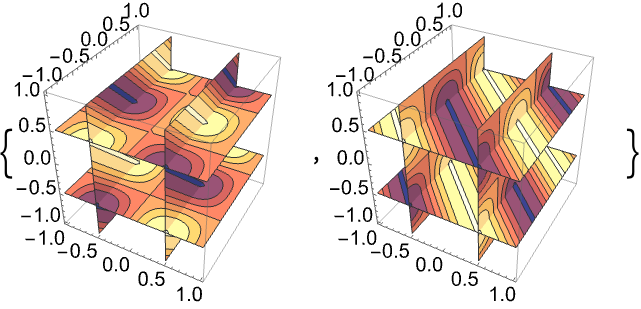
https://wolfram.com/xid/0tp1gh65gqu1tk-dvwij4
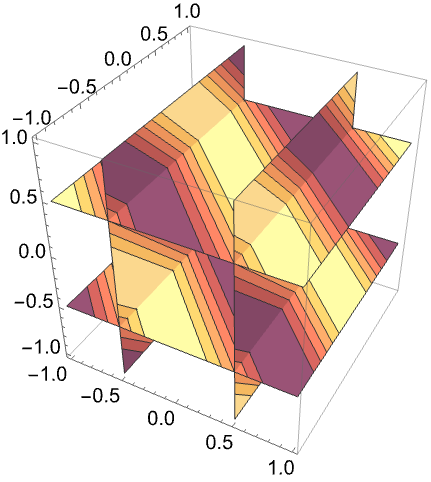
https://wolfram.com/xid/0tp1gh65gqu1tk-l4zx6v

https://wolfram.com/xid/0tp1gh65gqu1tk-5fx0vo
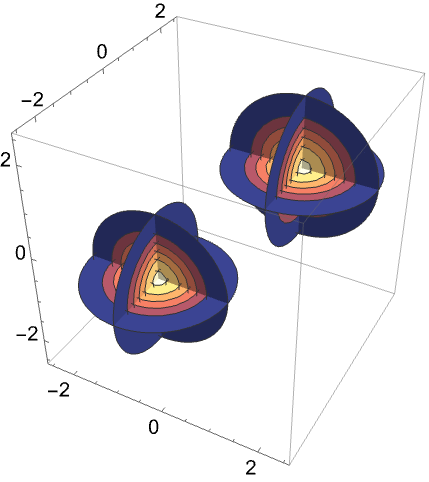
https://wolfram.com/xid/0tp1gh65gqu1tk-fz9nz1
https://wolfram.com/xid/0tp1gh65gqu1tk-qvme8b
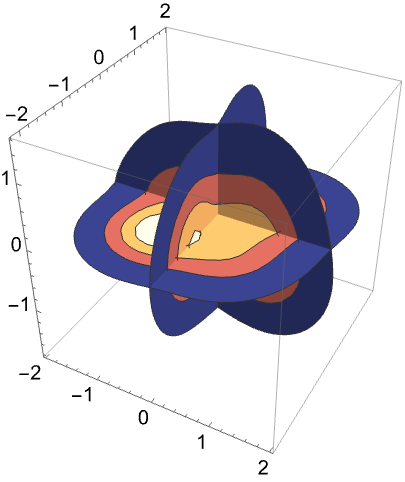
分布函数 (6)
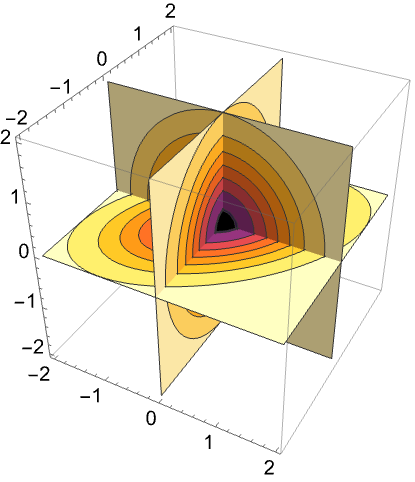
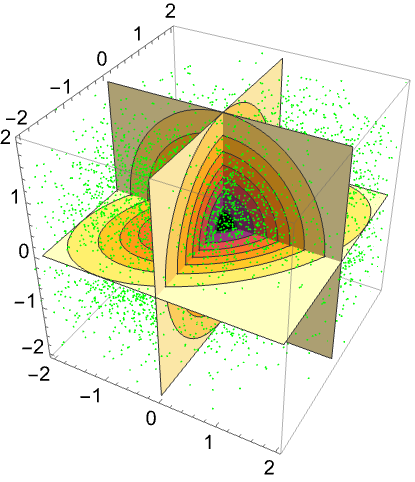
绘制某分布的 PDF:
https://wolfram.com/xid/0tp1gh65gqu1tk-81fcz8
https://wolfram.com/xid/0tp1gh65gqu1tk-v7omgq
https://wolfram.com/xid/0tp1gh65gqu1tk-gm668q
https://wolfram.com/xid/0tp1gh65gqu1tk-fg91iz
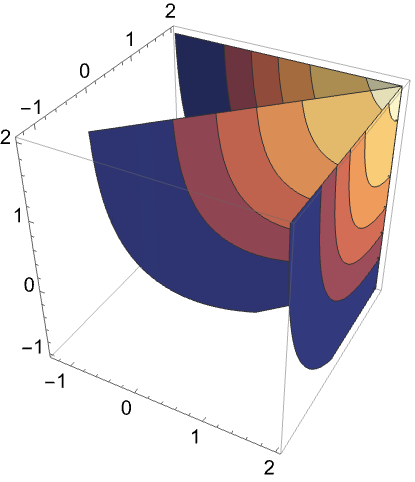
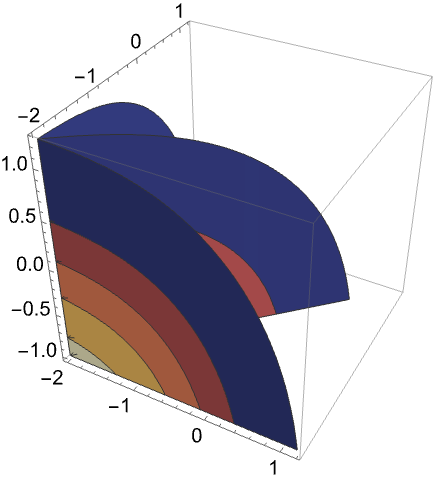
绘制某分布的 CDF:
https://wolfram.com/xid/0tp1gh65gqu1tk-nxzhru
https://wolfram.com/xid/0tp1gh65gqu1tk-yt2zy
https://wolfram.com/xid/0tp1gh65gqu1tk-edamg1
https://wolfram.com/xid/0tp1gh65gqu1tk-qx27e1
https://wolfram.com/xid/0tp1gh65gqu1tk-cexal0
https://wolfram.com/xid/0tp1gh65gqu1tk-n33x61
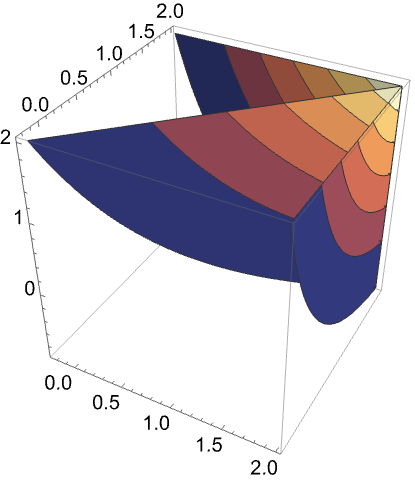
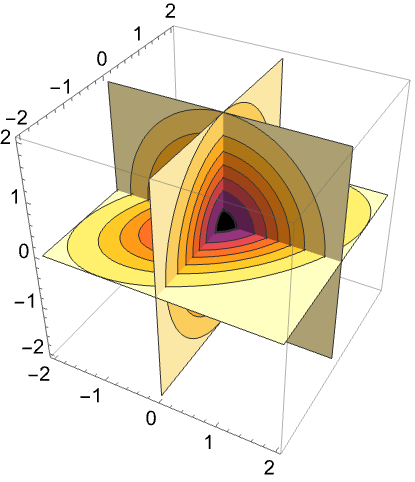
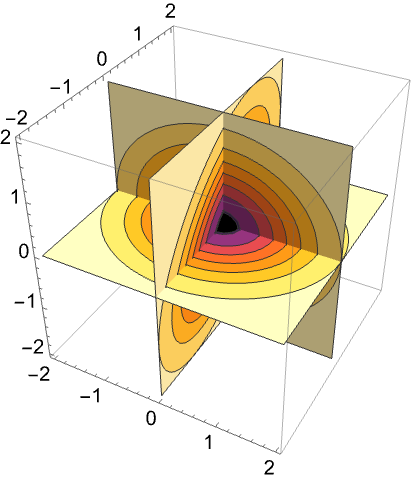
找出 MultinormalDistribution 的 Correlation 参数,其中 ρab 是 a 和 b 之间的相关系数:
https://wolfram.com/xid/0tp1gh65gqu1tk-ebuscf
https://wolfram.com/xid/0tp1gh65gqu1tk-cjos6v
https://wolfram.com/xid/0tp1gh65gqu1tk-ddnesr
https://wolfram.com/xid/0tp1gh65gqu1tk-c1wejj
https://wolfram.com/xid/0tp1gh65gqu1tk-cime7c
https://wolfram.com/xid/0tp1gh65gqu1tk-f3rc7e
https://wolfram.com/xid/0tp1gh65gqu1tk-eqsrfd
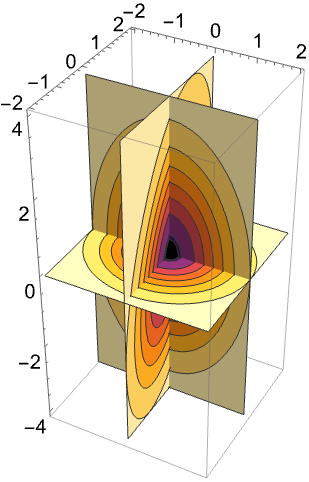
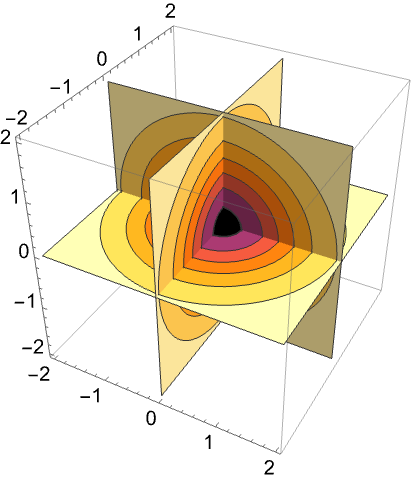
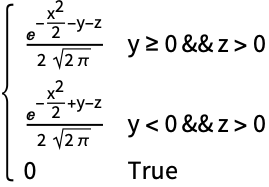
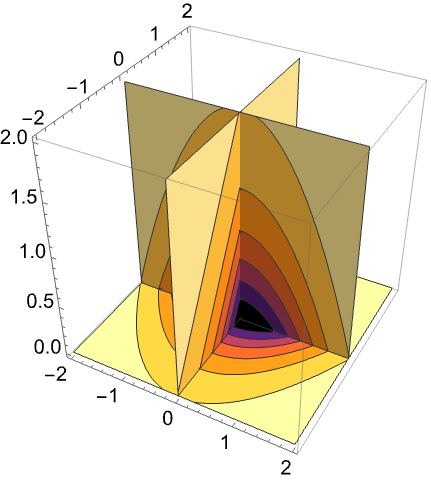
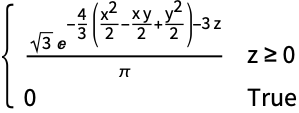
可视化一个 ProductDistribution 的 PDF:
https://wolfram.com/xid/0tp1gh65gqu1tk-kiukzo
https://wolfram.com/xid/0tp1gh65gqu1tk-5jjcws

https://wolfram.com/xid/0tp1gh65gqu1tk-d59pdt

https://wolfram.com/xid/0tp1gh65gqu1tk-occsfc
https://wolfram.com/xid/0tp1gh65gqu1tk-grjaas
https://wolfram.com/xid/0tp1gh65gqu1tk-cffc9p
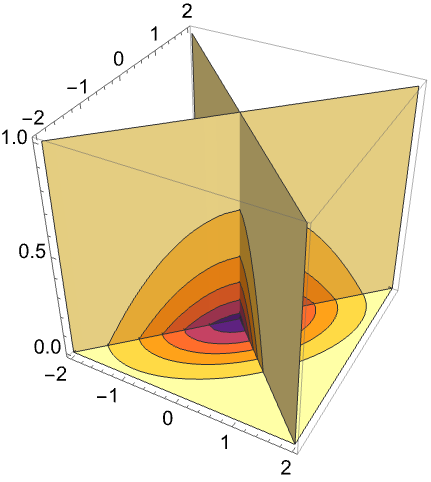
绘制 CopulaDistribution 的概率密度函数(pdf):

https://wolfram.com/xid/0tp1gh65gqu1tk-jkj62p

https://wolfram.com/xid/0tp1gh65gqu1tk-e6pr6h
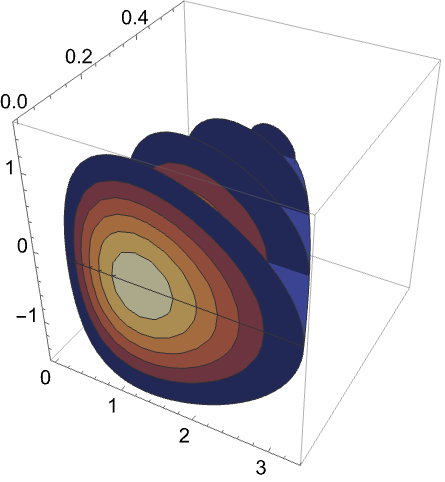
可视化某三元分布数据核密度估计的 PDF:
https://wolfram.com/xid/0tp1gh65gqu1tk-bw70il
https://wolfram.com/xid/0tp1gh65gqu1tk-czjlu4
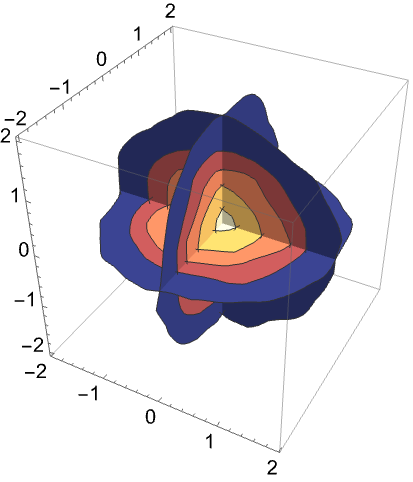
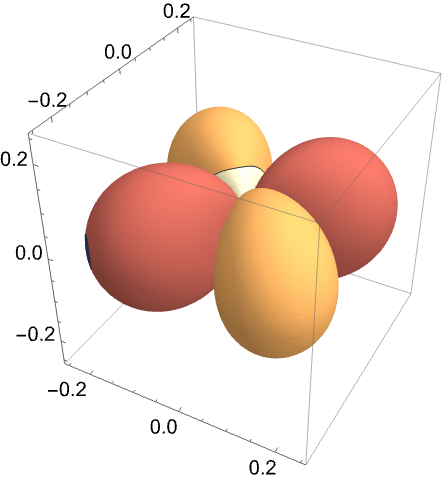
势函数和波函数 (4)

https://wolfram.com/xid/0tp1gh65gqu1tk-etkey6
https://wolfram.com/xid/0tp1gh65gqu1tk-3d0i0n

https://wolfram.com/xid/0tp1gh65gqu1tk-47h6ws
https://wolfram.com/xid/0tp1gh65gqu1tk-nt1afr

https://wolfram.com/xid/0tp1gh65gqu1tk-gypc0b
https://wolfram.com/xid/0tp1gh65gqu1tk-sl8x2o

https://wolfram.com/xid/0tp1gh65gqu1tk-csopkl

https://wolfram.com/xid/0tp1gh65gqu1tk-mfxobq

https://wolfram.com/xid/0tp1gh65gqu1tk-mqewd6
https://wolfram.com/xid/0tp1gh65gqu1tk-uu22nj
https://wolfram.com/xid/0tp1gh65gqu1tk-bcu9xj

https://wolfram.com/xid/0tp1gh65gqu1tk-gyax69
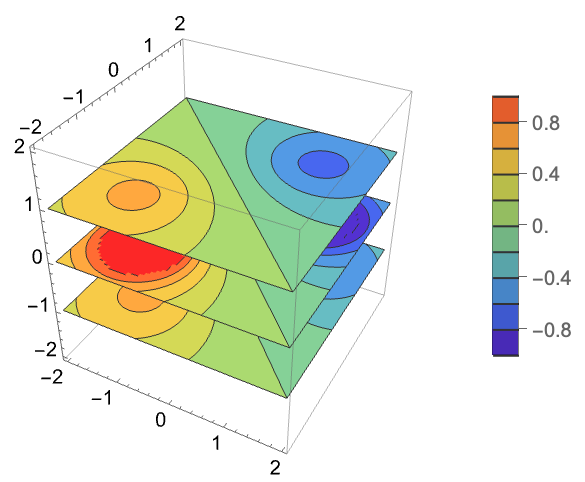

https://wolfram.com/xid/0tp1gh65gqu1tk-kr4jq4
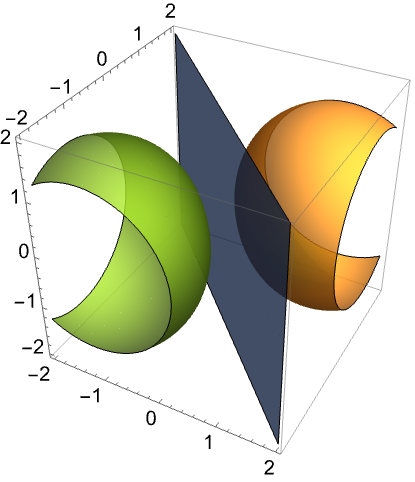
https://wolfram.com/xid/0tp1gh65gqu1tk-jsa59j
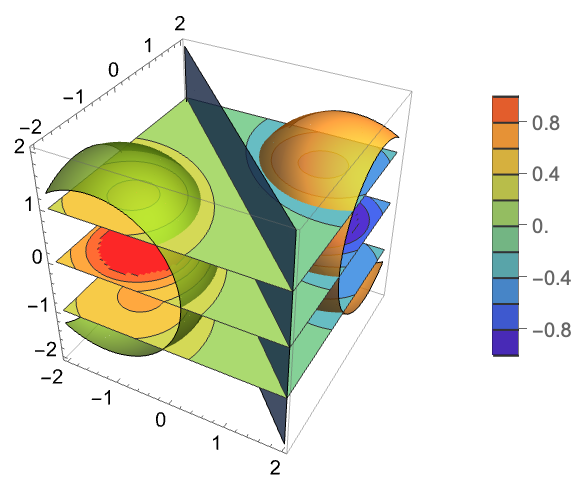
偏微分方程 (3)
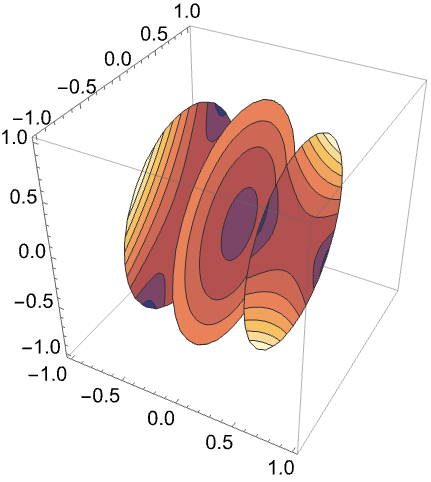
使用周期性边界条件(periodic boundary conditions)在两个空间维度中可视化一个非线性的 sine-Gordon 方程,z 轴表示时间:

https://wolfram.com/xid/0tp1gh65gqu1tk-3imqic
https://wolfram.com/xid/0tp1gh65gqu1tk-o5fvxw
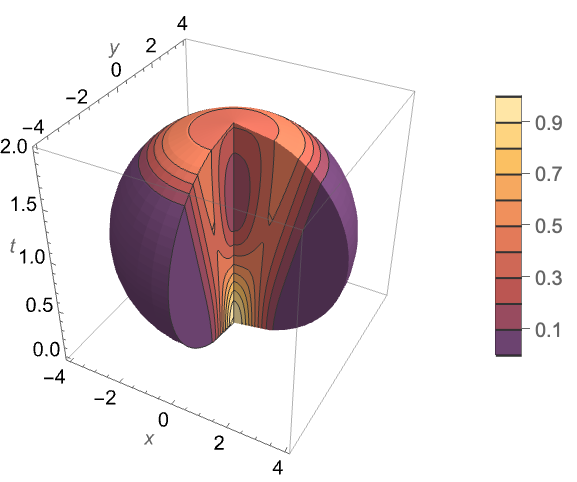
在两个空间维度中可视化 Wolfram 的非线性波动方程,z 轴表示时间:

https://wolfram.com/xid/0tp1gh65gqu1tk-fkj
https://wolfram.com/xid/0tp1gh65gqu1tk-s7i4od
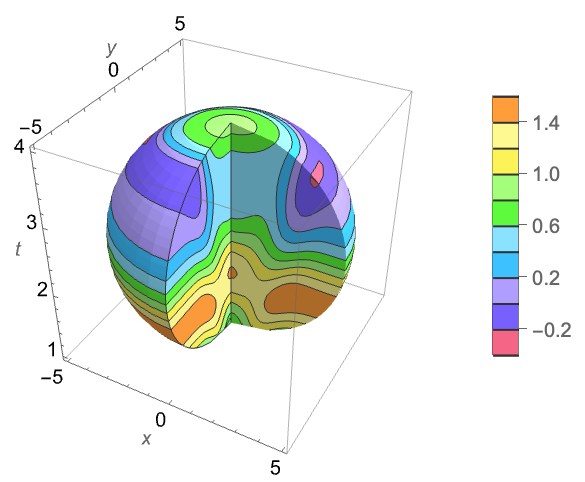
可视化三维偏微分方程的解. 在此例中,为一个 Ball 上的泊松方程(Poisson equation)和狄利克雷边界条件(Dirichlet boundary conditions):
https://wolfram.com/xid/0tp1gh65gqu1tk-yfl4db
https://wolfram.com/xid/0tp1gh65gqu1tk-4pd8oc
属性和关系 (5)函数的属性及与其他函数的关联
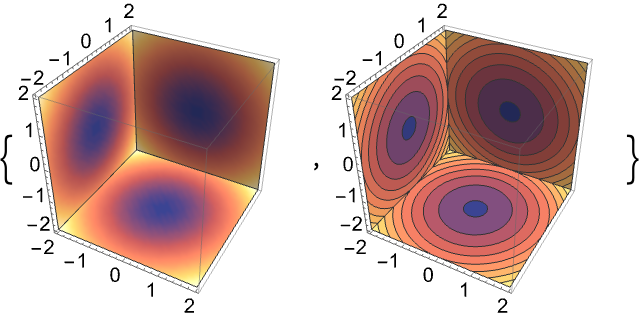
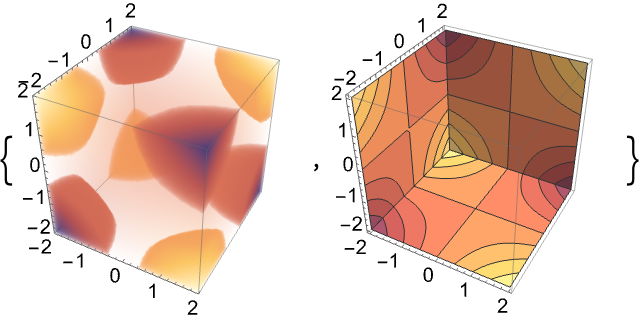
用 SliceDensityPlot3D 在曲面上绘制连续密度图:
https://wolfram.com/xid/0tp1gh65gqu1tk-y3eawx
用 ContourPlot3D 来绘制数值为常数的曲面:
https://wolfram.com/xid/0tp1gh65gqu1tk-4gfzgs
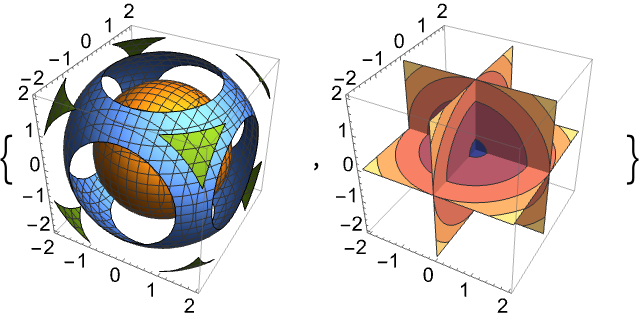
用 DensityPlot3D 来呈现数值的整体可视化:
https://wolfram.com/xid/0tp1gh65gqu1tk-4kw5kb
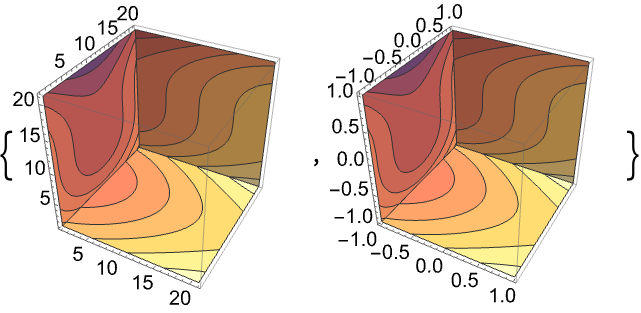
对数据使用 ListSliceContourPlot3D:
https://wolfram.com/xid/0tp1gh65gqu1tk-ywzg95
https://wolfram.com/xid/0tp1gh65gqu1tk-3v60u6
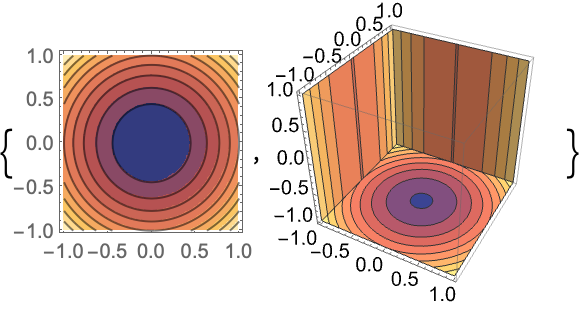
用 ContourPlot 得到二维等高线图:
https://wolfram.com/xid/0tp1gh65gqu1tk-z3puov
Wolfram Research (2015),SliceContourPlot3D,Wolfram 语言函数,https://reference.wolfram.com/language/ref/SliceContourPlot3D.html (更新于 2022 年).文本
Wolfram Research (2015),SliceContourPlot3D,Wolfram 语言函数,https://reference.wolfram.com/language/ref/SliceContourPlot3D.html (更新于 2022 年).
Wolfram Research (2015),SliceContourPlot3D,Wolfram 语言函数,https://reference.wolfram.com/language/ref/SliceContourPlot3D.html (更新于 2022 年).CMS
Wolfram 语言. 2015. "SliceContourPlot3D." Wolfram 语言与系统参考资料中心. Wolfram Research. 最新版本 2022. https://reference.wolfram.com/language/ref/SliceContourPlot3D.html.
Wolfram 语言. 2015. "SliceContourPlot3D." Wolfram 语言与系统参考资料中心. Wolfram Research. 最新版本 2022. https://reference.wolfram.com/language/ref/SliceContourPlot3D.html.APA
Wolfram 语言. (2015). SliceContourPlot3D. Wolfram 语言与系统参考资料中心. 追溯自 https://reference.wolfram.com/language/ref/SliceContourPlot3D.html 年
Wolfram 语言. (2015). SliceContourPlot3D. Wolfram 语言与系统参考资料中心. 追溯自 https://reference.wolfram.com/language/ref/SliceContourPlot3D.html 年BibTeX
@misc{reference.wolfram_2025_slicecontourplot3d, author="Wolfram Research", title="{SliceContourPlot3D}", year="2022", howpublished="\url{https://reference.wolfram.com/language/ref/SliceContourPlot3D.html}", note=[Accessed: 01-April-2025
]}
BibLaTeX
@online{reference.wolfram_2025_slicecontourplot3d, organization={Wolfram Research}, title={SliceContourPlot3D}, year={2022}, url={https://reference.wolfram.com/language/ref/SliceContourPlot3D.html}, note=[Accessed: 01-April-2025
]}


