ArrayPlot3D[array]
生成一个数组中的数值都显示在方块的离散数组中的图.
ArrayPlot3D
ArrayPlot3D[array]
生成一个数组中的数值都显示在方块的离散数组中的图.
更多信息和选项
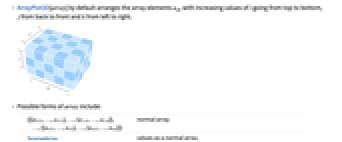
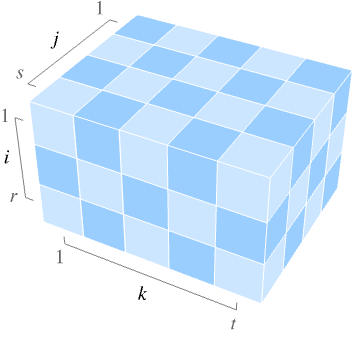
- ArrayPlot3D[array] 默认情况下对数组元素 aijk 进行排列,采取 i 的值从上到下,j 的值从后到前,k 的值从左到右逐渐增大.
- array 的可能形式包括:
-
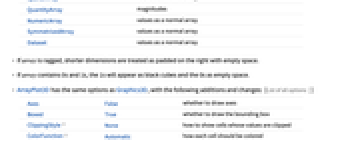
{{{a111,…,a11t},…,{a1s1,…,a1st}},…,{{ar11,…,ar1t},…,{ars1,…,arst}}} 正态数组 SparseArray 像正态数组的值 QuantityArray 大小 NumericArray 像正态数组的值 SymmetrizedArray 像正态数组的值 Dataset 像正态数组的值 - 若 array 长短不一,则较短维度的数组会被看成是右边填充了空白空间.
- 若 array 包含 0 和 1,则 1 会显示成黑色方块,而 0 会显示成空白空间.
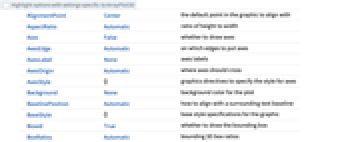
- ArrayPlot3D 与 Graphics3D 的选项一样,有下列添加和变化: [所有选项的列表]
-
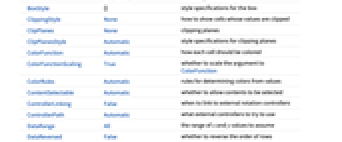
Axes False 是否绘制轴 Boxed True 是否绘制边框 ClippingStyle None 如何显示有裁剪值的单元格 ColorFunction Automatic 如何对每个单元格上色 ColorFunctionScaling True 如何将参数比例适配到 ColorFunction ColorRules Automatic 用值来决定颜色的规则 DataRange All 假设的
和
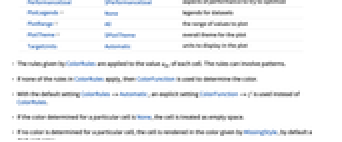
的值域DataReversed False 是否对行的顺序倒序排列 Lighting "Neutral" 是否使用光照 Mesh Automatic 是否绘制网格 MeshStyle Automatic 网格使用的样式 Method Automatic 使用的显示数组的方法 MissingStyle Automatic 对缺失值使用的样式 OpacityFunction Automatic 如何在每个单元格计算透明度 OpacityFunctionScaling True 如何将参数适配比例到 OpacityFunction PerformanceGoal $PerformanceGoal 尝试最优化的表现因素 PlotLegends None 数据组的图例 PlotRange All 绘制值的值域 PlotTheme $PlotTheme 绘图的总体主题 TargetUnits Automatic 绘图中显示的单位 - ColorRules 给出的规则应用到每个单元格的 aijk 值. 规则可以包括模式.
- 如果没有应用任何 ColorRules 里的规则,则 ColorFunction 会用于决定颜色.
- 默认设置是 ColorRules->Automatic,则意味着会具体设置 ColorFunction->f 而不仅仅是 ColorRules.
- 如果某个特定单元格的颜色为 None,则这个单元格会被当做空白空间.
- 如果未决定特定单元格的颜色,则该单元格的颜色会根据 MissingStyle 给出的颜色进行渲染,默认情况下是深红色.
- ColorFunction 和 OpacityFunction 都是用单个参数,默认情况下是根据 aijk 的值等比例变为 0 到 1 之间的数值.
- 设置 DataReversed->True 后,行的排序变为倒序,这样行由底到顶排序,最后一行在最上面.
- 设置 TicksAutomatic,刻度位置在四舍五入的整数位置,通常为 5 或 10 的倍数.
- 设置 TicksAll,刻度会在 i、j 和 k 的最小值和最大值处.
- 在明确的 Ticks 说明内,刻度坐标指的是 i、j 和 k.
- PlotRange 可以用以下形式:
-
amax 将 aijk 的值显示为 0 到 amax {amin,amax} 将 aijk 的值显示为 amin 到 amax {rangei,rangej,rangek} 将带有 i 的 aijk 值显示在 rangei, … 范围内 {rangei,rangej,rangek,rangea} 将带有 i 的 aijk 值显示在 rangei, … 范围内,且 aijk 值在 rangea 范围内 - 数组指数范围 rangei、rangej 和 rangek 可以有如下形式:
-
{min,max} 包括 min 到 max 之间的指数 All 包括所有指数 - PlotLegends 的一般设置包括:
-
None 没有图例 Automatic 自动决定图例 Placed[lspec,…] 指定图例的位置 - Mesh 的可能设置包括:
-
Automatic 自动显示网格 None 不显示网格 Full 显示填满数组单元格周边的网格 All 显示所有数组单元格周边的网格 {speci,specj,speck} 显示特定维度的网格 - Method 的可能设置包括 "Graphics3D"、"Raster3D" 和 "ArrayMesh".
所有选项的列表
范例
打开所有单元 关闭所有单元基本范例 (4)
d = RandomInteger[1, {5, 5, 5}];ArrayPlot3D[d]ArrayPlot3D[CellularAutomaton[
<|"GrowthCases" -> {1}, "Dimension" -> 3, "Neighborhood" -> 7|>, {{{{1}}}, 0}, {{{5}}}]]ArrayPlot3D[RandomInteger[2, {5, 5, 5}], ColorRules -> {1 -> Yellow, 2 -> Orange}]d = RandomReal[5, {5, 5, 5}];ArrayPlot3D[d, ColorFunction -> "Rainbow"]范围 (6)
ArrayPlot3D[RandomInteger[1, {5, 5, 5}]]ArrayPlot3D[RandomInteger[1, {5, 5, 5}], OpacityFunction -> None]ArrayPlot3D[QuantityArray[RandomInteger[1, {5, 5, 5}], "Meters"], AxesLabel -> Automatic, Axes -> True]ArrayPlot3D[{{{1}, {1, 1}, {1, 0, 1}, {1, 1, 1, 1}},
{{1}, {1, 1}, {1, 0, 1}, {1, 1, 1, 1}},
{{1}, {1, 1}, {1, 0, 1}, {1, 1, 1, 1}},
{{1}, {1, 1}, {1, 0, 1}, {1, 1, 1, 1}}}]带有 None 的单元格会被渲染成背景颜色:
ArrayPlot3D[Table[If[x == y, None, 1 / (x - y)], {x, -2, 2}, {y, -2, 2}, {z, -2, 2}]]ArrayPlot3D[SparseArray[{{x_, x_, x_} -> 1, ({x_, y_, z_} /; Abs[x - y + z] < 3) -> .5}, {10, 10, 10}]]选项 (32)
AspectRatio (2)
ArrayPlot3D[CellularAutomaton[{14, {2, 1}, {1, 1}}, {{{1}}, 0}, 10], AspectRatio -> 1]ArrayPlot3D[CellularAutomaton[{14, {2, 1}, {1, 1}}, {{{1}}, 0}, 10], AspectRatio -> 1 / 2]默认情况下,ArrayPlot3D 不显示坐标轴:
ArrayPlot3D[IconizedObject[«data»]]AxesLabel (3)
ArrayPlot3D[IconizedObject[«data»], Axes -> True]ArrayPlot3D[IconizedObject[«data»], Axes -> True, AxesLabel -> "z"]ArrayPlot3D[IconizedObject[«data»], Axes -> True, AxesLabel -> {"k", "j", "i"}]AxesStyle (4)
ArrayPlot3D[IconizedObject[«data»], Axes -> True, AxesStyle -> Red]ArrayPlot3D[IconizedObject[«data»], Axes -> True, AxesStyle -> {Directive[{Thick, RGBColor[0.6, 0.4, 0.2]}],
Directive[{Thick, RGBColor[0, 0, 1]}],
Directive[{Thick, RGBColor[0, 1, 0]}]}]ArrayPlot3D[IconizedObject[«data»], Axes -> True, AxesStyle -> Red, TicksStyle -> Green]ArrayPlot3D[IconizedObject[«data»], Axes -> True, AxesStyle -> Red, LabelStyle -> Green]ClippingStyle (1)
d = RandomReal[5, {5, 5, 5}];ArrayPlot3D[d, PlotRange -> {1, 4}]ArrayPlot3D[d, PlotRange -> {1, 4}, ClippingStyle -> Red]ArrayPlot3D[d, PlotRange -> {1, 4}, ClippingStyle -> {Gray, Green}]ColorFunction (2)
根据 Hue,将从 0 到 1 的值映射到颜色:
d = RandomReal[5, {5, 5, 5}];ArrayPlot3D[d, ColorFunction -> Hue]ArrayPlot3D[d, ColorFunction -> (Hue[# ^ 4 / 2]&)]使用 ColorData 中的一个有名称的颜色渐变:
ArrayPlot3D[d, ColorFunction -> "Pastel"]ArrayPlot3D[RandomInteger[1, {5, 5, 5}], ColorFunction -> (If[# == 1, Black, White]&), ColorFunctionScaling -> False, OpacityFunction -> None]ColorFunctionScaling (1)
设置 ColorFunctionScaling->True,值会被缩放为 0 到 1之间:
d = RandomInteger[5, {5, 5, 5}];ArrayPlot3D[d, ColorFunction -> Hue, ColorFunctionScaling -> True]ColorRules (1)
d = RandomInteger[{-5, 5}, {5, 5, 5}];ArrayPlot3D[d, ColorRules -> {1 -> Red, 2 -> Blue, 3 -> Yellow, _ -> Gray}]如果没有颜色规则可应用,则会使用ColorFunction:
ArrayPlot3D[d, ColorRules -> {1 -> Red}]ArrayPlot3D[d, ColorRules -> {1 -> Blue, 0 -> Green, _ -> Gray}, OpacityFunction -> None]在 ColorRules 中使用任意模式:
ArrayPlot3D[d, ColorRules -> {_ ? EvenQ -> Red, 1 | -1 -> Blue, x_ /; x < -1 -> Gray}]ArrayPlot3D[d, ColorRules -> {1 -> Red, 0 -> Blue, 1 -> Gray}]DataRange (1)
DataReversed (1)
Mesh (1)
MeshStyle (1)
OpacityFunction (4)
OpacityFunction 默认情况下为 Automatic:
data = Table[Sin[π x]Sin[π (y + z)], {z, -2, 2, .25}, {y, -2, 2, .25}, {x, -2, 2, .25}];ArrayPlot3D[data]使用 None 可使所有数组变为不透明:
data = Table[Sin[π x]Sin[π (y + z)], {z, -2, 2, .25}, {y, -2, 2, .25}, {x, -2, 2, .25}];ArrayPlot3D[data, OpacityFunction -> None]data = Table[Sin[π x]Sin[π (y + z)], {z, -2, 2, 0.25}, {y, -2, 2, 0.25}, {x, -2, 2, 0.25}];ArrayPlot3D[data, OpacityFunction -> (If[# < 0.4, 1, 0.25]&), Mesh -> None]使用恒定不透明值 Opacity[0.5]:
data = Table[Sin[π x]Sin[π y] Sin[π z], {z, -2, 2, .5}, {y, -2, 2, .5}, {x, -2, 2, .5}];ArrayPlot3D[data, OpacityFunction -> 0.5, PlotLegends -> Automatic]OpacityFunctionScaling (2)
data = Table[x y z, {z, -5, 5}, {y, -5, 5}, {x, -5, 5}];ArrayPlot3D[data, OpacityFunction -> Function[f, If[f > 0, 1, 0]]]通过将 OpacityFunctionScaling 设定为 False 可使用未经缩放的值:
data = Table[x y z, {z, -5, 5}, {y, -5, 5}, {x, -5, 5}];ArrayPlot3D[data, OpacityFunction -> Function[f, If[f > 0, 1, 0.25]], OpacityFunctionScaling -> False]PlotLegends (2)
d = RandomInteger[2, {3, 3, 3}];ArrayPlot3D[d]ArrayPlot3D[d, PlotLegends -> Automatic]PlotLegends 自动获取 ColorFunction:
Table[ArrayPlot3D[RandomInteger[2, {10, 20, 10}], ColorFunction -> cf, PlotLegends -> Placed[Automatic, Below], ImageSize -> 100, OpacityFunction -> None], {cf, {"Pastel", GrayLevel}}]PlotRange (2)
d = RandomInteger[5, {5, 5, 5}];ArrayPlot3D[d]ArrayPlot3D[d, PlotRange -> {0, 3}]PlotRange 中的前三个输入指定了要包含的 i、j 和 k 值:
ArrayPlot3D[d, PlotRange -> {{2, 5}, {1, 3}, {3, 5}}]ArrayPlot3D[RandomInteger[{-10, 10}, {10, 20, 10}], PlotRange -> {All, All, All, {0, All}}]PlotTheme (1)
Ticks (2)
d = RandomInteger[5, {5, 5, 5}];ArrayPlot3D[d, Axes -> True, Ticks -> Automatic]d = RandomInteger[5, {20, 20, 20}];ArrayPlot3D[d, Ticks -> {{1, 5, 10, 15}, {6, 12, 18}, {3, 7, 9, 13}}, Axes -> True]应用 (6)
元胞自动机 (2)
数组结构 (4)
array = ConstantArray[1, {3, 4, 5}];array[[1, 4, 5]] = 2;ArrayPlot3D[array]array = ConstantArray[1, {3, 4, 5}];array[[All, 4, 5]] = 2;ArrayPlot3D[array]array = ConstantArray[1, {3, 4, 5}];array[[All, All, 4]] = 2;ArrayPlot3D[array]array = ConstantArray[1, {3, 4, 5}];array[[1 ;; 2, 2 ;; 4, 3 ;; 5]] = 2;ArrayPlot3D[array]属性和关系 (6)
在二维数组上使用 ArrayPlot 或 MatrixPlot:
{ArrayPlot[{{0, 0, 1, 0}, {0, 1, 1, 0}, {1, 0, 0, 1}}], MatrixPlot[{{0, 0, 1, 0}, {0, 1, 1, 0}, {1, 0, 0, 1}}]}ArrayPlot3D 使用三维数组,即使其中一个维度的值为 1:
ArrayPlot3D[{{{0, 0, 1, 0}, {0, 1, 1, 0}, {1, 0, 0, 1}}}]Raster3D 以 ArrayPlot3D 中相反的顺序排列元素:
{ArrayPlot3D[{{{0, 1}, {2, 3}}, {{4, 5}, {6, 7}}}, ColorFunction -> "Rainbow", OpacityFunction -> None], Graphics3D[Raster3D[{{{0, 1}, {2, 3}}, {{4, 5}, {6, 7}}} / 7, ColorFunction -> "Rainbow"]]}DataReversed 选项允许 ArrayPlot3D 使用与 Raster3D 相同的顺序:
ArrayPlot3D[{{{0, 1}, {2, 3}}, {{4, 5}, {6, 7}}}, ColorFunction -> "Rainbow", OpacityFunction -> None, DataReversed -> {True, True, False}]使用 ListDensityPlot3D 可设置连续密度,用变化的不透明度看内部特性:
data = Table[x + Sin[3z + y ^ 2], {z, -3, 3, 0.25}, {y, -3, 3, 0.25}, {x, -3, 3, 0.25}];{ListDensityPlot3D[data, ColorFunction -> "SunsetColors"], ArrayPlot3D[data, ColorFunction -> "SunsetColors"]}Image3D 使用插值容积式渲染模式显示数据:
ca = CellularAutomaton[
<|"GrowthCases" -> {1}, "Dimension" -> 3, "Neighborhood" -> 7|>, {{{{1}}}, 0}, {{{5}}}];{Image3D[ca], ArrayPlot3D[ca]}ReliefPlot 为二维数据创建人工阴影:
ReliefPlot[Import["http://exampledata.wolfram.com/hailey.dem.gz", "Data"], ColorFunction -> "GreenBrownTerrain", MaxPlotPoints -> 100]ComplexArrayPlot 用于二维复数数据数组:
ComplexArrayPlot[RandomComplex[{-1 - I, 1 + I}, {25, 50}]]巧妙范例 (3)
在整数点绘制 Sin 函数:
ArrayPlot3D[Table[Sin[x y z], {x, -5, 5}, {y, -5, 5}, {z, -5, 5}]]Manipulate[ArrayPlot3D[CellularAutomaton[{rn, {2, 1}, {1, 1, 1}}, {{{Table[1, init]}}, 0}, {{{t}}}]], {{rn, 14, "rule number"}, 2, 200, 4, Appearance -> "Labeled"},
{{t, 5, "steps"}, 0, 15, 1, Appearance -> "Labeled"},
{{init, 1, "initial width"}, 1, 10, 1, Appearance -> "Labeled"}, Delimiter,
{{pr, False, ""}, {True -> "fixed view", False -> "zoom to fit"}},
AutorunSequencing -> {{1, 20}, {2, 15}, {3, 10}, {4, 5}}]用 Hue 将 GCD 值交互式地映射成不同的颜色:
Manipulate[ArrayPlot3D[Array[GCD, {10, 10, 10}], ColorFunction -> (Hue[Mod[# + a, 1]]&), ColorFunctionScaling -> True], {a, 0, 1}]相关指南
-
▪
- 数据可视化
文本
Wolfram Research (2020),ArrayPlot3D,Wolfram 语言函数,https://reference.wolfram.com/language/ref/ArrayPlot3D.html.
CMS
Wolfram 语言. 2020. "ArrayPlot3D." Wolfram 语言与系统参考资料中心. Wolfram Research. https://reference.wolfram.com/language/ref/ArrayPlot3D.html.
APA
Wolfram 语言. (2020). ArrayPlot3D. Wolfram 语言与系统参考资料中心. 追溯自 https://reference.wolfram.com/language/ref/ArrayPlot3D.html 年
BibTeX
@misc{reference.wolfram_2026_arrayplot3d, author="Wolfram Research", title="{ArrayPlot3D}", year="2020", howpublished="\url{https://reference.wolfram.com/language/ref/ArrayPlot3D.html}", note=[Accessed: 12-August-2026]}
BibLaTeX
@online{reference.wolfram_2026_arrayplot3d, organization={Wolfram Research}, title={ArrayPlot3D}, year={2020}, url={https://reference.wolfram.com/language/ref/ArrayPlot3D.html}, note=[Accessed: 12-August-2026]}