



ListVectorPlot3D
ListVectorPlot3D[varr]
ベクトル場の値の3D配列から3Dベクトルプロットを生成する.
ListVectorPlot3D[{data1,data2,…}]
複数のベクトル場のデータをプロットする.
詳細とオプション
- ListVectorPlot3Dは,3D場のプロットおよび3D方向プロットとしても知られている.
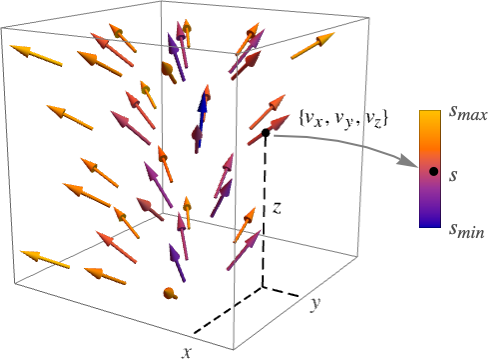
- ListVectorPlot3Dは,固定長に正規化された矢印を描くことでベクトル場
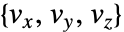 を表示する.矢印は,デフォルトで,ベクトル場の強度
 に従って彩色される.
- ベクトル場
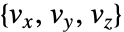 は
 で値 varr〚i,j,k〛を持つ.
- ListVectorPlot3Dはデフォルトで与えられたデータを補間し,3D構造格子の位置でベクトル場のベクトルをプロットする.
- ListVectorPlot3Dには,Graphics3Dと同じオプションに次の追加・変更を加えたものが使える. [全オプションのリスト]
-
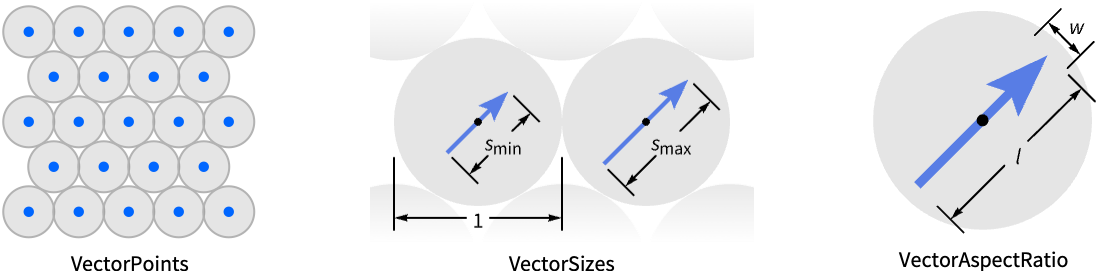
BoxRatios Automatic 縦横比 ClippingStyle Automatic ベクトル範囲外の矢印の表示方法 DataRange Automatic データとして仮定し得る x, y, z の値の範囲 Method Automatic プロットに使用するメソッド PerformanceGoal $PerformanceGoal パフォーマンスのどの面について最適化するか PlotLegends None 含める凡例 PlotRange {Full,Full,Full} 含める x, y, z 値の範囲 PlotRangePadding Automatic 値の範囲をどの程度充填するか PlotTheme $PlotTheme 全体的なプロットのテーマ RegionBoundaryStyle Automatic プロット領域の境界のスタイルの付け方 RegionFunction (True&) 含める範囲を決定する ScalingFunctions None 個々の座標のスケール方法 VectorAspectRatio Automatic 矢印の縦横比 VectorColorFunction Automatic ベクトルの彩色方法 VectorColorFunctionScaling True VectorColorFunctionの引数をスケールするかどうか VectorPoints Automatic プロットするベクトル位置の数 VectorRange Automatic 表示するベクトル長の範囲 VectorScaling None 矢印のサイズをどのようにスケールするか VectorSizes Automatic 表示された矢印のサイズ VectorStyle Automatic ベクトルの描画方法 - VectorPointsAllの設定のとき,ListVectorPlot3Dは,代りに,与えられた特定のベクトル場のデータ点に関連付けられたベクトルを表示する.
- 個々の矢印は各点の周りの境界球内に収まるようにスケールされる.
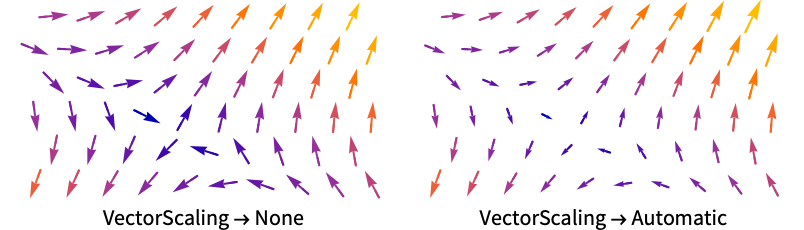
- VectorScalingはベクトルの大きさを,VectorSizesで与えられる sminから smaxまでの矢印サイズの範囲にスケールする.
- VectorScalingAutomaticは,ベクトルの大きさによって矢印の長さをスケールする.
- 次は,よく使われるマーカーである.
-

"Arrow3D" 3Dの矢印の形をしたマーカー 
"Arrow" 2Dの矢印の形をしたマーカー 
"Tube" 場の方向に沿ったチューブ片のマーカー 
"Segment" 場の方向に沿った線分 - VectorColorFunctionNoneとすると,矢印はVectorStyleで指定されたスタイルで描画される.
- RegionFunctionとVectorColorFunction内の関数に渡される引数は x, y, z, vx, vy, vz, Norm[{vx,vy,vz}]である.
- 次は,ScalingFunctionsの可能な設定である.
-
{sx,sy,sz} x,y,z の各軸をスケールする - 次は,よく使われる組込みのスケーリング関数 s である.
-
"Log" 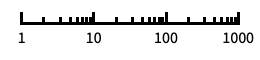
自動目盛ラベル付きの対数スケール "Log10" 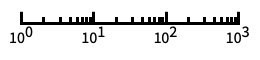
10のベキ乗に目盛が付いた,10を底とする対数スケール "SignedLog" 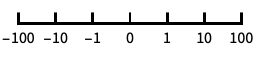
0と負の数を含む対数に似たスケール "Reverse" 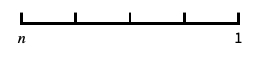
座標の向きを逆にする "Infinite" 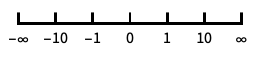
無限スケール
全オプションのリスト
例題
すべて開く すべて閉じる例 (4)
指定されたベクトル集合で補間されたベクトル場をプロットする:
ListVectorPlot3D[Table[{x, y, z}, {x, -1, 1, .1}, {y, -1, 1, .1}, {z, -1, 1, .1}]]座標とベクトルを指定するデータからベクトル場をプロットする:
vectors = Table[{{x, y, z}, {y, x - x ^ 3, z}}, {x, -1.5, 1.5, 0.2}, {y, -2, 2, 0.2}, {z, -1, 1, 0.1}];ListVectorPlot3D[vectors]ListVectorPlot3D[Table[{x, y, z}, {x, -1, 1, .1}, {y, -1, 1, .1}, {z, -1, 1, .1}], PlotLegends -> Automatic]ListVectorPlot3D[Table[{x, y, z}, {x, -1, 1, .1}, {y, -1, 1, .1}, {z, -1, 1, .1}], VectorMarkers -> "Tube"]スコープ (15)
サンプリング (6)
data = Table[{y, -x, z}, {x, -1, 1, 0.25}, {y, -1, 1, 0.25}, {z, -1, 1, 0.5}];ListVectorPlot3D[data, DataRange -> {{-1, 1}, {-1, 1}, {-1, 1}}]ListVectorPlot3D[data, VectorPoints -> {4, 6, 8}]data1 = Table[{x, y, z}, {x, -1, 1, .2}, {y, -1, 1, .2}, {z, -1, 1, .2}];
data2 = Table[{y, x, z}, {x, -2, 2, .2}, {y, -1, 1, .2}, {z, -1, 1, .2}];ListVectorPlot3D[{data1, data2}]data = Table[{x, y, z}, {x, -1, 1, .1}, {y, -1, 1, .1}, {z, -1, 1, .1}];ListVectorPlot3D[data, DataRange -> {{-1, 1}, {-1, 1}, {-1, 1}}, RegionFunction -> ((#1 #2 #3 > 0)&)]data = Table[{y, x - x ^ 3, z}, {x, -1.5, 1.5, 0.2}, {y, -2, 2, 0.2}, {z, -1, 1, 0.1}];Table[ListVectorPlot3D[data, PlotLabel -> k, VectorPoints -> k], {k, {Fine, Automatic, 5, {4, 6, 8}}}]data = Table[{y, -x, z}, {x, -1, 1, 0.25}, {y, -1, 1, 0.25}, {z, -1, 1, 0.5}];ListVectorPlot3D[data, DataRange -> {{-1, 1}, {-1, 1}, {-1, 1}}, VectorPoints -> RandomReal[{-1, 1}, {300, 3}]]data = Table[{x, y + 1, z + 2}, {x, -1, 1, .1}, {y, -1, 1, .1}, {z, -1, 1, .1}];points = {{-1, -1, -1}, {-1, 1, 1}, {0, 0, 0}, {1, -1, -1}, {1, 1, 1}};ListVectorPlot3D[data, DataRange -> {{-1, 1}, {-1, 1}, {-1, 1}}, VectorPoints -> points]プレゼンテーション (9)
大きさでスケールされた矢印を使ってベクトル場をプロットする:
ListVectorPlot3D[Table[{y, -x, z ^ 2}, {x, -1, 1, .1}, {y, -1, 1, .1}, {z, -1, 1, .1}], VectorScaling -> Automatic]ListVectorPlot3D[Table[{y, -x, z ^ 2}, {x, -1, 1, .1}, {y, -1, 1, .1}, {z, -1, 1, .1}], VectorColorFunction -> None]data = Table[{y, -x, z}, {x, -1, 1, .1}, {y, -1, 1, .1}, {z, -1, 1, .1}];ListVectorPlot3D[data, PlotRange -> All, VectorPoints -> 5, VectorColorFunction -> "Rainbow", VectorStyle -> "Arrow3D"]data = Table[{y, -x, z}, {x, -1, 1, .1}, {y, -1, 1, .1}, {z, -1, 1, .1}];
points = RandomReal[{-1, 1}, {500, 3}];ListVectorPlot3D[data, DataRange -> {{-1, 1}, {-1, 1}, {-1, 1}}, VectorPoints -> points, PlotRange -> All, VectorColorFunction -> Hue]data = Table[{x, y, z}, {x, -1, 1, .1}, {y, -1, 1, .1}, {z, -1, 1, .1}];Table[ListVectorPlot3D[data, DataRange -> {{-1, 1}, {-1, 1}, {-1, 1}}, VectorPoints -> 5, VectorSizes -> s, PlotLabel -> s], {s, {Small, Large, 0.5, Automatic}}]data = Table[{x, y, z}, {x, -1, 1, .1}, {y, -1, 1, .1}, {z, -1, 1, .1}];Table[ListVectorPlot3D[data, DataRange -> {{-1, 1}, {-1, 1}, {-1, 1}}, VectorPoints -> 6, VectorAspectRatio -> s, PlotLabel -> s], {s, {0.1, 0.2}}]ListVectorPlot3D[{Table[{x, y, z}, {x, -1, 1, .2}, {y, -1, 1, .2}, {z, -1, 1, .2}], Table[{-x, y, z}, {x, -2, 2, .2}, {y, -1, 1, .2}, {z, -1, 1, .2}]}, VectorPoints -> 5, PlotLegends -> Automatic, VectorColorFunction -> None]ListVectorPlot3D[Table[{x, y ^ 2, z - y}, {x, -1, 1, .1}, {y, -1, 1, .1}, {z, -1, 1, .1}], PlotTheme -> "Marketing"]ListStreamPlot3D[Table[{x, y, 1 + 2y}, {x, -1, 1, 0.1}, {y, -1, 1, 0.1}, {z, -1, 1, 0.1}], ScalingFunctions -> {None, None, "Log"}]オプション (98)
Axes (3)
デフォルトで,Axesが描かれる:
ListVectorPlot3D[Table[{x, y, z}, {x, -1, 1, .1}, {y, -1, 1, .1}, {z, -1, 1, .1}]]ListVectorPlot3D[Table[{x, y, z}, {x, -1, 1, .1}, {y, -1, 1, .1}, {z, -1, 1, .1}], Axes -> False]{ListVectorPlot3D[Table[{x, y, z}, {x, -1, 1, .1}, {y, -1, 1, .1}, {z, -1, 1, .1}], Axes -> {True, False, False}], ListVectorPlot3D[Table[{x, y, z}, {x, -1, 1, .1}, {y, -1, 1, .1}, {z, -1, 1, .1}], Axes -> {False, True, False}], ListVectorPlot3D[Table[{x, y, z}, {x, -1, 1, .1}, {y, -1, 1, .1}, {z, -1, 1, .1}], Axes -> {False, False, True}]}AxesLabel (3)
ListVectorPlot3D[Table[{x, y, z}, {x, -1, 1, .1}, {y, -1, 1, .1}, {z, -1, 1, .1}]]
ListVectorPlot3D[Table[{x, y, z}, {x, -1, 1, .1}, {y, -1, 1, .1}, {z, -1, 1, .1}], AxesLabel -> z]ListVectorPlot3D[Table[{x, y, z}, {x, -1, 1, .1}, {y, -1, 1, .1}, {z, -1, 1, .1}], AxesLabel -> {x, y, z}]AxesOrigin (2)
AxesStyle (4)
ListVectorPlot3D[Table[{x, y, z}, {x, -1, 1, .1}, {y, -1, 1, .1}, {z, -1, 1, .1}], AxesStyle -> Red]ListVectorPlot3D[Table[{x, y, z}, {x, -1, 1, .1}, {y, -1, 1, .1}, {z, -1, 1, .1}], AxesStyle -> {{Thick, Brown}, {Thick, Blue}, {Thick, Green}}]ListVectorPlot3D[Table[{x, y, z}, {x, -1, 1, .1}, {y, -1, 1, .1}, {z, -1, 1, .1}], AxesStyle -> Green, TicksStyle -> Red]ListVectorPlot3D[Table[{x, y, z}, {x, -1, 1, .1}, {y, -1, 1, .1}, {z, -1, 1, .1}], AxesStyle -> Green, LabelStyle -> Red]BoxRatios (2)
DataRange (1)
EvaluationMonitor (1)
ImageSize (7)
Tiny,Small,Medium,Largeのような名前付きのサイズを使う:
{ListVectorPlot3D[Table[{x, y, z}, {x, -1, 1, .1}, {y, -1, 1, .1}, {z, -1, 1, .1}], ImageSize -> Tiny], ListVectorPlot3D[Table[{x, y, z}, {x, -1, 1, .1}, {y, -1, 1, .1}, {z, -1, 1, .1}], ImageSize -> Small]}{ListVectorPlot3D[Table[{x, y, z}, {x, -1, 1, .1}, {y, -1, 1, .1}, {z, -1, 1, .1}], ImageSize -> 150], ListVectorPlot3D[Table[{x, y, z}, {x, -1, 1, .1}, {y, -1, 1, .1}, {z, -1, 1, .1}], AspectRatio -> 1.5, ImageSize -> 150]}{ListVectorPlot3D[Table[{x, y, z}, {x, -1, 1, .1}, {y, -1, 1, .1}, {z, -1, 1, .1}], ImageSize -> {Automatic, 150}], ListVectorPlot3D[Table[{x, y, z}, {x, -1, 1, .1}, {y, -1, 1, .1}, {z, -1, 1, .1}], AspectRatio -> 2, ImageSize -> {Automatic, 150}]}{ListVectorPlot3D[Table[{x, y, z}, {x, -1, 1, .1}, {y, -1, 1, .1}, {z, -1, 1, .1}], ImageSize -> UpTo[200]], ListVectorPlot3D[Table[{x, y, z}, {x, -1, 1, .1}, {y, -1, 1, .1}, {z, -1, 1, .1}], AspectRatio -> 2, ImageSize -> UpTo[200]]}グラフィックスの幅と高さを指定して,必要な場合はスペースで充填する:
ListVectorPlot3D[Table[{x, y, z}, {x, -1, 1, .1}, {y, -1, 1, .1}, {z, -1, 1, .1}], ImageSize -> {200, 300}, Background -> StandardGray]AspectRatioFullと設定すると,使用可能なスペースが塗り潰される:
ListVectorPlot3D[Table[{x, y, z}, {x, -1, 1, .1}, {y, -1, 1, .1}, {z, -1, 1, .1}], AspectRatio -> Full, ImageSize -> {200, 300}, Background -> StandardGray]{ListVectorPlot3D[Table[{x, y, z}, {x, -1, 1, .1}, {y, -1, 1, .1}, {z, -1, 1, .1}], ImageSize -> {UpTo[150], UpTo[100]}], ListVectorPlot3D[Table[{x, y, z}, {x, -1, 1, .1}, {y, -1, 1, .1}, {z, -1, 1, .1}], AspectRatio -> 2, ImageSize -> {UpTo[150], UpTo[100]}]}ImageSizeFullを使ってオブジェクト内の使用可能なスペースを塗り潰す:
Framed[Pane[ListVectorPlot3D[Table[{x, y, z}, {x, -1, 1, .1}, {y, -1, 1, .1}, {z, -1, 1, .1}], ImageSize -> Full, Background -> StandardGray], {200, 100}]]Framed[Pane[ListVectorPlot3D[Table[{x, y, z}, {x, -1, 1, .1}, {y, -1, 1, .1}, {z, -1, 1, .1}], AspectRatio -> Full, ImageSize -> {Scaled[0.5], Scaled[0.5]}, Background -> StandardGray], {200, 200}]]PerformanceGoal (2)
ListVectorPlot3D[Table[{x, y, z}, {x, -1, 1, .1}, {y, -1, 1, .1}, {z, -1, 1, .1}], PerformanceGoal -> "Quality"]ListVectorPlot3D[Table[{x, y, z}, {x, -1, 1, .1}, {y, -1, 1, .1}, {z, -1, 1, .1}], PerformanceGoal -> "Speed"]PlotLegends (4)
ListVectorPlot3D[Table[{x, y, z}, {x, -1, 1, .1}, {y, -1, 1, .1}, {z, -1, 1, .1}], VectorColorFunction -> "Rainbow", PlotLegends -> Automatic]ListVectorPlot3D[{Table[{x, y, z}, {x, -1, 1, .2}, {y, -1, 1, .2}, {z, -1, 1, .2}], Table[{-x, y, z}, {x, -2, 2, .2}, {y, -1, 1, .2}, {z, -1, 1, .2}]}, VectorPoints -> 5, PlotLegends -> Automatic, VectorColorFunction -> None]SwatchLegendを使って凡例の外観を変える:
ListVectorPlot3D[{Table[{x, y, z}, {x, -1, 1, .2}, {y, -1, 1, .2}, {z, -1, 1, .2}], Table[{-x, y, z}, {x, -2, 2, .2}, {y, -1, 1, .2}, {z, -1, 1, .2}]}, VectorPoints -> 5, VectorColorFunction -> None, PlotLegends -> SwatchLegend[Automatic, LegendFunction -> "Frame", LegendLabel -> "label"]]Placedを使ってプロットの上に凡例を置く:
ListVectorPlot3D[{Table[{x, y, z}, {x, -1, 1, .2}, {y, -1, 1, .2}, {z, -1, 1, .2}], Table[{-x, y, z}, {x, -2, 2, .2}, {y, -1, 1, .2}, {z, -1, 1, .2}]}, VectorPoints -> 5, VectorColorFunction -> None, PlotLegends -> Placed[SwatchLegend[Automatic, LegendFunction -> "Frame", LegendLabel -> "label"], Above]]PlotRange (9)
ListVectorPlot3D[Table[{x, y, z}, {x, -1, 1, .1}, {y, -1, 1, .1}, {z, -1, 1, .1}], PlotRange -> Full]ListVectorPlot3D[Table[{x, y, z}, {x, -1, 1, .1}, {y, -1, 1, .1}, {z, -1, 1, .1}], PlotRange -> All]


ListVectorPlot3D[Table[{x, y, z}, {x, -1, 1, .1}, {y, -1, 1, .1}, {z, -1, 1, .1}], DataRange -> {{-1, 1}, {-1, 1}, {-1, 1}}, PlotRange -> 2]
ListVectorPlot3D[Table[{x, y, z}, {x, -1, 1, .1}, {y, -1, 1, .1}, {z, -1, 1, .1}], DataRange -> {{-1, 1}, {-1, 1}, {-1, 1}}, PlotRange -> {{-1, 2}, Automatic, Automatic}]
ListVectorPlot3D[Table[{x, y, z}, {x, -1, 1, .1}, {y, -1, 1, .1}, {z, -1, 1, .1}], DataRange -> {{-1, 1}, {-1, 1}, {-1, 1}}, PlotRange -> {{0, Full}, Automatic, Automatic}]
ListVectorPlot3D[Table[{x, y, z}, {x, -1, 1, .1}, {y, -1, 1, .1}, {z, -1, 1, .1}], DataRange -> {{-1, 1}, {-1, 1}, {-1, 1}}, PlotRange -> {Automatic, {0, 2}, Automatic}]
ListVectorPlot3D[Table[{x, y, z}, {x, -1, 1, .1}, {y, -1, 1, .1}, {z, -1, 1, .1}], DataRange -> {{-1, 1}, {-1, 1}, {-1, 1}}, PlotRange -> {Automatic, {Full, 3}, Automatic}]
ListVectorPlot3D[Table[{x, y, z}, {x, -1, 1, .1}, {y, -1, 1, .1}, {z, -1, 1, .1}], DataRange -> {{-1, 1}, {-1, 1}, {-1, 1}}, PlotRange -> {Automatic, Automatic, {-2, 2}}]


data = Table[{x, y, z}, {x, -1, 1, .1}, {y, -1, 1, .1}, {z, -1, 1, .1}];ListVectorPlot3D[data, DataRange -> {{-1, 1}, {-1, 1}, {-1, 1}}, PlotRange -> {{-2, 1.5}, {-1, 2}, {0, 1}}]PlotRangePadding (8)
ListVectorPlot3D[Table[{x, y, z}, {x, -1, 1, .1}, {y, -1, 1, .1}, {z, -1, 1, .1}], PlotRangePadding -> Automatic]


ListVectorPlot3D[Table[{x, y, z}, {x, -1, 1, .1}, {y, -1, 1, .1}, {z, -1, 1, .1}], PlotRangePadding -> None]


ListVectorPlot3D[Table[{x, y, z}, {x, -1, 1, .1}, {y, -1, 1, .1}, {z, -1, 1, .1}], DataRange -> {{-1, 1}, {-1, 1}, {-1, 1}}, PlotRangePadding -> 1]


ListVectorPlot3D[Table[{x, y, z}, {x, -1, 1, .1}, {y, -1, 1, .1}, {z, -1, 1, .1}], DataRange -> {{-1, 1}, {-1, 1}, {-1, 1}}, PlotRangePadding -> Scaled[0.1]]

ListVectorPlot3D[Table[{x, y, z}, {x, -1, 1, .1}, {y, -1, 1, .1}, {z, -1, 1, .1}], DataRange -> {{-1, 1}, {-1, 1}, {-1, 1}}, PlotRangePadding -> {1, 0.5, None}]


ListVectorPlot3D[Table[{x, y, z}, {x, -1, 1, .1}, {y, -1, 1, .1}, {z, -1, 1, .1}], DataRange -> {{-1, 1}, {-1, 1}, {-1, 1}}, PlotRangePadding -> {1, 0.5, 2}]
data = Table[{x, y, z}, {x, -1, 1, .1}, {y, -1, 1, .1}, {z, -1, 1, .1}];ListVectorPlot3D[data, DataRange -> {{-1, 1}, {-1, 1}, {-1, 1}}, PlotRangePadding -> {Automatic, Automatic, 2}]data = Table[{x, y, z}, {x, -1, 1, .1}, {y, -1, 1, .1}, {z, -1, 1, .1}];ListVectorPlot3D[data, DataRange -> {{-1, 1}, {-1, 1}, {-1, 1}}, PlotRangePadding -> {Automatic, Scaled[0.05], 2}]PlotTheme (2)
ListVectorPlot3D[Table[{x - y, y ^ 2, z + y}, {x, -1, 1, .1}, {y, -1, 1, .1}, {z, -1, 1, .1}], PlotTheme -> "Detailed"]ListVectorPlot3D[Table[{x - y, y ^ 2, z + y}, {x, -1, 1, .1}, {y, -1, 1, .1}, {z, -1, 1, .1}], PlotTheme -> "Detailed", VectorColorFunction -> "Rainbow"]RegionBoundaryStyle (5)
ListVectorPlot3D[Table[{x, y, z}, {x, -1, 1, .1}, {y, -1, 1, .1}, {z, -1, 1, .1}], DataRange -> {{-1, 1}, {-1, 1}, {-1, 1}}, RegionFunction -> Function[{x, y, z}, x^2 + y^2 + z^2 ≤ 1]]Noneを使って境界は表示しないようにする:
ListVectorPlot3D[Table[{x, y, z}, {x, -1, 1, .1}, {y, -1, 1, .1}, {z, -1, 1, .1}], DataRange -> {{-1, 1}, {-1, 1}, {-1, 1}}, RegionFunction -> Function[{x, y, z}, x^2 + y^2 + z^2 ≤ 1], RegionBoundaryStyle -> None]ListVectorPlot3D[Table[{x, y, z}, {x, -1, 1, .1}, {y, -1, 1, .1}, {z, -1, 1, .1}], DataRange -> {{-1, 1}, {-1, 1}, {-1, 1}}, RegionFunction -> Function[{x, y, z}, x^2 + y^2 + z^2 ≤ 1], RegionBoundaryStyle -> Yellow]ListVectorPlot3D[Table[{x, y, z}, {x, -1, 1, .1}, {y, -1, 1, .1}, {z, -1, 1, .1}], DataRange -> {{-1, 1}, {-1, 1}, {-1, 1}}]ListVectorPlot3D[Table[{x, y, z}, {x, -1, 1, .1}, {y, -1, 1, .1}, {z, -1, 1, .1}], DataRange -> {{-1, 1}, {-1, 1}, {-1, 1}}, RegionBoundaryStyle -> Yellow]RegionFunction (3)
data = Table[{x, y, z}, {x, -1, 1, .1}, {y, -1, 1, .1}, {z, -1, 1, .1}];ListVectorPlot3D[data, DataRange -> {{-1, 1}, {-1, 1}, {-1, 1}}, RegionFunction -> ((#1 #2 #3 > 0)&)]場の強度が指定の閾値より上の範囲のみでベクトルをプロットする:
data = Table[{x, y, z}, {x, -1, 1, .1}, {y, -1, 1, .1}, {z, -1, 1, .1}];ListVectorPlot3D[data, DataRange -> {{-1, 1}, {-1, 1}, {-1, 1}}, RegionFunction -> ((#7 > 1.4)&), VectorPoints -> 10]data = Table[{x, y, z}, {x, -1, 1, .1}, {y, -1, 1, .1}, {z, -1, 1, .1}];ListVectorPlot3D[data, DataRange -> {{-1, 1}, {-1, 1}, {-1, 1}}, RegionFunction -> ((0.3 < #7 < 0.5 || 1.5 < #7 < 2)&), VectorPoints -> 10]ScalingFunctions (2)
ListVectorPlot3D[Table[{x, y, 1 + 2y}, {x, -1, 1, 0.1}, {y, -1, 1, 0.1}, {z, -1, 1, 0.1}]]ListVectorPlot3D[Table[{x, y, 1 + 2y}, {x, -1, 1, 0.1}, {y, -1, 1, 0.1}, {z, -1, 1, 0.1}], ScalingFunctions -> {None, None, "Reverse"}]Ticks (6)
ListVectorPlot3D[Table[{x, y, z}, {z, -2, 2, 0.1}, {y, -2, 2, 0.1}, {x, -2, 2, 0.1}]]ListVectorPlot3D[Table[{x, y, z}, {z, -2, 2, 0.1}, {y, -2, 2, 0.1}, {x, -2, 2, 0.1}], Ticks -> None]ListVectorPlot3D[Table[{x, y, z}, {z, -2, 2, 0.1}, {y, -2, 2, 0.1}, {x, -2, 2, 0.1}], Ticks -> {{5, 15, 25}, {5, 15, 25}, {5, 15, 25}}]ListVectorPlot3D[Table[{x, y, z}, {z, -2, 2, 0.1}, {y, -2, 2, 0.1}, {x, -2, 2, 0.1}], Ticks -> {{{5, a}, {15, b}, {25, c}}, {{5, a}, {15, b}, {25, c}}, {{5, a}, {15, b}, {25, c}}}]ListVectorPlot3D[Table[{x, y, z}, {z, -2, 2, 0.1}, {y, -2, 2, 0.1}, {x, -2, 2, 0.1}], Ticks -> {{{5, a, .1}, {15, b, .1}, {25, c, .1}}, {{5, a, .05}, {15, b, .05}, {25, c, .05}}, {{5, a, .15}, {15, b, .15}, {25, c, .15}}}]ListVectorPlot3D[Table[{x, y, z}, {z, -2, 2, 0.1}, {y, -2, 2, 0.1}, {x, -2, 2, 0.1}], Ticks -> {{{5, a, .1, Directive[Red]}, {15, b, .1, Directive[Red, Thick]}, {25, c, .1, Directive[Red, Dashed, Thick]}}, {{5, a, .1, Directive[Blue]}, {15, b, .1, Directive[Blue, Thick]}, {25, c, .1, Directive[Blue, Dashed, Thick]}}, {{5, a, .1, Directive[Darker@Green]}, {15, b, .1, Directive[Darker@Green, Thick]}, {25, c, .1, Directive[Darker@Green, Dashed, Thick]}}}]TicksStyle (3)
デフォルトで,目盛と目盛ラベルには軸と同じスタイルが使われる:
ListVectorPlot3D[Table[{x, y, z}, {z, -2, 2, 0.1}, {y, -2, 2, 0.1}, {x, -2, 2, 0.1}], AxesStyle -> Directive[Thick, Red]]ListVectorPlot3D[Table[{x, y, z}, {z, -2, 2, 0.1}, {y, -2, 2, 0.1}, {x, -2, 2, 0.1}], TicksStyle -> Directive[Bold, Red]]ListVectorPlot3D[Table[{x, y, z}, {z, -2, 2, 0.1}, {y, -2, 2, 0.1}, {x, -2, 2, 0.1}], TicksStyle -> {Directive[Green, Bold], Directive[Bold, Red], Directive[Bold, Blue]}]VectorAspectRatio (2)
VectorColorFunction (4)
ListVectorPlot3D[Table[{x, y, z}, {x, -1, 1, .1}, {y, -1, 1, .1}, {z, -1, 1, .1}], VectorColorFunction -> Hue]ColorDataから任意の名前付き色階調度を使う:
ListVectorPlot3D[Table[{x, y, z}, {x, -1, 1, .1}, {y, -1, 1, .1}, {z, -1, 1, .1}], VectorColorFunction -> "Rainbow"]
data = Table[{x, y, z}, {x, -1, 1, .1}, {y, -1, 1, .1}, {z, -1, 1, .1}];ListVectorPlot3D[data, DataRange -> {{-1, 1}, {-1, 1}, {-1, 1}}, VectorColorFunction -> Function[{x, y, z, vx, vy, vz, n}, ColorData["ThermometerColors"][x]]]VectorColorFunctionScalingFalseを使ってスケールしていない値を得る:
data = Table[{x, y, z}, {x, -1, 1, .1}, {y, -1, 1, .1}, {z, -1, 1, .1}];ListVectorPlot3D[data, VectorColorFunction -> (ColorData[22][Round[#7]]&), VectorColorFunctionScaling -> False]VectorColorFunctionScaling (4)
ListVectorPlot3D[Table[{x, y, z}, {x, -1, 1, .1}, {y, -1, 1, .1}, {z, -1, 1, .1}], VectorColorFunction -> Hue]VectorColorFunctionScaling->Falseを使ってスケールされていない値を得る:
data = Table[{x, y, z}, {x, -1, 1, .1}, {y, -1, 1, .1}, {z, -1, 1, .1}];ListVectorPlot3D[data, VectorColorFunction -> (ColorData[22][Round[#7]]&), VectorColorFunctionScaling -> False] 方向にはスケールされていない座標を,
 方向にはスケールされた座標を使う:
data = Table[{x, y, z}, {x, -1, 1, .1}, {y, -1, 1, .1}, {z, -1, 1, .1}];ListVectorPlot3D[data, VectorColorFunction -> Function[{x, y, z, vx, vy, vz, n}, Hue[x, y, 1]], VectorColorFunctionScaling -> {False, True}]data = Table[{x, y, z}, {x, -1, 1, .1}, {y, -1, 1, .1}, {z, -1, 1, .1}];ListVectorPlot3D[data, VectorColorFunction -> (Hue[#7, #2, 1]&), VectorColorFunctionScaling -> {True, True, True, True, False}]VectorMarkers (3)
ListVectorPlot3D[Table[{x, y, z}, {x, -1, 1, .1}, {y, -1, 1, .1}, {z, -1, 1, .1}], VectorMarkers -> "Arrow3D"]Table[ListVectorPlot3D[Table[{x, y, z}, {x, -1, 1, .1}, {y, -1, 1, .1}, {z, -1, 1, .1}], VectorMarkers -> m, PlotLabel -> m], {m, {"Tube", "Segment", "Arrow"}}]Placedを使って矢印の置き方をベクトル点と相対的に制御する:
data = Table[{x, y, z}, {x, -1, 1}, {y, -1, 1}, {z, -1, 1}];Table[Show[ListVectorPlot3D[data, VectorMarkers -> Placed["Arrow", pos], VectorPoints -> Flatten[data, 2], DataRange -> {{-1, 1}, {-1, 1}, {-1, 1}}],
ListPointPlot3D[Flatten[data, 2]]], {pos, {"Start", "End"}}]VectorPoints (8)
ListVectorPlot3D[Table[{x, y, z}, {x, -1, 1, .1}, {y, -1, 1, .1}, {z, -1, 1, .1}], VectorPoints -> Automatic]名前付きのVectorPoints設定を使う:
data = Table[{x, y, z}, {x, -1, 1, .1}, {y, -1, 1, .1}, {z, -1, 1, .1}];Table[ListVectorPlot3D[data, VectorPoints -> p, PlotLabel -> p], {p, {"FaceCenteredCubic", "Hexagonal"}}]data = Table[{x, y, z}, {x, -1, 1, .1}, {y, -1, 1, .1}, {z, -1, 1, .1}];Table[ListVectorPlot3D[data, PlotLabel -> k, VectorPoints -> k], {k, {Fine, Coarse}}] ,
 ,
 の方向に同数の矢印を使って場のベクトルの構造格子を作る:
ListVectorPlot3D[Table[{x, y, z}, {x, -1, 1, .1}, {y, -1, 1, .1}, {z, -1, 1, .1}], VectorPoints -> 5] ,
 ,
 の方向に異なる数の矢印を使って場のベクトルの構造格子を作成する:
ListVectorPlot3D[Table[{x, y, z}, {x, -1, 1, .1}, {y, -1, 1, .1}, {z, -1, 1, .1}], VectorPoints -> {4, 7, 9}]data = Table[{x, y, z}, {x, -1, 1, .1}, {y, -1, 1, .1}, {z, -1, 1, .1}];ListVectorPlot3D[data, DataRange -> {{-1, 1}, {-1, 1}, {-1, 1}}, VectorPoints -> RandomReal[{-1, 1}, {300, 3}], VectorSizes -> Tiny]data = Table[{x, y, z}, {x, -1, 1, .1}, {y, -1, 1, .1}, {z, -1, 1, .1}];Table[ListVectorPlot3D[data, DataRange -> {{-1, 1}, {-1, 1}, {-1, 1}}, PlotLabel -> n, VectorPoints -> n, VectorSizes -> Tiny], {n, 4, 10, 3}]data = Table[{x, y + 1, z + 2}, {x, -1, 1, .1}, {y, -1, 1, .1}, {z, -1, 1, .1}];points = {{-1, -1, -1}, {-1, 1, 1}, {0, 0, 0}, {1, -1, -1}, {1, 1, 1}};ListVectorPlot3D[data, DataRange -> {{-1, 1}, {-1, 1}, {-1, 1}}, VectorPoints -> points]VectorRange (4)
非常に小さいあるいは非常に大きいベクトルの切り取りは自動的に行われる:
ListVectorPlot3D[Table[({x, y, z}/Norm[{x, y, z}] ^ 3), {x, -3, 3, 0.35}, {y, -3, 3, 0.35}, {z, -3, 3, 0.35}], VectorRange -> Automatic]ListVectorPlot3D[Table[({x, y, z}/Norm[{x, y, z}] ^ 3), {x, -3, 3, 0.35}, {y, -3, 3, 0.35}, {z, -3, 3, 0.35}], VectorRange -> {0.1, 0.3}]ListVectorPlot3D[Table[({x, y, z}/Norm[{x, y, z}] ^ 3), {x, -3, 3, 0.35}, {y, -3, 3, 0.35}, {z, -3, 3, 0.35}], VectorRange -> {0.1, 0.3}, ClippingStyle -> None]ListVectorPlot3D[Table[({x, y, z}/Norm[{x, y, z}] ^ 3), {x, -3, 3, 0.35}, {y, -3, 3, 0.35}, {z, -3, 3, 0.35}], VectorRange -> {0.1, 0.3}, VectorRange -> All]VectorScaling (2)
ListVectorPlot3D[Table[{x, y, z}, {x, -1, 1, .1}, {y, -1, 1, .1}, {z, -1, 1, .1}], VectorScaling -> Automatic]ベクトルのスケーリング関数をNoneに設定すると,すべてのベクトルが同じ大きさになる:
ListVectorPlot3D[Table[{x, y, z}, {x, -1, 1, .1}, {y, -1, 1, .1}, {z, -1, 1, .1}], VectorScaling -> None]VectorSizes (2)
ListVectorPlot3D[Table[{y, -x, z}, {x, 0, 1, .1}, {y, 0, 1, .1}, {z, 0, 1, .1}], VectorScaling -> Automatic, VectorSizes -> Automatic]ListVectorPlot3D[Table[{y, -x, z}, {x, 0, 1, .1}, {y, 0, 1, .1}, {z, 0, 1, .1}], VectorScaling -> Automatic, VectorSizes -> {0.3, 0.7}]VectorStyle (2)
VectorColorFunctionは,VectorStyleでは色より優先順位が高い:
data = Table[{x, y, z}, {x, -1, 1, .1}, {y, -1, 1, .1}, {z, -1, 1, .1}];ListVectorPlot3D[data, VectorStyle -> Red]VectorColorFunctionNoneを使ってVectorStyleで色を指定する:
data = Table[{x, y, z}, {x, -1, 1, .1}, {y, -1, 1, .1}, {z, -1, 1, .1}];ListVectorPlot3D[data, VectorStyle -> Darker[Green], VectorColorFunction -> None]アプリケーション (2)
scalarField = x ^ 2 - y ^ 2 - z;
vectorField = D[scalarField, {{x, y, z}}];
data = Table[vectorField, {x, -2, 2}, {y, -2, 2}, {z, -2, 2}];v = ListVectorPlot3D[data, DataRange -> {{-2, 2}, {-2, 2}, {-2, 2}}, VectorPoints -> 25, VectorSizes -> 2, RegionFunction -> Function[{x, y, z}, -0.1 ≤ x ^ 2 - y ^ 2 - z <= 0.1]]c = ContourPlot3D[scalarField == 0, {x, -2, 2}, {y, -2, 2}, {z, -2, 2}, Mesh -> None, ContourStyle -> Opacity[0.5, Yellow]]Show[v, c]data = Table[{Sin[x], Sin[y] ^ 2, Cos[z] ^ 3 - Sin[x]}, {x, -6, 6}, {y, -6, 6}, {z, -6, 6}];g = ListVectorPlot3D[data, DataRange -> {{-6, 6}, {-6, 6}, {-6, 6}}, VectorStyle -> "Arrow3D", VectorPoints -> 25, VectorColorFunction -> "TemperatureMap", RegionFunction -> Function[{x, y, z}, 4 ^ 2 < x ^ 2 + y ^ 2 + z ^ 2 < 5 ^ 2]]Show[g, Graphics3D[Sphere[{0, 0, 0}, 4]]]特性と関係 (12)
VectorPlot3Dを使って関数を可視化する:
VectorPlot3D[{y, -x, 2z}, {x, -3, 3}, {y, -3, 3}, {z, -3, 3}]StreamPlot3Dを使ってベクトルの代りに流線で関数を可視化する:
StreamPlot3D[{y, -x, 2z}, {x, -3, 3}, {y, -3, 3}, {z, -3, 3}]ListSliceVectorPlot3Dで曲面に沿ってベクトルをプロットする:
data = Table[{-1 - x ^ 2 + y, 1 + x - y ^ 2, z}, {x, -3, 3}, {y, -3, 3}, {z, -3, 3}];ListSliceVectorPlot3D[data]ListStreamPlot3Dを使って3D場を流線としてプロットする:
data = Table[{-1 - x ^ 2 + y, 1 + x - y ^ 2, z}, {x, -3, 3}, {y, -3, 3}, {z, -3, 3}];ListStreamPlot3D[data]2DベクトルのプロットにListVectorPlotを使う:
data = Table[{-1 - x ^ 2 + y, 1 + x - y ^ 2}, {x, -3, 3}, {y, -3, 3}];ListVectorPlot[data]ListStreamPlotを使ってベクトルの代りに流線でプロットする:
data = Table[{-1 - x ^ 2 + y, 1 + x - y ^ 2}, {x, -3, 3}, {y, -3, 3}];ListStreamPlot[data]ListVectorDensityPlotを使ってスカラー場の密度プロットを加える:
data = Table[{-1 - x ^ 2 + y, 1 + x - y ^ 2}, {x, -3, 3}, {y, -3, 3}];ListVectorDensityPlot[data]ListStreamDensityPlotを使ってベクトルの代りに流れをプロットする:
ListStreamDensityPlot[data]VectorDisplacementPlotを使って指定領域に対する変位ベクトル場の影響を可視化する:
VectorDisplacementPlot[{-1 - x ^ 2 + y, 1 + x - y ^ 2}, {x, y}∈Annulus[], VectorPoints -> Automatic]ListVectorDisplacementPlotを使って領域上の変位場データの効果を可視化する:
data = Table[{{x, y}, {x + y, 1 + x - y}}, {x, -3, 3, 0.2}, {y, -3, 3, 0.2}];ListVectorDisplacementPlot[data, Polygon[{{3, 3}, {0, 1}, {-3, 3}, {-3, -3}, {0, -1}, {3, -3}}], VectorPoints -> Automatic]ListLineIntegralConvolutionPlotを使ってベクトル場の線積分たたみ込みをプロットする:
data = Table[{-1 - x ^ 2 + y, 1 + x - y ^ 2}, {x, -3, 3}, {y, -3, 3}];ListLineIntegralConvolutionPlot[data]VectorDisplacementPlot3Dを使って指定された3D領域に対する変位ベクトル場の影響を可視化する:
VectorDisplacementPlot3D[{-y, x, x + z}, {x, -2, 2}, {y, -2, 2}, {z, -2, 2}, VectorPoints -> "Boundary"]ListVectorDisplacementPlot3Dを使ってデータに基づく3D変位ベクトル場の影響を可視化する:
data = Table[{{x, y, z}, {-y, x, x + z}}, {x, -2, 2}, {y, -2, 2}, {z, -2, 2}];ListVectorDisplacementPlot3D[data, VectorPoints -> "Boundary"]GeoVectorPlotを使って地図上にベクトルをプロットする:
GeoVectorPlot[GeoVector[GeoPosition[{{-54.79801473961214, -111.85053058521567},
    {-65.56940402358214, 162.89657500795147}, {-81.67990688759895, -93.36222177594851},
    {7.785750774919734, 95.44840765141487}, {-6.86571958448036, -40.946398330539864},
    { ... 904, "AngularDegrees"]},
   {0.9366099079317551, Quantity[357.70482317743733, "AngularDegrees"]},
   {0.8256817194791912, Quantity[242.07227508889662, "AngularDegrees"]},
{0.2661401145642981, Quantity[152.90003252279325, "AngularDegrees"]}}]]GeoStreamPlotを使ってベクトルの代りに流れを使う:
GeoStreamPlot[GeoVector[GeoPosition[{{-54.79801473961214, -111.85053058521567},
    {-65.56940402358214, 162.89657500795147}, {-81.67990688759895, -93.36222177594851},
    {7.785750774919734, 95.44840765141487}, {-6.86571958448036, -40.946398330539864},
    { ... 904, "AngularDegrees"]},
   {0.9366099079317551, Quantity[357.70482317743733, "AngularDegrees"]},
   {0.8256817194791912, Quantity[242.07227508889662, "AngularDegrees"]},
{0.2661401145642981, Quantity[152.90003252279325, "AngularDegrees"]}}]]テキスト
Wolfram Research (2008), ListVectorPlot3D, Wolfram言語関数, https://reference.wolfram.com/language/ref/ListVectorPlot3D.html (2022年に更新).
CMS
Wolfram Language. 2008. "ListVectorPlot3D." Wolfram Language & System Documentation Center. Wolfram Research. Last Modified 2022. https://reference.wolfram.com/language/ref/ListVectorPlot3D.html.
APA
Wolfram Language. (2008). ListVectorPlot3D. Wolfram Language & System Documentation Center. Retrieved from https://reference.wolfram.com/language/ref/ListVectorPlot3D.html