ChromaticityPlot3D[colspace]
色空間 colspace の3D色域を返す.
ChromaticityPlot3D[color]
特定の color をプロットする.
ChromaticityPlot3D[image]
image の画素を個々の色としてプロットする.
ChromaticityPlot3D[{input1,input2,…}]
複数の色,色空間,画像をプロットする.
ChromaticityPlot3D[…,refcolspace]
基準色空間 refcolspace を使う.
ChromaticityPlot3D
ChromaticityPlot3D[colspace]
色空間 colspace の3D色域を返す.
ChromaticityPlot3D[color]
特定の color をプロットする.
ChromaticityPlot3D[image]
image の画素を個々の色としてプロットする.
ChromaticityPlot3D[{input1,input2,…}]
複数の色,色空間,画像をプロットする.
ChromaticityPlot3D[…,refcolspace]
基準色空間 refcolspace を使う.
詳細とオプション
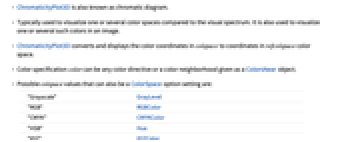
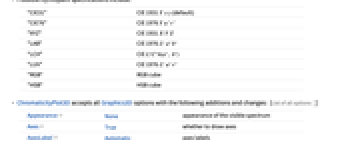
- ChromaticityPlot3Dは色度図としても知られている.
- 一般に,1つあるいは複数の色空間を可視スペクトルと比較して可視化するのに使われる.これは,画像中の1つあるいは複数のそのような色の可視化にも使われる.
- ChromaticityPlot3Dは,colspace における色座標を refcolspace 色空間における座標に変換し表示する.
- 色指定 color は,任意の色指示子またはColorsNearオブジェクトとして与えられる色近傍でよい.
- ColorSpace のオプション設定にもなり得る colspace の可能な値
-
"Grayscale" GrayLevel "RGB" RGBColor "CMYK" CMYKColor "HSB" Hue "XYZ" XYZColor "LAB" LABColor "LUV" LUVColor "LCH" LCHColor ColorProfileData[…][i] 指定された描画強度
によるカラープロファイル - その他の colspace の可能な値
-
"AdobeRGB" Adobe RGB (1998)色空間 "AppleRGB" Apple RGB色空間 "CIERGB" CIE RGB色空間 "ProPhotoRGB" ProPhoto RGB "sRGB" 標準sRGB色空間 "WideGamutRGB" 広い色域のRGB(別名Adobe Wide Gamut RGB) - refcolspace の可能な指定値
-
"CIE31" CIE 1931
(デフォルト)"CIE76" CIE 1976 
"XYZ" CIE 1931 
"LAB" CIE 1976 
"LCH" CIE 


"LUV" CIE 1976 
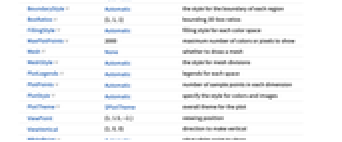
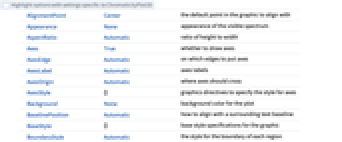
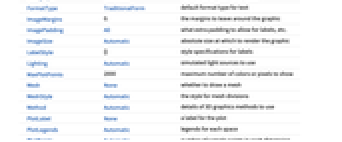
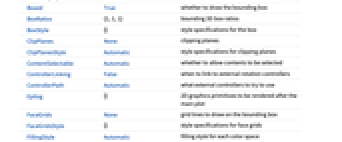
"RGB" RGB立方体 "HSB" HSB立方体 - ChromaticityPlot3Dには,Graphics3Dのすべてのオプションに以下の追加・変更を加えたものを使うことができる. [全オプションのリスト]
-
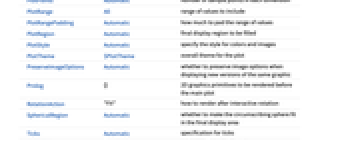
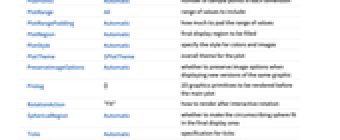
Appearance None 可視スペクトルの外観 Axes True 軸を描くかどうか AxesLabel Automatic 軸のラベル BoundaryStyle Automatic 各領域の境界スタイル BoxRatios {1,1,1} 3D境界ボックスの割合 FillingStyle Automatic 各色空間の塗潰しスタイル MaxPlotPoints 2000 表示する色あるいは画素の最大数 Mesh None メッシュを描くかどうか MeshStyle Automatic メッシュ区分のスタイル PlotLegends Automatic 各空間の凡例 PlotPoints Automatic 各次元のサンプル点の数 PlotStyle Automatic 色と画像のスタイルを指定する PlotTheme $PlotTheme プロットの全体的なテーマ ViewPoint {1,1.5,-2.} 視点 ViewVertical {1,0,0} 垂直線を引く方向 WhitePoint Automatic どの白色点を表示するか - Appearanceの可能な設定値
-
None 可視スペクトルを表示しない "VisibleSpectrum" 可視スペクトルに対応する曲線を表示する - PlotLegendsのよく使われる設定値
-
None 凡例は加えない Automatic 自動凡例を使う "Expressions" 色空間名を凡例ラベルとして使う {lbl1,lbl2,…} 第 i 入力に lbliを使う Placed[lspec,…] 凡例の置き方を指定する
全オプションのリスト
例題
すべて開く すべて閉じる例 (2)
スコープ (8)
sRGBの色域をCIE 1931 Yxyの基準空間で可視化する:
ChromaticityPlot3D["sRGB"]ChromaticityPlot3D["sRGB", "XYZ"]ChromaticityPlot3D[{"RGB", "AdobeRGB"}, "LAB"]ChromaticityPlot3D[RandomColor[1000], "RGB"]ChromaticityPlot3D[{ColorsNear[Brown], ColorsNear[Cyan, .05]}]ChromaticityPlot3D[[image]]ChromaticityPlot3D[[image]]ChromaticityPlot3D[[image]]オプション (40)
Appearance (1)
Axes (3)
AxesLabel (3)
AxesOrigin (2)
AxesStyle (4)
ChromaticityPlot3D["RGB", AxesStyle -> Red]ChromaticityPlot3D["RGB", AxesStyle -> {{Thick, StandardBrown}, {Thick, StandardBlue}, {Thick, StandardGreen}}]ChromaticityPlot3D["RGB", AxesStyle -> StandardBlue, TicksStyle -> StandardRed]ChromaticityPlot3D["RGB", AxesStyle -> StandardBlue, LabelStyle -> StandardRed]BoundaryStyle (3)
ChromaticityPlot3D[{"RGB", "CIERGB"}]ChromaticityPlot3D[{"RGB", "CIERGB"}, BoundaryStyle -> Thick]ChromaticityPlot3D[{"RGB", "CIERGB"}, BoundaryStyle -> {Directive[{Red, Dashed}], Directive[{Thick, Blue}]}]BoxRatios (1)
FillingStyle (3)
ChromaticityPlot3D["sRGB"]ChromaticityPlot3D["sRGB", FillingStyle -> Opacity[.5]]ChromaticityPlot3D["RGB", FillingStyle -> None]ChromaticityPlot3D["RGB", FillingStyle -> RGBColor[.2, .4, .6, .8]]ChromaticityPlot3D[{"RGB", "WideGamutRGB"}]ChromaticityPlot3D[{"RGB", "WideGamutRGB"}, FillingStyle -> {Opacity[.6], Opacity[.3]}]指定されたスタイルのリストが色空間のリストよりも短い場合は,循環的に充填される:
ChromaticityPlot3D[{"WideGamutRGB", "CIERGB", "LAB"}, FillingStyle -> {Opacity[.3], Opacity[.6]}]MaxPlotPoints (1)
Mesh (6)
ChromaticityPlot3D["RGB"]ChromaticityPlot3D["RGB", Mesh -> 5]ChromaticityPlot3D["RGB", Mesh -> Full]完全なメッシュの解像度はPlotPointsオプションから取られる:
ChromaticityPlot3D["RGB", Mesh -> Full, PlotPoints -> 5]ChromaticityPlot3D["RGB", Mesh -> 5, PlotStyle -> None]すべての空間について,各方向に5本のメッシュラインを用いる:
ChromaticityPlot3D[{"RGB", "XYZ"}, Mesh -> 5]ChromaticityPlot3D[{"RGB", "XYZ"}, Mesh -> {5, None}]MeshStyle (1)
PlotLegends (2)
ChromaticityPlot3D["RGB"]ChromaticityPlot3D["RGB", PlotLegends -> "Expressions"]ChromaticityPlot3D[{"RGB", "AdobeRGB"}]ChromaticityPlot3D[{"RGB", "AdobeRGB"}, PlotLegends -> None]PlotPoints (1)
PlotPointsは格子密度を指定する:
Table[ChromaticityPlot3D["XYZ", "XYZ", Mesh -> Full, PlotPoints -> n, ImageSize -> 150], {n, {5, 10, 20}}]PlotStyle (1)
PlotTheme (3)
ChromaticityPlot3D[{"WideGamutRGB", "sRGB"}, PlotTheme -> "Web"]ChromaticityPlot3D[{"WideGamutRGB", "sRGB"}, PlotTheme -> "Web", BoundaryStyle -> {Directive[Thick, Red], Directive[Thick, Blue]}]ChromaticityPlot3D[{"WideGamutRGB", "sRGB"}, PlotTheme -> "Monochrome"]WhitePoint (5)
ChromaticityPlot3D["RGB"]ChromaticityPlot3D["RGB", WhitePoint -> All]ChromaticityPlot3D[{"RGB", "AdobeRGB"}, WhitePoint -> All]ChromaticityPlot3D["RGB", WhitePoint -> "E"]ChromaticityPlot3D["RGB", WhitePoint -> {XYZColor[.9, 1, .8], XYZColor[.9, 1, 1.1]}]アプリケーション (2)
ChromaticityPlot3D[RandomColor[Hue[1 / 3, _, _], 1000], "RGB"]ChromaticityPlot3D[RandomColor[Hue[1 / 3, _, _], 1000], "HSB"]ImageAdjustはRGBの値を0と1になるように再スケールする.変換したものをLab色空間で可視化する:
{image = ExampleData[{"TestImage", "House"}], adjusted = ImageAdjust@image}ChromaticityPlot3D[#, "LAB", ViewPoint -> Bottom, PlotRange -> {{0, 1}, All, All}, ImageSize -> 150]& /@ {image, adjusted}特性と関係 (2)
ProPhoto RGBは,Lab空間の可視部分のほとんどをカバーするように設計されている:
ChromaticityPlot3D["ProPhotoRGB", "LAB", Appearance -> "VisibleSpectrum"]ChromaticityPlot3Dは,ColorsNearで指定された記号的な色領域が可視化できる:
ℛ1 = ColorsNear[RGBColor[1, 0, 0], .3, "CIE76"];
ℛ2 = ColorsNear[RGBColor[0.3, 0.47000000000000003, 0.87], .08];ChromaticityPlot3D[{"RGB", ℛ1, ℛ2}]関連するガイド
-
▪
- 色の処理 ▪
- 画像計算機能の更新履歴 ▪
- データの可視化
テキスト
Wolfram Research (2014), ChromaticityPlot3D, Wolfram言語関数, https://reference.wolfram.com/language/ref/ChromaticityPlot3D.html (2019年に更新).
CMS
Wolfram Language. 2014. "ChromaticityPlot3D." Wolfram Language & System Documentation Center. Wolfram Research. Last Modified 2019. https://reference.wolfram.com/language/ref/ChromaticityPlot3D.html.
APA
Wolfram Language. (2014). ChromaticityPlot3D. Wolfram Language & System Documentation Center. Retrieved from https://reference.wolfram.com/language/ref/ChromaticityPlot3D.html
BibTeX
@misc{reference.wolfram_2026_chromaticityplot3d, author="Wolfram Research", title="{ChromaticityPlot3D}", year="2019", howpublished="\url{https://reference.wolfram.com/language/ref/ChromaticityPlot3D.html}", note=[Accessed: 08-September-2026]}
BibLaTeX
@online{reference.wolfram_2026_chromaticityplot3d, organization={Wolfram Research}, title={ChromaticityPlot3D}, year={2019}, url={https://reference.wolfram.com/language/ref/ChromaticityPlot3D.html}, note=[Accessed: 08-September-2026]}