



RevolutionPlot3D
RevolutionPlot3D[fz,{t,tmin,tmax}]
高さ fz半径 t の回転の表面のプロットを生成する.
RevolutionPlot3D[fz,{t,tmin,tmax},{θ,θmin,θmax}]
θminから θmaxまでの間で方位角 θ を変化させる.
RevolutionPlot3D[{fx,fz},{t,tmin,tmax}]
x, z 座標が{fx,fz}のパラメトリック曲線の z 軸の周りの回転で得られる曲面のプロットを生成する.
RevolutionPlot3D[{fx,fz},{t,tmin,tmax},{θ,θmin,θmax}]
方位角 θ を θminから θmaxまで変化させる.
RevolutionPlot3D[{fx,fy,fz},{t,tmin,tmax},…]
x, y, z 座標が{fx,fy,fz}のパラメトリック曲線の回転で得られる曲面のプロットを生成する.
詳細とオプション
- RevolutionPlot3D[fz,{t,…}]はRevolutionPlot3D[{t,0,fz},{t,…}]に等しい.
- RevolutionPlot3D[fz,{t,tmin,tmax},{θ,θmin,θmax}]は,半径 t で角 θ の関数として円柱座標で fzをプロットすることに相当する.
- 角 θ は上から見た場合に正の x 軸から反時計回りにラジアンで測られる.
- RevolutionPlot3D[{{f},{g},…},…]は,すべての関数 f, g, …に対応する曲面をプロットする.
- f 等を評価するとNoneあるいは実数以外になる位置には穴が残される.
- RevolutionPlot3Dは,実質的にBlockを使って変数 r,t,θ を局所的に扱う.
- RevolutionPlot3Dは属性HoldAllを持ち,変数に特定の数値を割り当てた後でのみ f を評価する.
- 場合によっては,変数に特定の数値が割り当てられる前にEvaluateを使って f を記号的に評価した方がより効率的なこともある.
- RevolutionPlot3DではGraphics3Dのオプションに以下の追加・変更を加えたものが使える. [全オプションのリスト]
- 曲面についてのインタラクティブなラベル付けはTooltip,StatusAreaあるいはAnnotationを使って指定することができる.
- RevolutionPlot3Dは,まず,PlotPointsで指定された多くの等間隔のサンプル点で各関数を評価する.次に,適応的アルゴリズムを用い,各パラメータを最高でMaxRecursion回再分割して追加的なサンプル点を選ぶ.
- 使用するサンプル点の数が有限の場合,RevolutionPlot3Dは関数の特徴を見逃す場合があるので注意が必要である.結果の検証にはPlotPointsとMaxRecursionの設定値を大きくしてみるとよい.
- On[RevolutionPlot3D::accbend]とすると,特定の曲線の滑らかさに到達できなかった場合にRevolutionPlot3Dがメッセージを出力するようになる.
- デフォルト設定のBoxRatiosAutomaticでは,z 軸 と平行の最終的な3Dグラフィックスを通したスライスは,Plotで使われているデフォルトの縦横比に等しい形を与える.
- MeshFunctionsおよびRegionFunctionの関数に与えられる引数は,x,y,z,t,θ,r である.ただし,
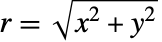 である.ColorFunctionとTextureCoordinateFunctionの関数には,デフォルトで,これらの引数をスケールしたものが与えられる.
- 関数は各曲面上のあらゆるところで評価される.
- デフォルトで,曲面はColorFunction(White&)に相当する均一な白の拡散反射面として扱われる.
- RevolutionPlot3DはGraphics3D[GraphicsComplex[data]]を返す.
- 3D曲面に影響するテーマ
-
"DarkMesh" 色の濃いメッシュライン 
"GrayMesh" グレーのメッシュライン 
"LightMesh" 色の薄いメッシュライン 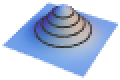
"ZMesh" 垂直に配置されたメッシュライン 
"ThickSurface" 曲面に厚みを与える - 次は,ScalingFunctionsの可能な設定である.
-
{sx,sy,sz} x,y,z の各軸をスケールする {sx,sy,sz,st,sθ,sr} θ パラメータ空間と ϕ パラメータ空間をスケールする - 次は,よく使われる組込みのスケーリング関数 s である.
-
"Log" 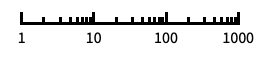
自動目盛ラベル付きの対数スケール "Log10" 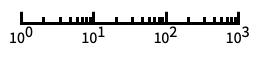
10のベキ乗に目盛が付いた,10を底とする対数スケール "SignedLog" 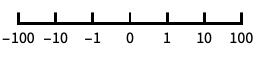
0と負の数を含む対数に似たスケール "Reverse" 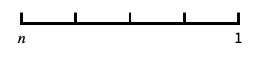
座標の向きを逆にする "Infinite" 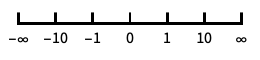
無限スケール - t パラメータ空間あるいは θ パラメータ空間のスケーリングは,プロットのサンプリングに影響するが,全体的なプロットの外観には影響しない.


全オプションのリスト


例題
すべて開く すべて閉じる例 (3)


スコープ (18)
サンプリング (8)
関数が急速に変化するところではより多くの点がサンプルとして取られる:
RevolutionPlot3D[{Sin[t] + Sin[7t] / 10, Cos[t] + Cos[7t] / 10}, {t, 0, Pi}, Mesh -> All]RevolutionPlot3D[1 / t, {t, 0, 1}]RevolutionPlot3D[Sqrt[t Sin[2θ]], {t, 0, 1}, {θ, 0, 2Pi}]RevolutionPlot3D[Im[(t Exp[I θ] ^ 5) ^ (1 / 5)], {t, 0, 2}, {θ, 0, 2Pi}, Mesh -> None, ExclusionsStyle -> {None, Red}]PlotPointsとMaxRecursionを使って適応的サンプリングを制御する:
Grid[Table[RevolutionPlot3D[Sin[t], {t, 0, 2Pi}, PlotPoints -> pp, MaxRecursion -> mr], {mr, {0, 2}}, {pp, {5, 10}}]]PlotRangeを使って関心領域に焦点を当てる:
{RevolutionPlot3D[Sin[t]t, {t, 0, 20}],
RevolutionPlot3D[Sin[t]t, {t, 0, 20}, PlotRange -> {0, 3}]}Exclusionsを使って点を除いたり結果の曲面を分断したりする:
RevolutionPlot3D[1 / (t - 1), {t, 0, 2}, Exclusions -> {t == 1}, Axes -> None, Mesh -> None]RevolutionPlot3D[{{t, -t}, {t, t ^ 2}}, {t, 0, 1}]プレゼンテーション (10)
RevolutionPlot3D[{{t, t ^ 2}, {t, -t ^ 2}}, {t, 0, 1}, PlotStyle -> {Directive[Red, Specularity[White, 20]], Directive[Cyan, Specularity[White, 20]]}]RevolutionPlot3D[{{t, Sin[t] ^ 2}, {t, Cos[t] ^ 2}}, {t, 0, π}, PlotLegends -> "Expressions"]RevolutionPlot3D[{t, t ^ 2}, {t, 0, 2}, AxesLabel -> {x, y}, PlotLabel -> z == t ^ 2, AxesEdge -> {{-1, -1}, {1, -1}, {-1, -1}}]曲面にインタラクティブなTooltipを与える:
RevolutionPlot3D[Tooltip[{t, t}, "cone"], {t, -2, 2}, ColorFunction -> "Rainbow"]RevolutionPlot3D[{Sin[t] + Sin[5t] / 10, Cos[t] + Cos[5t] / 10}, {t, 0, Pi}, Mesh -> 10, MeshStyle -> {Cyan, Directive[Green, Dashed]}, PlotStyle -> Gray]RevolutionPlot3D[{Sin[t] + Sin[5t] / 10, Cos[t] + Cos[5t] / 10}, {t, 0, Pi}, Mesh -> 25, MeshShading -> {{Red, Yellow}, {Pink, Orange}}]RevolutionPlot3D[{Sin[t] + Sin[5t] / 10, Cos[t] + Cos[5t] / 10}, {t, 0, Pi}, Mesh -> 25, ColorFunction -> Function[{x, y, z, t, θ, r}, Hue[θ ]]]RevolutionPlot3D[{Sin[t] + Sin[5t] / 10, Cos[t] + Cos[5t] / 10}, {t, 0, Pi}, Mesh -> 25, ColorFunction -> (ColorData["Rainbow"][#6]&)]RevolutionPlot3D[{Sin[t] + Sin[5t] / 10, Cos[t] + Cos[5t] / 10}, {t, 0, Pi}, RegionFunction -> Function[{x, y, z, t, θ, r}, Sin[8t]Sin[8θ] > 0.1], Mesh -> None, PlotStyle -> FaceForm[Red, Cyan], PlotPoints -> 35, BoundaryStyle -> Yellow]RevolutionPlot3D[{Sin[t] + Sin[5t] / 10, Cos[t] + Cos[5t] / 10}, {t, 0, Pi}, PlotTheme -> "Marketing"]RevolutionPlot3D[t, {t, 0, 40}, BoxRatios -> {1, 1, 1}, ScalingFunctions -> {None, None, "Reverse"}]オプション (97)
Axes (3)
デフォルトで,Axesが描かれる:
RevolutionPlot3D[{Sin[t] + Sin[5t] / 10, Cos[t] + Cos[5t] / 10}, {t, 0, Pi}]RevolutionPlot3D[{Sin[t] + Sin[5t] / 10, Cos[t] + Cos[5t] / 10}, {t, 0, Pi}, Axes -> False]{RevolutionPlot3D[{Sin[t] + Sin[5t] / 10, Cos[t] + Cos[5t] / 10}, {t, 0, Pi}, Axes -> {True, False, False}], RevolutionPlot3D[{Sin[t] + Sin[5t] / 10, Cos[t] + Cos[5t] / 10}, {t, 0, Pi}, Axes -> {False, True, False}], RevolutionPlot3D[{Sin[t] + Sin[5t] / 10, Cos[t] + Cos[5t] / 10}, {t, 0, Pi}, Axes -> {False, False, True}]}AxesLabel (3)
RevolutionPlot3D[{Sin[t] + Sin[5t] / 10, Cos[t] + Cos[5t] / 10}, {t, 0, Pi}]
RevolutionPlot3D[{Sin[t] + Sin[5t] / 10, Cos[t] + Cos[5t] / 10}, {t, 0, Pi}, AxesLabel -> z]RevolutionPlot3D[{Sin[t] + Sin[5t] / 10, Cos[t] + Cos[5t] / 10}, {t, 0, Pi}, AxesLabel -> {x, y, z}]AxesOrigin (2)
AxesStyle (4)
RevolutionPlot3D[{Sin[t] + Sin[5t] / 10, Cos[t] + Cos[5t] / 10}, {t, 0, Pi}, AxesStyle -> Red]RevolutionPlot3D[{Sin[t] + Sin[5t] / 10, Cos[t] + Cos[5t] / 10}, {t, 0, Pi}, AxesStyle -> {{Thick, Brown}, {Thick, Blue}, {Thick, Green}}]RevolutionPlot3D[{Sin[t] + Sin[5t] / 10, Cos[t] + Cos[5t] / 10}, {t, 0, Pi}, AxesStyle -> Green, TicksStyle -> Blue]RevolutionPlot3D[{Sin[t] + Sin[5t] / 10, Cos[t] + Cos[5t] / 10}, {t, 0, Pi}, AxesStyle -> Green, LabelStyle -> Blue]BoundaryStyle (4)
BoundaryStyleは自動的にMeshStyleにマッチする:
RevolutionPlot3D[t, {t, 0, 1}, MeshStyle -> Red]RevolutionPlot3D[t, {t, 0, 1}, MeshStyle -> None]RevolutionPlot3D[t, {t, 0, 1}, BoundaryStyle -> Directive[Thick, Red]]曲面がRegionFunctionによって切り取られたところに境界が描かれる:
RevolutionPlot3D[t, {t, 0, 2Pi}, BoundaryStyle -> Red, RegionFunction -> Function[{x, y, z, t, θ}, Sin[3t]Sin[3θ] > 0]]曲面がExclusionsによって切り取られたところには境界は描かれない:
RevolutionPlot3D[Im[(t Exp[I θ] ^ 5) ^ (1 / 5)], {t, 0, 2}, {θ, 0, 2Pi}, BoundaryStyle -> Red]BoxRatios (3)
デフォルトのBoxRatiosはPlotが使うAspectRatioを保つ:
{Plot[Sin[x], {x, 0, 2Pi}], RevolutionPlot3D[Sin[x], {x, 0, 2Pi}, {θ, 0, Pi / 2}, ViewPoint -> Front]}デフォルトのBoxRatiosは回転した円を保存する:
RevolutionPlot3D[Sin[x], {x, 0, 2Pi}, {θ, 0, 2Pi / 3}, ViewPoint -> Top]特定のBoxRatiosを使う:
RevolutionPlot3D[Sin[x], {x, 0, 2Pi}, {θ, 0, 2Pi / 3}, BoxRatios -> {1, 1, 1}]ColorFunction (5)


Table[RevolutionPlot3D[{Sin[t], Cos[t]}, {t, 0, Pi}, {θ, 0, 2Pi}, ColorFunction -> Function[{x, y, z, t, θ, r}, Evaluate[f]], PlotLabel -> f, Axes -> None], {f, {Hue[x], Hue[y], Hue[z], Hue[t], Hue[θ], Hue[r]}}]定義済みの色階調度にColorDataを使う:
RevolutionPlot3D[Cos[t], {t, 0, 3Pi / 2}, ColorFunction -> Function[{x, y, z, t, θ, r}, ColorData["Rainbow"][r]]]
RevolutionPlot3D[Cos[t], {t, 0, 3Pi / 2}, ColorFunction -> "Rainbow"]ColorFunctionはPlotStyleよりも優先順位が高い:
RevolutionPlot3D[Cos[t], {t, 0, 3Pi / 2}, ColorFunction -> "Rainbow", PlotStyle -> Directive[Opacity[0.5], Red]]ColorFunctionはMeshShadingよりも優先順位が低い:
RevolutionPlot3D[Cos[t], {t, 0, 3Pi / 2}, ColorFunction -> Function[{x, y, z, t, θ, r}, Hue[z]], MeshShading -> {{Automatic, None}, {None, Automatic}}]ColorFunctionScaling (1)


EvaluationMonitor (2)
RevolutionPlot3Dが{t,θ}座標のどこで関数をサンプルするかを示す:
ListPolarPlot[Reap[RevolutionPlot3D[Cos[t], {t, 0, 3Pi / 2}, {θ, 0, 2Pi}, EvaluationMonitor :> Sow[{θ, t}]]][[-1, 1]]]
Block[{k = 0}, RevolutionPlot3D[Cos[t], {t, 0, 3Pi / 2}, EvaluationMonitor :> k++];k]Exclusions (5)
自動メソッドで除外部分,この場合は分枝切断線からの除外部分を計算する:
RevolutionPlot3D[Im[(t Exp[I θ] ^ 5) ^ (1 / 5)], {t, 0, 2}, {θ, 0, 2Pi}]RevolutionPlot3D[Im[(t Exp[I θ] ^ 5) ^ (1 / 5)], {t, 0, 2}, {θ, 0, 2Pi}, Exclusions -> None]RevolutionPlot3D[1 / (t - 1), {t, 0, 2}, Exclusions -> {t == 1}, PlotRange -> 2, Mesh -> None]RevolutionPlot3D[Tan[θ] / (t - 1), {t, 0, 5}, {θ, 0, 2Pi}, Exclusions -> {Cos[θ] == 0, t == 1}, PlotRange -> 5, Mesh -> None]RevolutionPlot3D[Im[Sqrt[-t Exp[I θ]]] / (t - 1), {t, 0, 2}, {θ, 0, 2Pi}, Exclusions -> {Automatic, t == 1}, PlotRange -> 2, Mesh -> False]ExclusionsStyle (2)
RevolutionPlot3D[Im[(t Exp[I θ] ^ 5) ^ (1 / 5)], {t, 0, 2}, {θ, 0, 2Pi}, Mesh -> None, ExclusionsStyle -> {None, Directive[Blue, Thick]}]RevolutionPlot3D[Im[(t Exp[I θ] ^ 5) ^ (1 / 5)], {t, 0, 2}, {θ, 0, 2Pi}, Mesh -> {5, 0}, ExclusionsStyle -> {Yellow, Directive[Thick, Blue]}]ImageSize (7)
Tiny,Small,Medium,Largeのような名前付きのサイズを使う:
{RevolutionPlot3D[{Sin[t] + Sin[5t] / 10, Cos[t] + Cos[5t] / 10}, {t, 0, Pi}, ImageSize -> Tiny], RevolutionPlot3D[{Sin[t] + Sin[5t] / 10, Cos[t] + Cos[5t] / 10}, {t, 0, Pi}, ImageSize -> Small]}{RevolutionPlot3D[{Sin[t] + Sin[5t] / 10, Cos[t] + Cos[5t] / 10}, {t, 0, Pi}, ImageSize -> 150], RevolutionPlot3D[{Sin[t] + Sin[5t] / 10, Cos[t] + Cos[5t] / 10}, {t, 0, Pi}, AspectRatio -> 1.5, ImageSize -> 150]}{RevolutionPlot3D[{Sin[t] + Sin[5t] / 10, Cos[t] + Cos[5t] / 10}, {t, 0, Pi}, ImageSize -> {Automatic, 150}], RevolutionPlot3D[{Sin[t] + Sin[5t] / 10, Cos[t] + Cos[5t] / 10}, {t, 0, Pi}, AspectRatio -> 2, ImageSize -> {Automatic, 150}]}{RevolutionPlot3D[{Sin[t] + Sin[5t] / 10, Cos[t] + Cos[5t] / 10}, {t, 0, Pi}, ImageSize -> UpTo[200]], RevolutionPlot3D[{Sin[t] + Sin[5t] / 10, Cos[t] + Cos[5t] / 10}, {t, 0, Pi}, AspectRatio -> 2, ImageSize -> UpTo[200]]}グラフィックスの幅と高さを指定して,必要な場合はスペースで充填する:
RevolutionPlot3D[{Sin[t] + Sin[5t] / 10, Cos[t] + Cos[5t] / 10}, {t, 0, Pi}, ImageSize -> {200, 250}, Background -> StandardGray]AspectRatioFullと設定すると,使用可能なスペースが塗り潰される:
RevolutionPlot3D[{Sin[t] + Sin[5t] / 10, Cos[t] + Cos[5t] / 10}, {t, 0, Pi}, AspectRatio -> Full, ImageSize -> {200, 250}, Background -> StandardGray]{RevolutionPlot3D[{Sin[t] + Sin[5t] / 10, Cos[t] + Cos[5t] / 10}, {t, 0, Pi}, ImageSize -> {UpTo[150], UpTo[100]}], RevolutionPlot3D[{Sin[t] + Sin[5t] / 10, Cos[t] + Cos[5t] / 10}, {t, 0, Pi}, AspectRatio -> 2, ImageSize -> {UpTo[150], UpTo[100]}]}ImageSizeFullを使ってオブジェクト内の使用可能なスペースを塗り潰す:
Framed[Pane[RevolutionPlot3D[{Sin[t] + Sin[5t] / 10, Cos[t] + Cos[5t] / 10}, {t, 0, Pi}, ImageSize -> Full, Background -> StandardGray], {200, 100}]]Framed[Pane[RevolutionPlot3D[{Sin[t] + Sin[5t] / 10, Cos[t] + Cos[5t] / 10}, {t, 0, Pi}, AspectRatio -> Full, ImageSize -> {Scaled[0.5], Scaled[0.5]}, Background -> StandardGray], {200, 200}]]MaxRecursion (1)
Mesh (5)
{RevolutionPlot3D[Cos[t], {t, 0, 3Pi / 2}, Mesh -> Full], RevolutionPlot3D[Cos[t], {t, 0, 3Pi / 2}, Mesh -> All]}パラメータ方向に等間隔に置かれた10のメッシュレベルを使う:
RevolutionPlot3D[Cos[t], {t, 0, 3Pi / 2}, {θ, 0, 2Pi}, Mesh -> 10]RevolutionPlot3D[Cos[t], {t, 0, 3Pi / 2}, {θ, 0, 2Pi}, Mesh -> {5, 20}] パラメータではメッシュに明示的な値のリストを使い,
 パラメータではメッシュを使わない:
RevolutionPlot3D[Cos[t], {t, 0, 3Pi / 2}, {θ, 0, 2Pi}, Mesh -> {Range[0, 3Pi / 2, Pi / 8], 0}]
RevolutionPlot3D[Cos[t], {t, 0, 3Pi / 2}, {θ, 0, 2Pi}, MeshFunctions -> {#4&}, Mesh -> {{{1, Thick}, {2, Directive[Thick, Red]}}}]MeshFunctions (2)


Table[RevolutionPlot3D[{Sin[t] + Sin[5t] / 10, Cos[t] + Cos[5t] / 10}, {t, 0, Pi}, BoundaryStyle -> None, MeshFunctions -> {Function[{x, y, z, t, θ, r}, Evaluate[f]]}, Mesh -> 10, PlotLabel -> f, Axes -> None], {f, {x, y, z, t, θ, r}}] 方向に赤で5本のメッシュレベルを,
 方向に青で10本のメッシュレベルを使う:
RevolutionPlot3D[{Sin[t] + Sin[5t] / 10, Cos[t] + Cos[5t] / 10}, {t, 0, Pi}, Mesh -> {5, 10}, MeshFunctions -> {#4&, #5&}, MeshStyle -> {Red, Blue}]MeshShading (7)

RevolutionPlot3D[{Sin[t] + Sin[5t] / 10, Cos[t] + Cos[5t] / 10}, {t, 0, Pi}, Mesh -> 15, MeshFunctions -> {#5&}, MeshShading -> {Red, Blue}]Noneを使って線分を除く:
RevolutionPlot3D[{Sin[t] + Sin[5t] / 10, Cos[t] + Cos[5t] / 10}, {t, 0, Pi}, Mesh -> 15, MeshFunctions -> {#5&}, MeshShading -> {Red, None}]MeshShadingは,スタイリングに関してはPlotStyleより優先順位が高い:
RevolutionPlot3D[{Sin[t] + Sin[5t] / 10, Cos[t] + Cos[5t] / 10}, {t, 0, Pi}, Mesh -> 15, MeshFunctions -> {#5&}, PlotStyle -> Green, MeshShading -> {Red, Blue}]MeshShadingをAutomaticに設定し,線分にPlotStyleを使う:
RevolutionPlot3D[{Sin[t] + Sin[5t] / 10, Cos[t] + Cos[5t] / 10}, {t, 0, Pi}, Mesh -> 15, MeshFunctions -> {#5&}, PlotStyle -> Directive[Opacity[0.5], Yellow], MeshShading -> {Red, Automatic}]MeshShadingはColorFunctionと一緒に使うことができる:
RevolutionPlot3D[{Sin[t] + Sin[5t] / 10, Cos[t] + Cos[5t] / 10}, {t, 0, Pi}, Mesh -> 15, MeshFunctions -> {#5&}, ColorFunction -> Function[{x, y, z, t, θ, r}, Hue[t]], MeshShading -> {StandardGray, Automatic}]RevolutionPlot3D[{Sin[t] + Sin[5t] / 10, Cos[t] + Cos[5t] / 10}, {t, 0, Pi}, ColorFunction -> Function[{x, y, z, t, θ, r}, Hue[r]], Mesh -> 15, MeshShading -> {{StandardGray, Automatic}, {None, Orange}}]FaceFormを使って曲面の異なる辺に異なるスタイルを使う:
RevolutionPlot3D[{Sin[t] + Sin[5t] / 10, Cos[t] + Cos[5t] / 10}, {t, 0, Pi}, MeshShading -> {{FaceForm[Red, None], FaceForm[None, Blue]}, {FaceForm[None, Cyan], FaceForm[Orange, None]}}]MeshStyle (2)

RevolutionPlot3D[{Sin[t] + Sin[5t] / 10, Cos[t] + Cos[5t] / 10}, {t, 0, Pi}, MeshFunctions -> {#1&}, MeshStyle -> Red, BoundaryStyle -> None]

RevolutionPlot3D[{Sin[t] + Sin[5t] / 10, Cos[t] + Cos[5t] / 10}, {t, 0, Pi}, MeshFunctions -> {#1&, #2&}, MeshStyle -> {Red, Blue}]NormalsFunction (3)
RevolutionPlot3D[{Sin[t] + Sin[5t] / 10, Cos[t] + Cos[5t] / 10}, {t, 0, Pi}, Mesh -> None]Noneを使ってすべての多面体に平坦な陰影付けを行う:
RevolutionPlot3D[{Sin[t] + Sin[5t] / 10, Cos[t] + Cos[5t] / 10}, {t, 0, Pi}, NormalsFunction -> None, Mesh -> None]RevolutionPlot3D[{Sin[t] + Sin[5t] / 10, Cos[t] + Cos[5t] / 10}, {t, 0, Pi}, Mesh -> None, NormalsFunction -> Function[{x, y, z, t, θ, r}, RandomReal[{0, 1}, {3}]]]PerformanceGoal (2)
Timing[RevolutionPlot3D[{Sin[t] + Sin[5t] / 10, Cos[t] + Cos[5t] / 10}, {t, 0, Pi}, PerformanceGoal -> "Quality"]]Timing[RevolutionPlot3D[{Sin[t] + Sin[5t] / 10, Cos[t] + Cos[5t] / 10}, {t, 0, Pi}, PerformanceGoal -> "Speed"]]PlotLegends (2)
RevolutionPlot3D[{{t, Sin[t] ^ 2}, {t, Cos[t] ^ 2}}, {t, 0, π}, PlotLegends -> Automatic]RevolutionPlot3D[{{t, Sin[t] ^ 2}, {t, Cos[t] ^ 2}}, {t, 0, π}, PlotLegends -> {"one", "two"}]RevolutionPlot3D[{{t, Sin[t] ^ 2}, {t, Cos[t] ^ 2}}, {t, 0, π}, PlotLegends -> "Expressions"]Placedを使って凡例の位置を制御する:
RevolutionPlot3D[{{t, Sin[t] ^ 2}, {t, Cos[t] ^ 2}}, {t, 0, π}, PlotLegends -> Placed[{"one", "two"}, Below]]PlotPoints (1)
PlotStyle (3)
Table[RevolutionPlot3D[{Sin[t] + Sin[5t] / 10, Cos[t] + Cos[5t] / 10}, {t, 0, Pi}, PlotStyle -> ps], {ps, {Red, Directive[Orange, Specularity[White, 50]], Opacity[0.3], Directive[Purple, Opacity[0.5]]}}]RevolutionPlot3D[{{t, -t}, {t, t ^ 2}}, {t, 0, 1}, PlotStyle -> {Yellow, Red}]RevolutionPlot3D[{Sin[t], Cos[t]}, {t, 0, Pi}, {θ, 0, 5Pi / 3}, PlotStyle -> FaceForm[Red, Blue]]PlotTheme (5)
単純な目盛,メッシュライン,明るいカラースキームのテーマを使う:
RevolutionPlot3D[{{t - t ^ 2, t}, {t + t ^ 2, t}}, {t, 0, 1}, PlotTheme -> "Business"]RevolutionPlot3D[{{t - t ^ 2, t}, {t + t ^ 2, t}}, {t, 0, 1}, PlotTheme -> "Business", Ticks -> None]RevolutionPlot3D[{{t - t ^ 2, t}, {t + t ^ 2, t}}, {t, 0, 1}, PlotTheme -> "Monochrome"]RevolutionPlot3D[{{t - t ^ 2, t}, {t + t ^ 2, t}}, {t, 0, 1}, PlotTheme -> {"Monochrome", StandardGreen}]RevolutionPlot3D[t^4 - t^2, {t, 0, 1}, PlotTheme -> "ThickSurface"]RegionFunction (2)


Table[RevolutionPlot3D[{Sin[t] + Sin[5t] / 10, Cos[t] + Cos[5t] / 10}, {t, 0, Pi}, RegionFunction -> Function[{x, y, z, t, θ, r}, Evaluate[f]], Mesh -> None, BoundaryStyle -> Green, PlotRange -> 1.1, Axes -> None, PlotLabel -> f], {f, {0 < x < 1, 0 < y < 1, 0 < z < 1, 0 < t < 1, 0 < θ < Pi / 2, 1 / 2 < r < 1}}]RevolutionPlot3D[{Sin[t] + Sin[5t] / 10, Cos[t] + Cos[5t] / 10}, {t, 0, Pi}, RegionFunction -> (Sin[5(#4 + #5)] > 0&), Mesh -> None, BoundaryStyle -> Green]RevolutionAxis (2)
RevolutionPlot3Dは,デフォルトで, 軸の周りを回転する:
RevolutionPlot3D[t^4 - t^2, {t, 0, 1}]
RevolutionPlot3D[t^4 - t^2, {t, 0, 1}, RevolutionAxis -> "X"]RevolutionPlot3D[t^4 - t^2, {t, 0, 1}, RevolutionAxis -> {1, 1}]ScalingFunctions (3)
RevolutionPlot3D[t, {t, 0, 40}, BoxRatios -> {1, 1, 1}]RevolutionPlot3D[t, {t, 0, 40}, BoxRatios -> {1, 1, 1}, ScalingFunctions -> {None, None, "Log"}]ScalingFunctionsを使って  方向の座標の向きを逆にする:
RevolutionPlot3D[t, {t, 0, 40}, BoxRatios -> {1, 1, 1}, ScalingFunctions -> {None, None, "Reverse"}]TextureCoordinateFunction (4)
テクスチャはデフォルトでスケールされた  と
 のパラメータを使う:
RevolutionPlot3D[{Sin[t] + Sin[5t] / 5, Cos[t] + Cos[5t] / 5}, {t, 0, Pi}, Mesh -> None, PlotStyle -> Texture[ExampleData[{"ColorTexture", "TriWeavePattern"}]]]

RevolutionPlot3D[{Sin[t] + Sin[5t] / 5, Cos[t] + Cos[5t] / 5}, {t, 0, Pi}, Mesh -> None, TextureCoordinateFunction -> ({#1, #2}&), PlotStyle -> Texture[ExampleData[{"ColorTexture", "TriWeavePattern"}]]]RevolutionPlot3D[{Sin[t] + Sin[5t] / 5, Cos[t] + Cos[5t] / 5}, {t, 0, Pi}, Mesh -> None, TextureCoordinateScaling -> False, PlotStyle -> Texture[ExampleData[{"ColorTexture", "TriWeavePattern"}]]]テクスチャを使ってパラメータがどのように曲面にマップするかをハイライトする:
texture = ArrayPlot[{{1, 1, 1, 2, 1, 1}, {2, 0, 0, 2, 0, 0}, {2, 0, 0, 2, 0, 0}, {2, 1, 1, 1, 1, 1}, {2, 0, 0, 2, 0, 0}, {2, 0, 0, 2, 0, 0}}, ColorRules -> {1 -> Red, 2 -> Blue, 0 -> White}, Frame -> False, PlotRangePadding -> None, ImagePadding -> None, ImageSize -> 100]RevolutionPlot3D[{Sin[t] + Sin[5t] / 5, Cos[t] + Cos[5t] / 5}, {t, 0, Pi}, Mesh -> None, TextureCoordinateScaling -> False, PlotStyle -> Texture[texture]]TextureCoordinateScaling (1)
テクスチャにスケールされた座標とスケールされていない座標を使う:
texture = ArrayPlot[{{1, 1, 1, 2, 1, 1}, {2, 0, 0, 2, 0, 0}, {2, 0, 0, 2, 0, 0}, {2, 1, 1, 1, 1, 1}, {2, 0, 0, 2, 0, 0}, {2, 0, 0, 2, 0, 0}}, ColorRules -> {1 -> Red, 2 -> Blue, 0 -> White}, Frame -> False, PlotRangePadding -> None, ImagePadding -> None, ImageSize -> 100]Table[RevolutionPlot3D[{Sin[t] + Sin[5t] / 5, Cos[t] + Cos[5t] / 5}, {t, 0, Pi}, Mesh -> None, TextureCoordinateScaling -> s, PlotStyle -> Texture[texture], PlotLabel -> s], {s, {True, False}}]Ticks (6)
RevolutionPlot3D[{2 + Cos[t], Sin[t]}, {t, 0, 2 Pi}]RevolutionPlot3D[{2 + Cos[t], Sin[t]}, {t, 0, 2 Pi}, Ticks -> None]RevolutionPlot3D[{2 + Cos[t], Sin[t]}, {t, 0, 2 Pi}, Ticks -> {{-2, .5, 2}, {-2, 0, 2}, {-1, 0, 1}}]RevolutionPlot3D[{2 + Cos[t], Sin[t]}, {t, 0, 2 Pi}, Ticks -> {{{-2, -a}, {.5, b}, {2, a}}, {{-2, -a}, {0, c}, {2, a}}, {{-1, -d}, {0, c}, {1, d}}}]RevolutionPlot3D[{2 + Cos[t], Sin[t]}, {t, 0, 2 Pi}, Ticks -> {{{-2, -a, .12}, {.5, b, .08}, {2, a, .15}}, {{-2, -a, .16}, {0, c, .06}, {2, a, .07}}, {{-1, -d, .05}, {0, c, .05}, {1, d, .05}}}]RevolutionPlot3D[{2 + Cos[t], Sin[t]}, {t, 0, 2 Pi}, Ticks -> {{{-2, -a, .12, Directive[Blue]}, {.5, b, .08, Directive[Blue]}, {2, a, .15, Directive[Thick, Blue]}}, {{-2, -a, .16, Directive[Thick, Red]}, {0, c, .06, Directive[Thick, Red]}, {2, a, .07, Directive[Thick, Red]}}, {{-1, -d, .05, Directive[Thick, Green]}, {0, c, .05, Directive[Thick, Darker@Green]}, {1, d, .05, Directive[Thick, Green]}}}]TicksStyle (3)
デフォルトで,目盛と目盛ラベルには軸と同じスタイルが使われる:
RevolutionPlot3D[{2 + Cos[t], Sin[t]}, {t, 0, 2 Pi}, AxesStyle -> Directive[Red, 12]]RevolutionPlot3D[{2 + Cos[t], Sin[t]}, {t, 0, 2 Pi}, TicksStyle -> Directive[Red, 12]]RevolutionPlot3D[{2 + Cos[t], Sin[t]}, {t, 0, 2 Pi}, TicksStyle -> {Directive[Red, 14], Directive[Blue, 14], Directive[Green, 14]}]WorkingPrecision (2)
RevolutionPlot3D[{Sin[t] + Sin[5(t + 10 ^ 17)] / 10, Cos[t] + Cos[5(t + 10 ^ 17)] / 10}, {t, 0, Pi}]RevolutionPlot3D[{Sin[t] + Sin[5(t + 10 ^ 17)] / 10, Cos[t] + Cos[5(t + 10 ^ 17)] / 10}, {t, 0, Pi}, WorkingPrecision -> 20]アプリケーション (4)
RevolutionPlot3D[{1, t}, {t, 0, 1}]RevolutionPlot3D[{t, t}, {t, 0, 1}]RevolutionPlot3D[{Cos[t], Sin[t]}, {t, -Pi / 2, Pi / 2}]RevolutionPlot3D[{2 + Cos[t], Sin[t]}, {t, 0, 2Pi}]RevolutionPlot3D[{{t, t}, {t, 1}}, {t, 0, 1}]Pi Integrate[t ^ 2, {t, 0, 1}]Table[RevolutionPlot3D[Cos[(π i/10)] BesselJ[0, t], {t, 0, 10}, PlotRange -> {All, All, {-1, 1}}, Boxed -> False, Axes -> False, Mesh -> None], {i, 1, 8}]ListAnimate[%]RevolutionPlot3D[{(2 + Cos[v / 2] Sin[u] - Sin[v / 2] Sin[2 u]) Cos[v], (2 + Cos[v / 2] Sin[u] - Sin[v / 2] Sin[2 u]) Sin[v], Sin[v / 2] Sin[u] + Cos[v / 2] Sin[2 u]}, {u, 0, 2 Pi}, {v, 0, 2 Pi}, Mesh -> None, PlotStyle -> Directive[Specularity[White, 30], Opacity[0.8], Red], Boxed -> False, Axes -> False, PlotPoints -> 60]特性と関係 (8)
RevolutionPlot3DはParametricPlot3Dの特殊ケースである:
{RevolutionPlot3D[t, {t, 0, 3}, {θ, 0, 5Pi / 3}], ParametricPlot3D[{t Cos[θ], t Sin[θ], t}, {t, 0, 3}, {θ, 0, 5Pi / 3}, BoxRatios -> {1, 1, 1 / (2GoldenRatio)}]}デフォルトのBoxRatiosはPlotが使うAspectRatioを保存する:
{Plot[Sin[x], {x, 0, 2Pi}], RevolutionPlot3D[Sin[x], {x, 0, 2Pi}, {θ, 0, Pi / 2}, ViewPoint -> Front, Mesh -> None, BoundaryStyle -> Thick]}デフォルトのBoxRatiosは回転した円を保存する:
RevolutionPlot3D[Sin[x], {x, 0, 2Pi}, {θ, 0, 2Pi / 3}, ViewPoint -> Top]球座標にSphericalPlot3Dを使う:
SphericalPlot3D[1 + 1 / 5Sin[3v], {u, 0, Pi}, {v, 0, 2Pi}]三次元の任意の曲線と曲面にParametricPlot3Dを使う:
ParametricPlot3D[Evaluate[{Cos[u], Sin[u], -u / 5} / Sqrt[1 + (u / 5) ^ 2]], {u, -20, 20}]ParametricPlot3D[{u - u ^ 3 / 3 + u v ^ 2, -v - u ^ 2v + v ^ 3 / 3, u ^ 2 - v ^ 2}, {u, -1.5, 1.5}, {v, -1.5, 1.5}]極座標の曲線にPolarPlotを使う:
PolarPlot[Sin[4t], {t, 0, 2Pi}]二次元の曲線と範囲にParametricPlotを使う:
{ParametricPlot[{u Cos[u], u Sin[u]}, {u, 0, 4Pi}],
ParametricPlot[{(u + v) Cos[u], (u + v) Sin[u]}, {u, 0, 4Pi}, {v, 0, 3}]}陰的に定義された曲面と範囲にContourPlot3DとRegionPlot3Dを使う:
ContourPlot3D[x ^ 2 + y ^ 2 == z ^ 2, {x, -2, 2}, {y, -2, 2}, {z, -2, 2}]RegionPlot3D[x ^ 2 + y ^ 2 < z ^ 2, {x, -2, 2}, {y, -2, 2}, {z, -2, 2}]データにListPlot3DとListSurfacePlot3Dを使う:
ListPlot3D[Table[Sin[x y], {x, 0, 3, 0.1}, {y, 0, 3, 0.1}]]ListSurfacePlot3D[Table[{x = RandomReal[{-1, 1}], y = RandomReal[{-1, 1}], RandomChoice[{-1, 1}]Sqrt[1 - x ^ 2 - y ^ 2]}, {1000}]]考えられる問題 (1)
テキスト
Wolfram Research (2007), RevolutionPlot3D, Wolfram言語関数, https://reference.wolfram.com/language/ref/RevolutionPlot3D.html (2022年に更新).
CMS
Wolfram Language. 2007. "RevolutionPlot3D." Wolfram Language & System Documentation Center. Wolfram Research. Last Modified 2022. https://reference.wolfram.com/language/ref/RevolutionPlot3D.html.
APA
Wolfram Language. (2007). RevolutionPlot3D. Wolfram Language & System Documentation Center. Retrieved from https://reference.wolfram.com/language/ref/RevolutionPlot3D.html