


GeoGraphPlot
GeoGraphPlot[{e1,e2,…}]
generates a plot of the geographic graph with edges ei.
GeoGraphPlot[{v1,v2,…},{e1,e2,…}]
generates a plot with vertices vi and edges ej.
GeoGraphPlot[{vi vj ,…}]
uses rules vivj to specify the graph.
GeoGraphPlot[g]
displays the graph g with vertices at geographic locations on a map.
GeoGraphPlot[{…,w[ei],…}]
plots ei with features defined by the symbolic wrapper w.
Details and Options
- GeoGraphPlot shows the network between locations on a map by placing geographic objects as the vertices and the connections between them as edges. The edges generally do not correspond to particular routes between the locations.
- An undirected edge ei between vertices u and v can be given as uv, u<->v, UndirectedEdge[u,v] or TwoWayRule[u,v]. The character can be entered as
 ue
ue .
. - A directed edge ei from u to v can be given as uv, u->v, DirectedEdge[u,v] or Rule[u,v]. The character can be entered as
 de
de .
. - The geographic vertices vi can be given in the following forms:
-
GeoPosition[{lat,lon}] latitude and longitude Entity[…] geographic entity Dated[ent,date] dated entity Image[…] geo-tagged image - The option VertexCoordinates can be used to specify geo locations for vertices that do not already contain them.
- The following special wrappers can be used for vertices and edges:
-
Annotation[a,label] provide an annotation Button[a,action] define an action to execute when the element is clicked EventHandler[a,…] define a general event handler for the element Hyperlink[a,uri] make the element act as a hyperlink Labeled[a,…] display the element with labeling PopupWindow[a,cont] attach a popup window to the element StatusArea[a,label] display in the status area when the element is moused over Style[a,opts] show the element using the specified styles Tooltip[a,label] attach an arbitrary tooltip to the element - GeoGraphPlot has the same options as GeoGraphics with the following additions and changes: [List of all options]
-
AnnotationRules {} annotations for graph, edges and vertices DirectedEdges False whether to interpret Rule as DirectedEdge EdgeLabels None labels and placements for edges EdgeLabelStyle Automatic style to use for edge labels EdgeShapeFunction Automatic generate graphic shapes for edges EdgeStyle Automatic styles for edges GraphHighlight {} vertices and edges to highlight GraphHighlightStyle Automatic style for highlight GraphLayout Automatic how to layout graph elements Method Automatic method to use PerformanceGoal Automatic aspects of performance to try to optimize PlotStyle Automatic graphics directives to determine styles PlotTheme Automatic overall theme for the graph VertexCoordinates Automatic coordinates for vertices VertexLabels None labels and placements for vertices VertexLabelStyle Automatic style to use for vertex labels VertexShape Automatic graphic shape for vertices VertexShapeFunction Automatic generate graphic shapes for vertices VertexSize Automatic size of vertices VertexStyle Automatic styles for vertices - GraphLayout specifies where to draw the edges connecting geographic locations.
- Possible settings for GraphLayout include:
-

Automatic automatically compute edges 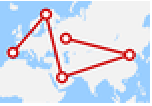
"StraightLine" use straight lines as edges 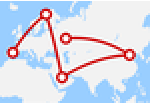
"Geodesic" use geodesics as edges 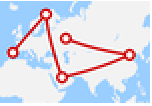
"Rhumb" use Rhumb lines as edges 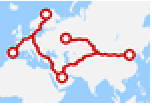
"Driving","Walking","Cycling" transportation methods - By default, the edges generated by GeoGraphPlot are abstract paths, showing self-loops and multiple edges between two vertices when present in the graph.
- If a travel path cannot be found between two vertices, the edge will use "StraightLine" instead.
- EdgeShapeFunctionfunc specifies that each vertex should be rendered with the primitives provided by func[{pt1,pt2},vw], where pt1 and pt2 are the geographic locations of the vertices for the edge vw.
- VertexCoordinates can use the following forms to provide geo locations to vertices:
-
{loc1,loc2,…} place vertex v1 at location loc1 etc. GeoPosition[{pos1,pos2,…}] array of geodetic positions {v1loc1,…} place vertex v1 at location loc1 etc. - The loci in VertexCoordinates can be geo locations, entities, geo-tagged images, etc.
- VertexLabelsAutomatic automatically labels vertices that are named locations. Vertices that are specified using latitude and longitude are left unlabeled.
- Graph features themes affect the plot of vertices and edges. Feature themes include:
-
"LargeGraph" large graph 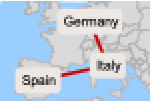
"NameLabeled" classic graph 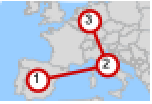
"IndexLabeled" index-labeled graph
List of all options
Examples
open all close allBasic Examples (3)
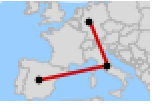
Plot a graph of cities in Europe:
GeoGraphPlot[{Entity["City", {"Rome", "Lazio", "Italy"}]Entity["City", {"Milan", "Lombardy", "Italy"}], Entity["City", {"Milan", "Lombardy", "Italy"}]Entity["City", {"Paris", "IleDeFrance", "France"}], Entity["City", {"Milan", "Lombardy", "Italy"}]Entity["City", {"Frankfurt", "Hesse", "Germany"}], Entity["City", {"Paris", "IleDeFrance", "France"}]Entity["City", {"Frankfurt", "Hesse", "Germany"}], Entity["City", {"Paris", "IleDeFrance", "France"}]Entity["City", {"Madrid", "Madrid", "Spain"}], Entity["City", {"Paris", "IleDeFrance", "France"}]Entity["City", {"London", "GreaterLondon", "UnitedKingdom"}], Entity["City", {"Madrid", "Madrid", "Spain"}]Entity["City", {"Seville", "Seville", "Spain"}], Entity["City", {"Madrid", "Madrid", "Spain"}]Entity["City", {"Barcelona", "Barcelona", "Spain"}]}]Use driving directions to compute the edges between cities:
GeoGraphPlot[IconizedObject[«Europe»], GraphLayout -> "Driving"]The nearest neighbor graph for large cities in Illinois:
graph = NearestNeighborGraph[EntityValue[{Entity["City", {"Chicago", "Illinois", "UnitedStates"}], Entity["City", {"Aurora", "Illinois", "UnitedStates"}], Entity["City", {"Rockford", "Illinois", "UnitedStates"}], Entity["City", {"Joliet", "Illinois", "UnitedStates"}], Entity["City", {"Naperville", "Illinois", "UnitedStates"}], Entity["City", {"Springfield", "Illinois", "UnitedStates"}], Entity["City", {"Peoria", "Illinois", "UnitedStates"}], Entity["City", {"Elgin", "Illinois", "UnitedStates"}]}, "Position"], 3, DistanceFunction -> GeoDistance, DirectedEdges -> False];GeoGraphPlot[graph]Scope (28)
Data (6)
Use geo entities as the vertices in a graph:
GeoGraphPlot[{Entity["Building", "MachuPicchu::3243b"]Entity["Building", "EiffelTower::5h9w8"], Entity["Building", "MachuPicchu::3243b"]Entity["City", {"Reykjavik", "Hofudhborgarsvaedhi", "Iceland"}], Entity["Building", "MachuPicchu::3243b"]Entity["Airport", "YSSY"], Entity["Building", "MachuPicchu::3243b"]Entity["Volcano", "FujiSan"], Entity["Building", "EiffelTower::5h9w8"]Entity["City", {"Reykjavik", "Hofudhborgarsvaedhi", "Iceland"}], Entity["Building", "EiffelTower::5h9w8"]Entity["Airport", "YSSY"], Entity["Building", "EiffelTower::5h9w8"]Entity["Volcano", "FujiSan"], Entity["Airport", "YSSY"]Entity["Volcano", "FujiSan"]}]Use geo locations as the vertices in a graph:
GeoGraphPlot[{GeoPosition[{-13.16, -72.54}]GeoPosition[{48.85, 2.29}], GeoPosition[{-13.16, -72.54}]GeoPosition[{64.14, -21.92}], GeoPosition[{-13.16, -72.54}]GeoPosition[{-33.94, 151.17}], GeoPosition[{-13.16, -72.54}]GeoPosition[{35.35, 138.73}], GeoPosition[{48.85, 2.29}]GeoPosition[{64.14, -21.92}], GeoPosition[{48.85, 2.29}]GeoPosition[{-33.94, 151.17}], GeoPosition[{48.85, 2.29}]GeoPosition[{35.35, 138.73}], GeoPosition[{-33.94, 151.17}]GeoPosition[{35.35, 138.73}]}]Use directed edges to specify the graph:
GeoGraphPlot[{GeoPosition[{48.88, 116.27}]GeoPosition[{34.14, -169.53}], GeoPosition[{48.88, 116.27}]GeoPosition[{16.97, -70.37}], GeoPosition[{48.88, 116.27}]GeoPosition[{-58.80, 160.17}], GeoPosition[{34.14, -169.53}]GeoPosition[{16.97, -70.37}], GeoPosition[{34.14, -169.53}]GeoPosition[{-58.80, 160.17}], GeoPosition[{16.97, -70.37}]GeoPosition[{-58.80, 160.17}]}]Construct a network of international air routes:
graph = VertexReplace[Graph[{"LHR" -> "JFK", "LHR" -> "DXB", "LHR" -> "HKG", "LHR" -> "LAX", "LHR" -> "SIN", "LAX" -> "JFK", "LAX" -> "SYD", "SYD" -> "DXB", "TPE" -> "LAX", "LAX" -> "ICN"}], {"DXB" -> Entity["Airport", "DXB"], "HKG" -> Entity["Airport", "HKG"], "ICN" -> Entity["Airport", "ICN"], "JFK" -> Entity["Airport", "JFK"], "LAX" -> Entity["Airport", "LAX"], "LHR" -> Entity["Airport", "LHR"], "SIN" -> Entity["Airport", "SIN"], "SYD" -> Entity["Airport", "SYD"], "TPE" -> Entity["Airport", "TPE"]}];GeoGraphPlot[graph]Use geo-tagged images as graph vertices:
GeoGraphPlot[{[image], [image], [image], [image], [image], [image], [image], [image], [image], [image], [image], [image], [image], [image], [image], [image], [image], [image], [image]}, {[image][image], [image][image], [image][image], [image][image], [image][image], [image][image], [image][image], [image][image], [image][image]}, VertexLabels -> Placed[Automatic, Tooltip]]Use VertexCoordinates to position vertices:
GeoGraphPlot[{"The Big Apple""Emerald City", "The Big Apple""City of Trees", "The Big Easy""The Big Apple", "Wolfram Headquarters""The Big Apple", "Emerald City""Windy City", "Charm City""Windy City", "Windy City""Wolfram Headquarters", "Wolfram Headquarters""Wolfram Headquarters"}, VertexCoordinates -> {"The Big Apple" -> Entity["City", {"NewYork", "NewYork", "UnitedStates"}], "Emerald City" -> Entity["City", {"Seattle", "Washington", "UnitedStates"}], "City of Trees" -> Entity["City", {"BoiseCity", "Idaho", "UnitedStates"}], "The Big Easy" -> Entity["City", {"Boston", "Massachusetts", "UnitedStates"}], "Windy City" -> Entity["City", {"Chicago", "Illinois", "UnitedStates"}], "Charm City" -> Entity["City", {"Baltimore", "Maryland", "UnitedStates"}], "Wolfram Headquarters" -> Entity["City", {"Champaign", "Illinois", "UnitedStates"}]}]Labeling (5)
Use Labeled to label a particular edge:
edges = {Labeled[Entity["City", {"Paris", "IleDeFrance", "France"}]Entity["City", {"Madrid", "Madrid", "Spain"}], "Paris to Madrid"], Entity["City", {"Rome", "Lazio", "Italy"}]Entity["City", {"Milan", "Lombardy", "Italy"}], Entity["City", {"Milan", "Lombardy", "Italy"}]Entity["City", {"Paris", "IleDeFrance", "France"}], Entity["City", {"Milan", "Lombardy", "Italy"}]Entity["City", {"Frankfurt", "Hesse", "Germany"}], Entity["City", {"Paris", "IleDeFrance", "France"}]Entity["City", {"Frankfurt", "Hesse", "Germany"}], Entity["City", {"Paris", "IleDeFrance", "France"}]Entity["City", {"London", "GreaterLondon", "UnitedKingdom"}], Entity["City", {"Madrid", "Madrid", "Spain"}]Entity["City", {"Seville", "Seville", "Spain"}], Entity["City", {"Madrid", "Madrid", "Spain"}]Entity["City", {"Barcelona", "Barcelona", "Spain"}]};GeoGraphPlot[edges]Specify edge labels with the EdgeLabels option:
GeoGraphPlot[{Entity["City", {"Rome", "Lazio", "Italy"}]Entity["City", {"Milan", "Lombardy", "Italy"}], Entity["City", {"Milan", "Lombardy", "Italy"}]Entity["City", {"Paris", "IleDeFrance", "France"}], Entity["City", {"Milan", "Lombardy", "Italy"}]Entity["City", {"Frankfurt", "Hesse", "Germany"}], Entity["City", {"Paris", "IleDeFrance", "France"}]Entity["City", {"Frankfurt", "Hesse", "Germany"}], Entity["City", {"Paris", "IleDeFrance", "France"}]Entity["City", {"Madrid", "Madrid", "Spain"}], Entity["City", {"Paris", "IleDeFrance", "France"}]Entity["City", {"London", "GreaterLondon", "UnitedKingdom"}], Entity["City", {"Madrid", "Madrid", "Spain"}]Entity["City", {"Seville", "Seville", "Spain"}], Entity["City", {"Madrid", "Madrid", "Spain"}]Entity["City", {"Barcelona", "Barcelona", "Spain"}]}, EdgeLabels -> {Entity["City", {"Paris", "IleDeFrance", "France"}]Entity["City", {"Milan", "Lombardy", "Italy"}] -> "Paris to Milan"}]edges = {Entity["City", {"Rome", "Lazio", "Italy"}]Entity["City", {"Milan", "Lombardy", "Italy"}], Entity["City", {"Milan", "Lombardy", "Italy"}]Entity["City", {"Paris", "IleDeFrance", "France"}], Entity["City", {"Milan", "Lombardy", "Italy"}]Entity["City", {"Frankfurt", "Hesse", "Germany"}], Entity["City", {"Paris", "IleDeFrance", "France"}]Entity["City", {"Frankfurt", "Hesse", "Germany"}], Entity["City", {"Paris", "IleDeFrance", "France"}]Entity["City", {"Madrid", "Madrid", "Spain"}], Entity["City", {"Paris", "IleDeFrance", "France"}]Entity["City", {"London", "GreaterLondon", "UnitedKingdom"}], Entity["City", {"Madrid", "Madrid", "Spain"}]Entity["City", {"Seville", "Seville", "Spain"}], Entity["City", {"Madrid", "Madrid", "Spain"}]Entity["City", {"Barcelona", "Barcelona", "Spain"}]};GeoGraphPlot[edges, VertexLabels -> Automatic]Use Labeled to label a specific vertex:
vertices = {Labeled[Entity["City", {"Barcelona", "Barcelona", "Spain"}], "Barcelona"], Entity["City", {"Frankfurt", "Hesse", "Germany"}], Entity["City", {"London", "GreaterLondon", "UnitedKingdom"}], Entity["City", {"Madrid", "Madrid", "Spain"}], Entity["City", {"Milan", "Lombardy", "Italy"}], Entity["City", {"Paris", "IleDeFrance", "France"}], Entity["City", {"Rome", "Lazio", "Italy"}], Entity["City", {"Seville", "Seville", "Spain"}]};GeoGraphPlot[vertices, IconizedObject[«edges»]]Use VertexLabels to label a specific vertex:
GeoGraphPlot[IconizedObject[«edges»], VertexLabels -> {["Barcelona"] -> "Barcelona"}]Edge and Vertex Wrappers (6)
vertices = {Tooltip[Entity["City", {"Paris", "IleDeFrance", "France"}], "The city of love"], Entity["City", {"Frankfurt", "Hesse", "Germany"}], Entity["City", {"London", "GreaterLondon", "UnitedKingdom"}], Entity["City", {"Madrid", "Madrid", "Spain"}], Entity["City", {"Milan", "Lombardy", "Italy"}], Entity["City", {"Paris", "IleDeFrance", "France"}], Entity["City", {"Rome", "Lazio", "Italy"}], Entity["City", {"Seville", "Seville", "Spain"}]};GeoGraphPlot[vertices, IconizedObject[«edges»]]Give colors for specific vertices:
vertices = {Style[Entity["City", {"Paris", "IleDeFrance", "France"}], Blue], Style[Entity["City", {"Frankfurt", "Hesse", "Germany"}], Orange], Style[Entity["City", {"London", "GreaterLondon", "UnitedKingdom"}], Pink], Entity["City", {"Madrid", "Madrid", "Spain"}], Entity["City", {"Milan", "Lombardy", "Italy"}], Entity["City", {"Paris", "IleDeFrance", "France"}], Style[Entity["City", {"Rome", "Lazio", "Italy"}], Green], Entity["City", {"Seville", "Seville", "Spain"}]};GeoGraphPlot[vertices, IconizedObject[«edges»]]Specify colors for specific edges:
GeoGraphPlot[{Entity["City", {"Rome", "Lazio", "Italy"}]Entity["City", {"Milan", "Lombardy", "Italy"}], Style[Entity["City", {"Milan", "Lombardy", "Italy"}]Entity["City", {"Paris", "IleDeFrance", "France"}], Directive[Thick, Green]], Entity["City", {"Milan", "Lombardy", "Italy"}]Entity["City", {"Frankfurt", "Hesse", "Germany"}], Entity["City", {"Paris", "IleDeFrance", "France"}]Entity["City", {"Frankfurt", "Hesse", "Germany"}], Entity["City", {"Paris", "IleDeFrance", "France"}]Entity["City", {"Madrid", "Madrid", "Spain"}], Style[Entity["City", {"Paris", "IleDeFrance", "France"}]Entity["City", {"London", "GreaterLondon", "UnitedKingdom"}], Directive[Thick, Blue]], Entity["City", {"Madrid", "Madrid", "Spain"}]Entity["City", {"Seville", "Seville", "Spain"}], Style[Entity["City", {"Madrid", "Madrid", "Spain"}]Entity["City", {"Barcelona", "Barcelona", "Spain"}], Directive[Thick, Orange]]}]Set actions by wrapping specific vertices:
vertices = {Button[Entity["City", {"Paris", "IleDeFrance", "France"}], Speak["Paris"]], StatusArea[Entity["City", {"Frankfurt", "Hesse", "Germany"}], "Frankfurt"], PopupWindow[Entity["City", {"London", "GreaterLondon", "UnitedKingdom"}], "London"], Entity["City", {"Madrid", "Madrid", "Spain"}], Entity["City", {"Milan", "Lombardy", "Italy"}], Entity["City", {"Paris", "IleDeFrance", "France"}], Entity["City", {"Rome", "Lazio", "Italy"}], Entity["City", {"Seville", "Seville", "Spain"}]};GeoGraphPlot[vertices, IconizedObject[«edges»]]Attach a Hyperlink to a specific edge:
GeoGraphPlot[{Entity["City", {"Rome", "Lazio", "Italy"}]Entity["City", {"Milan", "Lombardy", "Italy"}], Entity["City", {"Milan", "Lombardy", "Italy"}]Entity["City", {"Paris", "IleDeFrance", "France"}], Entity["City", {"Milan", "Lombardy", "Italy"}]Entity["City", {"Frankfurt", "Hesse", "Germany"}], Entity["City", {"Paris", "IleDeFrance", "France"}]Entity["City", {"Frankfurt", "Hesse", "Germany"}], Entity["City", {"Paris", "IleDeFrance", "France"}]Entity["City", {"Madrid", "Madrid", "Spain"}], Hyperlink[Entity["City", {"Paris", "IleDeFrance", "France"}]Entity["City", {"London", "GreaterLondon", "UnitedKingdom"}], "https://www.wolframalpha.com/input/?i=paris+to+london"], Entity["City", {"Madrid", "Madrid", "Spain"}]Entity["City", {"Seville", "Seville", "Spain"}], Entity["City", {"Madrid", "Madrid", "Spain"}]Entity["City", {"Barcelona", "Barcelona", "Spain"}]}]Apply wrappers to vertices and edges:
GeoGraphPlot[{Tooltip[Entity["City", {"Paris", "IleDeFrance", "France"}], "The city of love"], Entity["City", {"Frankfurt", "Hesse", "Germany"}], Entity["City", {"London", "GreaterLondon", "UnitedKingdom"}], PopupWindow[Entity["City", {"Madrid", "Madrid", "Spain"}], "Capital of Spain"], Entity["City", {"Milan", "Lombardy", "Italy"}], Labeled[Entity["City", {"Rome", "Lazio", "Italy"}], Style["Rome", 14], Right], StatusArea[Entity["City", {"Seville", "Seville", "Spain"}], "Sevilla"], Style[Entity["City", {"Barcelona", "Barcelona", "Spain"}], Yellow]}, {Entity["City", {"Rome", "Lazio", "Italy"}]Entity["City", {"Milan", "Lombardy", "Italy"}], Button[Entity["City", {"Milan", "Lombardy", "Italy"}]Entity["City", {"Paris", "IleDeFrance", "France"}], Print["Milan to Paris"]], Style[Entity["City", {"Milan", "Lombardy", "Italy"}]Entity["City", {"Frankfurt", "Hesse", "Germany"}], Directive[Thick, Blue]], Entity["City", {"Paris", "IleDeFrance", "France"}]Entity["City", {"Frankfurt", "Hesse", "Germany"}], Style[Entity["City", {"Paris", "IleDeFrance", "France"}]Entity["City", {"Madrid", "Madrid", "Spain"}], Directive[Dashed, Thickness[0.01], Purple]], Hyperlink[Entity["City", {"Paris", "IleDeFrance", "France"}]Entity["City", {"London", "GreaterLondon", "UnitedKingdom"}], "https://www.wolframalpha.com/input/?i=paris+to+london"], Entity["City", {"Madrid", "Madrid", "Spain"}]Entity["City", {"Seville", "Seville", "Spain"}], Entity["City", {"Madrid", "Madrid", "Spain"}]Entity["City", {"Barcelona", "Barcelona", "Spain"}]}]Graph Styling (11)
edges = {Entity["City", {"Rome", "Lazio", "Italy"}]Entity["City", {"Milan", "Lombardy", "Italy"}], Entity["City", {"Milan", "Lombardy", "Italy"}]Entity["City", {"Paris", "IleDeFrance", "France"}], Entity["City", {"Milan", "Lombardy", "Italy"}]Entity["City", {"Frankfurt", "Hesse", "Germany"}], Entity["City", {"Paris", "IleDeFrance", "France"}]Entity["City", {"Frankfurt", "Hesse", "Germany"}], Entity["City", {"Paris", "IleDeFrance", "France"}]Entity["City", {"Madrid", "Madrid", "Spain"}], Entity["City", {"Paris", "IleDeFrance", "France"}]Entity["City", {"London", "GreaterLondon", "UnitedKingdom"}], Entity["City", {"Madrid", "Madrid", "Spain"}]Entity["City", {"Seville", "Seville", "Spain"}], Style[Entity["City", {"Madrid", "Madrid", "Spain"}]Entity["City", {"Barcelona", "Barcelona", "Spain"}], Directive[Thick, Blue]]};GeoGraphPlot[edges]GeoGraphPlot[{Entity["City", {"Rome", "Lazio", "Italy"}]Entity["City", {"Milan", "Lombardy", "Italy"}], Entity["City", {"Milan", "Lombardy", "Italy"}]Entity["City", {"Paris", "IleDeFrance", "France"}], Entity["City", {"Milan", "Lombardy", "Italy"}]Entity["City", {"Frankfurt", "Hesse", "Germany"}], Entity["City", {"Paris", "IleDeFrance", "France"}]Entity["City", {"Frankfurt", "Hesse", "Germany"}], Entity["City", {"Paris", "IleDeFrance", "France"}]Entity["City", {"Madrid", "Madrid", "Spain"}], Entity["City", {"Paris", "IleDeFrance", "France"}]Entity["City", {"London", "GreaterLondon", "UnitedKingdom"}], Entity["City", {"Madrid", "Madrid", "Spain"}]Entity["City", {"Seville", "Seville", "Spain"}], Entity["City", {"Madrid", "Madrid", "Spain"}]Entity["City", {"Barcelona", "Barcelona", "Spain"}]}, EdgeStyle -> Directive[Thick, Brown, Dashed]]Set the style for all vertex labels:
GeoGraphPlot[{Entity["City", {"Rome", "Lazio", "Italy"}]Entity["City", {"Milan", "Lombardy", "Italy"}], Entity["City", {"Milan", "Lombardy", "Italy"}]Entity["City", {"Paris", "IleDeFrance", "France"}], Entity["City", {"Milan", "Lombardy", "Italy"}]Entity["City", {"Frankfurt", "Hesse", "Germany"}], Entity["City", {"Paris", "IleDeFrance", "France"}]Entity["City", {"Frankfurt", "Hesse", "Germany"}], Entity["City", {"Paris", "IleDeFrance", "France"}]Entity["City", {"Madrid", "Madrid", "Spain"}], Entity["City", {"Paris", "IleDeFrance", "France"}]Entity["City", {"London", "GreaterLondon", "UnitedKingdom"}], Entity["City", {"Madrid", "Madrid", "Spain"}]Entity["City", {"Seville", "Seville", "Spain"}], Entity["City", {"Madrid", "Madrid", "Spain"}]Entity["City", {"Barcelona", "Barcelona", "Spain"}]}, VertexLabels -> "Name", VertexLabelStyle -> Directive[Red, Italic, 8.5]]GeoGraphPlot[{Entity["City", {"Rome", "Lazio", "Italy"}], Entity["City", {"Milan", "Lombardy", "Italy"}], Entity["City", {"Paris", "IleDeFrance", "France"}], Entity["City", {"Frankfurt", "Hesse", "Germany"}], Entity["City", {"Madrid", "Madrid", "Spain"}], Style[Entity["City", {"London", "GreaterLondon", "UnitedKingdom"}], Blue], Entity["City", {"Seville", "Seville", "Spain"}], Style[Entity["City", {"Barcelona", "Barcelona", "Spain"}], Green]}, {Entity["City", {"Rome", "Lazio", "Italy"}]Entity["City", {"Milan", "Lombardy", "Italy"}], Entity["City", {"Milan", "Lombardy", "Italy"}]Entity["City", {"Paris", "IleDeFrance", "France"}], Entity["City", {"Milan", "Lombardy", "Italy"}]Entity["City", {"Frankfurt", "Hesse", "Germany"}], Entity["City", {"Paris", "IleDeFrance", "France"}]Entity["City", {"Frankfurt", "Hesse", "Germany"}], Entity["City", {"Paris", "IleDeFrance", "France"}]Entity["City", {"Madrid", "Madrid", "Spain"}], Entity["City", {"Paris", "IleDeFrance", "France"}]Entity["City", {"London", "GreaterLondon", "UnitedKingdom"}], Entity["City", {"Madrid", "Madrid", "Spain"}]Entity["City", {"Seville", "Seville", "Spain"}], Entity["City", {"Madrid", "Madrid", "Spain"}]Entity["City", {"Barcelona", "Barcelona", "Spain"}]}]GeoGraphPlot[{Entity["City", {"Rome", "Lazio", "Italy"}]Entity["City", {"Milan", "Lombardy", "Italy"}], Entity["City", {"Milan", "Lombardy", "Italy"}]Entity["City", {"Paris", "IleDeFrance", "France"}], Entity["City", {"Milan", "Lombardy", "Italy"}]Entity["City", {"Frankfurt", "Hesse", "Germany"}], Entity["City", {"Paris", "IleDeFrance", "France"}]Entity["City", {"Frankfurt", "Hesse", "Germany"}], Entity["City", {"Paris", "IleDeFrance", "France"}]Entity["City", {"Madrid", "Madrid", "Spain"}], Entity["City", {"Paris", "IleDeFrance", "France"}]Entity["City", {"London", "GreaterLondon", "UnitedKingdom"}], Entity["City", {"Madrid", "Madrid", "Spain"}]Entity["City", {"Seville", "Seville", "Spain"}], Entity["City", {"Madrid", "Madrid", "Spain"}]Entity["City", {"Barcelona", "Barcelona", "Spain"}]}]Specify a GraphLayout:
GeoGraphPlot[{Entity["City", {"Rome", "Lazio", "Italy"}]Entity["City", {"Milan", "Lombardy", "Italy"}], Entity["City", {"Milan", "Lombardy", "Italy"}]Entity["City", {"Paris", "IleDeFrance", "France"}], Entity["City", {"Milan", "Lombardy", "Italy"}]Entity["City", {"Frankfurt", "Hesse", "Germany"}], Entity["City", {"Paris", "IleDeFrance", "France"}]Entity["City", {"Frankfurt", "Hesse", "Germany"}], Entity["City", {"Paris", "IleDeFrance", "France"}]Entity["City", {"Madrid", "Madrid", "Spain"}], Entity["City", {"Paris", "IleDeFrance", "France"}]Entity["City", {"London", "GreaterLondon", "UnitedKingdom"}], Entity["City", {"Madrid", "Madrid", "Spain"}]Entity["City", {"Seville", "Seville", "Spain"}], Entity["City", {"Madrid", "Madrid", "Spain"}]Entity["City", {"Barcelona", "Barcelona", "Spain"}]}, GraphLayout -> "Biking", GeoBackground -> "StreetMapNoLabels"]Use a map of the world's coastlines for the background:
GeoGraphPlot[IconizedObject[«air routes»], GeoBackground -> "Coastlines"]Use the orthographic projection for the map:
GeoGraphPlot[IconizedObject[«air routes»], GeoProjection -> "LambertAzimuthal"]Use 350 kilometers of padding on each side of the map:
GeoGraphPlot[IconizedObject[«Europe»], GeoRangePadding -> Quantity[350, "Kilometers"]]GeoGraphPlot[IconizedObject[«nearest US cities»], GeoGridLines -> Automatic]Specify the spacing between them:
GeoGraphPlot[IconizedObject[«nearest US cities»], GeoGridLines -> {Quantity[5, "AngularDegrees"], Quantity[15, "AngularDegrees"]}]Specify parallel and meridians rendering:
GeoGraphPlot[IconizedObject[«nearest US cities»], GeoGridLines -> {Quantity[5, "AngularDegrees"], Quantity[15, "AngularDegrees"]}, GeoGridLinesStyle -> Directive[Dashed, Blue]]GeoGraphPlot[IconizedObject[«nearest US cities»], GeoGridLines -> {Quantity[5, "AngularDegrees"], Quantity[15, "AngularDegrees"]}, GeoGridLinesStyle -> {Red, Blue}]Options (55)
AspectRatio (3)
By default, the ratio of the height to width for the plot is determined based on values:
GeoGraphPlot[{Entity["City", {"NewYork", "NewYork", "UnitedStates"}]Entity["City", {"SanDiego", "California", "UnitedStates"}]}]Make the height the same as the width with AspectRatio1:
GeoGraphPlot[{Entity["City", {"NewYork", "NewYork", "UnitedStates"}]Entity["City", {"SanDiego", "California", "UnitedStates"}]}, AspectRatio -> 1]AspectRatioFull adjusts the height and width to tightly fit inside other constructs:
plot = GeoGraphPlot[{Entity["City", {"NewYork", "NewYork", "UnitedStates"}]Entity["City", {"SanDiego", "California", "UnitedStates"}]}, AspectRatio -> Full];
{Framed[Pane[plot, {70, 150}]], Framed[Pane[plot, {150, 150}]], Framed[Pane[plot, {150, 75}]]}Axes (3)
By default, axes are not drawn for GeoGraphPlot:
GeoGraphPlot[{Entity["City", {"NewYork", "NewYork", "UnitedStates"}]Entity["City", {"SanDiego", "California", "UnitedStates"}]}]Use AxesTrue to turn on axes:
GeoGraphPlot[{Entity["City", {"NewYork", "NewYork", "UnitedStates"}]Entity["City", {"SanDiego", "California", "UnitedStates"}]}, Axes -> True]Turn each axis on individually:
{GeoGraphPlot[{Entity["City", {"NewYork", "NewYork", "UnitedStates"}]Entity["City", {"SanDiego", "California", "UnitedStates"}]}, Axes -> {True, False}], GeoGraphPlot[{Entity["City", {"NewYork", "NewYork", "UnitedStates"}]Entity["City", {"SanDiego", "California", "UnitedStates"}]}, Axes -> {False, True}]}AxesLabel (3)
No axes labels are drawn by default:
GeoGraphPlot[{Entity["City", {"NewYork", "NewYork", "UnitedStates"}]Entity["City", {"SanDiego", "California", "UnitedStates"}]}, Axes -> True]GeoGraphPlot[{Entity["City", {"NewYork", "NewYork", "UnitedStates"}]Entity["City", {"SanDiego", "California", "UnitedStates"}]}, Axes -> True, AxesLabel -> y]GeoGraphPlot[{Entity["City", {"NewYork", "NewYork", "UnitedStates"}]Entity["City", {"SanDiego", "California", "UnitedStates"}]}, Axes -> True, AxesLabel -> {x, y}]AxesOrigin (2)
The position of the axes is determined automatically:
GeoGraphPlot[{Entity["City", {"NewYork", "NewYork", "UnitedStates"}]Entity["City", {"SanDiego", "California", "UnitedStates"}]}, Axes -> True]Specify an explicit origin for the axes:
GeoGraphPlot[{Entity["City", {"NewYork", "NewYork", "UnitedStates"}]Entity["City", {"SanDiego", "California", "UnitedStates"}]}, Axes -> True, AxesOrigin -> {.15, .02}]AxesStyle (4)
Change the style for the axes:
GeoGraphPlot[{Entity["City", {"NewYork", "NewYork", "UnitedStates"}]Entity["City", {"SanDiego", "California", "UnitedStates"}]}, Axes -> True, AxesStyle -> Red]Specify the style of each axis:
GeoGraphPlot[{Entity["City", {"NewYork", "NewYork", "UnitedStates"}]Entity["City", {"SanDiego", "California", "UnitedStates"}]}, Axes -> True, AxesStyle -> {{Thick, Brown}, {Thick, Blue}}]Use different styles for the ticks and the axes:
GeoGraphPlot[{Entity["City", {"NewYork", "NewYork", "UnitedStates"}]Entity["City", {"SanDiego", "California", "UnitedStates"}]}, Axes -> True, AxesStyle -> Green, TicksStyle -> Black]Use different styles for the labels and the axes:
GeoGraphPlot[{Entity["City", {"NewYork", "NewYork", "UnitedStates"}]Entity["City", {"SanDiego", "California", "UnitedStates"}]}, Axes -> True, AxesStyle -> Green, LabelStyle -> Black]EdgeLabels (6)
Label each edge with its index in the edge list:
GeoGraphPlot[IconizedObject[«edges»], EdgeLabels -> "Index"]Label each edge with its name:
GeoGraphPlot[IconizedObject[«edges»], EdgeLabels -> "Name"]Label each edge with its weight, in this case corresponding to the distance between vertices:
GeoGraphPlot[IconizedObject[«edges»], EdgeWeight -> Table[GeoDistance[e[[1]], e[[2]]], {e, IconizedObject[«edges»]}], EdgeLabels -> "EdgeWeight"]Label specific edges in a graph:
GeoGraphPlot[IconizedObject[«edges»], EdgeLabels -> {Entity["City", {"Rome", "Lazio", "Italy"}]Entity["City", {"Milan", "Lombardy", "Italy"}] -> "Italy", Entity["City", {"Madrid", "Madrid", "Spain"}]Entity["City", {"Barcelona", "Barcelona", "Spain"}] -> "Spain"}]Use a tooltip to label the edge between Rome and Milan:
GeoGraphPlot[IconizedObject[«edges»], EdgeLabels -> {Entity["City", {"Rome", "Lazio", "Italy"}]Entity["City", {"Milan", "Lombardy", "Italy"}] -> Placed[Quantity[471, "Kilometers"], Tooltip]}]Place a label most of the way from Rome to Milan:
GeoGraphPlot[IconizedObject[«edges»], EdgeLabels -> {Entity["City", {"Rome", "Lazio", "Italy"}]Entity["City", {"Milan", "Lombardy", "Italy"}] -> Placed[Quantity[471, "Kilometers"], 0.7]}]Position the bottom-left corner of the label at the edge position:
GeoGraphPlot[IconizedObject[«edges»], EdgeLabels -> {Entity["City", {"Rome", "Lazio", "Italy"}]Entity["City", {"Milan", "Lombardy", "Italy"}] -> Placed[Quantity[471, "Kilometers"], {0.7, {0, 0}}]}]EdgeLabelStyle (2)
Set the style for all edge labels:
GeoGraphPlot[IconizedObject[«edges»], EdgeLabels -> "Index", EdgeLabelStyle -> Directive[Blue, Italic, 12]]Specify the style for individual vertex labels:
GeoGraphPlot[IconizedObject[«edges»], EdgeLabels -> "Index", EdgeLabelStyle -> {Entity["City", {"Rome", "Lazio", "Italy"}]Entity["City", {"Milan", "Lombardy", "Italy"}] -> Directive[Red, Italic, 24], Entity["City", {"Paris", "IleDeFrance", "France"}]Entity["City", {"Madrid", "Madrid", "Spain"}] -> Directive[Blue, Italic, 24]}]EdgeStyle (1)
Frame (4)
GeoGraphPlot does not use a frame by default:
GeoGraphPlot[IconizedObject[«data»]]Use FrameTrue to draw a frame around the plot:
GeoGraphPlot[IconizedObject[«data»], Frame -> True]Draw a frame on the left and right edges:
GeoGraphPlot[IconizedObject[«data»], Frame -> {{True, True}, {False, False}}]Draw a frame on the left and bottom edges:
GeoGraphPlot[IconizedObject[«data»], Frame -> {{True, False}, {True, False}}]FrameLabel (4)
Place a label along the bottom frame of a plot:
GeoGraphPlot[IconizedObject[«data»], Frame -> True, FrameLabel -> {"label"}]Frame labels are placed on the bottom and left frame edges by default:
GeoGraphPlot[IconizedObject[«data»], Frame -> True, FrameLabel -> {"latitude", "longitude"}]Place labels on each of the edges in the frame:
GeoGraphPlot[IconizedObject[«data»], Frame -> True, FrameLabel -> {{"left", "right"}, {"bottom", "top"}}]Use a customized style for both labels and frame tick labels:
GeoGraphPlot[IconizedObject[«data»], Frame -> True, FrameLabel -> {{"left", "right"}, {"bottom", "top"}}, LabelStyle -> Directive[Bold, StandardBrown]]FrameStyle (2)
Specify the style of the frame:
GeoGraphPlot[IconizedObject[«data»], Frame -> True, FrameStyle -> Directive[StandardBrown, Thick]]Specify the style for each frame edge:
GeoGraphPlot[IconizedObject[«data»], Frame -> True, FrameStyle -> {{Directive[Green, Thick], Red}, {Directive[Gray, Thick], Blue}}]GeoBackground (1)
Use a vector map style as geo background:
{GeoGraphPlot[IconizedObject[«nearest US cities»], GeoBackground -> "VectorMarketing"], GeoGraphPlot[IconizedObject[«nearest US cities»], GeoBackground -> "StreetMap"], GeoGraphPlot[IconizedObject[«nearest US cities»], GeoBackground -> "Satellite"]}GeoCenter (1)
GeoGridLines (1)
GeoGridLinesStyle (1)
Specify parallel and meridians rendering:
GeoGraphPlot[IconizedObject[«nearest US cities»], GeoGridLines -> {Quantity[5, "AngularDegrees"], Quantity[15, "AngularDegrees"]}, GeoGridLinesStyle -> Directive[Dashed, Blue]]GeoGraphPlot[IconizedObject[«nearest US cities»], GeoGridLines -> {Quantity[5, "AngularDegrees"], Quantity[15, "AngularDegrees"]}, GeoGridLinesStyle -> {Red, Blue}]GeoModel (1)
GeoProjection (1)
Use the Mercator projection for the map:
GeoGraphPlot[IconizedObject[«air routes»], GeoProjection -> "Mercator"]GeoGraphPlot[IconizedObject[«air routes»], GeoProjection -> "Orthographic"]GeoGraphPlot[IconizedObject[«air routes»], GeoProjection -> "LambertAzimuthal"]GeoRange (2)
GeoRangePadding (1)
GraphLayout (2)
PlotTheme (1)
VertexCoordinates (2)
Use VertexCoordinates to locate vertices:
GeoGraphPlot[{"The Big Apple""Emerald City", "The Big Apple""City of Trees", "The Big Easy""The Big Apple", "Wolfram Headquarters""The Big Apple", "Emerald City""Windy City", "Charm City""Windy City", "Windy City""Wolfram Headquarters", "Wolfram Headquarters""Wolfram Headquarters"}, VertexCoordinates -> {"The Big Apple" -> Entity["City", {"NewYork", "NewYork", "UnitedStates"}], "Emerald City" -> Entity["City", {"Seattle", "Washington", "UnitedStates"}], "City of Trees" -> Entity["City", {"BoiseCity", "Idaho", "UnitedStates"}], "The Big Easy" -> Entity["City", {"Boston", "Massachusetts", "UnitedStates"}], "Windy City" -> Entity["City", {"Chicago", "Illinois", "UnitedStates"}], "Charm City" -> Entity["City", {"Baltimore", "Maryland", "UnitedStates"}], "Wolfram Headquarters" -> Entity["City", {"Champaign", "Illinois", "UnitedStates"}]}]Use VertexCoordinates to specify the location of a vertex:
GeoGraphPlot[{Entity["City", {"Rome", "Lazio", "Italy"}]Entity["City", {"Milan", "Lombardy", "Italy"}], Entity["City", {"Milan", "Lombardy", "Italy"}]Entity["City", {"Paris", "IleDeFrance", "France"}], Entity["City", {"Milan", "Lombardy", "Italy"}]Entity["City", {"Frankfurt", "Hesse", "Germany"}], Entity["City", {"Paris", "IleDeFrance", "France"}]Entity["City", {"Frankfurt", "Hesse", "Germany"}], Entity["City", {"Paris", "IleDeFrance", "France"}]Entity["City", {"Madrid", "Madrid", "Spain"}], Entity["City", {"Paris", "IleDeFrance", "France"}]Entity["City", {"London", "GreaterLondon", "UnitedKingdom"}], Entity["City", {"Madrid", "Madrid", "Spain"}]Entity["City", {"Seville", "Seville", "Spain"}], Entity["City", {"Madrid", "Madrid", "Spain"}]Entity["City", {"Barcelona", "Barcelona", "Spain"}], "Norway Coastline"Entity["City", {"London", "GreaterLondon", "UnitedKingdom"}], Entity["City", {"Paris", "IleDeFrance", "France"}]"Norway Coastline"}, VertexCoordinates -> {"Norway Coastline" -> GeoPosition[{62.2, 5.4}]}]VertexLabels (2)
VertexLabelStyle (2)
Set the style for all vertex labels:
GeoGraphPlot[IconizedObject[«Europe»], VertexLabels -> "Name", VertexLabelStyle -> Directive[Red, Italic, 8.5]]Specify the style for individual vertex labels:
GeoGraphPlot[IconizedObject[«Europe»], VertexLabels -> "Name", VertexLabelStyle -> {Entity["City", {"Paris", "IleDeFrance", "France"}] -> Directive[Red, Italic, 12]}]VertexShape (1)
VertexSize (1)
Use named sizes for the vertices:
{GeoGraphPlot[IconizedObject[«Europe»], VertexSize -> Tiny], GeoGraphPlot[IconizedObject[«Europe»], VertexSize -> Small], GeoGraphPlot[IconizedObject[«Europe»], VertexSize -> Medium], GeoGraphPlot[IconizedObject[«Europe»], VertexSize -> Large]}Applications (6)
A company is planning a fiber network for a number of Chicago suburbs. It only has the right of way for its fiber along certain corridors. Some of those corridors might be more expensive. Find the subgraph of connection corridors that connect every suburb with the lowest total cost:
g = [image];GeoGraphPlot[g]Compute and plot the most cost effective way of connecting all the cities:
fibernetwork = FindSpanningTree[g];GeoGraphPlot[fibernetwork]Show Chicago, Illinois, and the connections to its sister cities:
GeoGraphPlot[Thread[Entity["City", {"Chicago", "Illinois", "UnitedStates"}] -> {Entity["City", {"Accra", "GreaterAccra", "Ghana"}], Entity["City", {"Amman", "Amman", "Jordan"}], Entity["City", {"Athens", "Attiki", "Greece"}], Entity["City", {"Belgrade", "CentralSerbia", "Serbia"}], Entity["City", {"Birmingham", "Birmingham", "UnitedKingdom"}], Entity["City", {"Bogota", "DistritoCapital", "Colombia"}], Entity["City", {"Pusan", "PusanGwangyoksi", "SouthKorea"}], Entity["City", {"Casablanca", "GrandCasablanca", "Morocco"}], Entity["City", {"Delhi", "Delhi", "India"}], Entity["City", {"Durban", "KwaZuluNatal", "SouthAfrica"}], Entity["City", {"Galway", "Galway", "Ireland"}], Entity["City", {"Goteborg", "VastraGotaland", "Sweden"}], Entity["City", {"Hamburg", "Hamburg", "Germany"}], Entity["City", {"Kiev", "Kiev", "Ukraine"}], Entity["City", {"Lahore", "Punjab", "Pakistan"}], Entity["City", {"Luzern", "Luzern", "Switzerland"}], Entity["City", {"MexicoCity", "DistritoFederal", "Mexico"}], Entity["City", {"Milan", "Lombardy", "Italy"}], Entity["City", {"Moscow", "Moscow", "Russia"}], Entity["City", {"Osaka", "Osaka", "Japan"}], Entity["City", {"Paris", "IleDeFrance", "France"}], Entity["City", {"PetahTiqwa", "Hamerkaz", "Israel"}], Entity["City", {"Prague", "Prague", "CzechRepublic"}], Entity["City", {"Shanghai", "Shanghai", "China"}], Entity["City", {"Shenyang", "Liaoning", "China"}], Entity["City", {"Sydney", "NewSouthWales", "Australia"}], Entity["City", {"Toronto", "Ontario", "Canada"}], Entity["City", {"Vilnius", "Vilniaus", "Lithuania"}], Entity["City", {"Warsaw", "Mazowieckie", "Poland"}]}], GeoCenter -> Entity["City", {"Chicago", "Illinois", "UnitedStates"}], GraphLayout -> "Geodesic"]Visualize trade between countries:
GeoGraphPlot[Flatten[Thread[# -> #["ImportPartners"]]& /@ EntityList[EntityClass["Country", "NATO"]]]]GeoGraphPlot[Flatten[Thread[# -> #["ImportPartners"]]& /@ EntityList[EntityClass["Country", "GroupOf7"]]]]Create a network between the largest cities in the United States:
cities = EntityList[["50 largest US cities"]]nf = Nearest[cities, DistanceFunction -> GeoDistance]network = DeleteDuplicates[Flatten[Table[Sort /@ Thread[cityRest[nf[city, 5]]], {city, cities}]]];GeoGraphPlot[network, VertexStyle -> Red, EdgeStyle -> Directive[Thickness[0.006], Orange], GeoBackground -> "StreetMapNoLabels"]Plot the spread of languages around the world:
countries = CountryData[];majorLanguages[country_] := Cases[country["LanguagesFractions"], HoldPattern[lang_ -> frac_ /; frac * country["Population"] > Quantity[1000000, "People"]] :> lang]originalCountry[lang_] := originalCountry[lang] = lang[EntityProperty["Language", "PrimaryOrigin"]]majorCountries = Select[countries, #["Population"] > Quantity[10000000, "People"]&];For each language spoken by more than 1 million people in a country, create an edge from the country of origin for that language:
graph = Flatten[Table[Table[If[originalCountry[lang] === country, Nothing, Tooltip[originalCountry[lang] -> country, lang]], {lang, majorLanguages[country]}], {country, majorCountries}]];GeoGraphPlot[graph, GeoProjection -> "LambertAzimuthal", VertexLabels -> Placed[Automatic, Tooltip], GeoRange -> "World"]Plot the USA Electric System Operating Network:
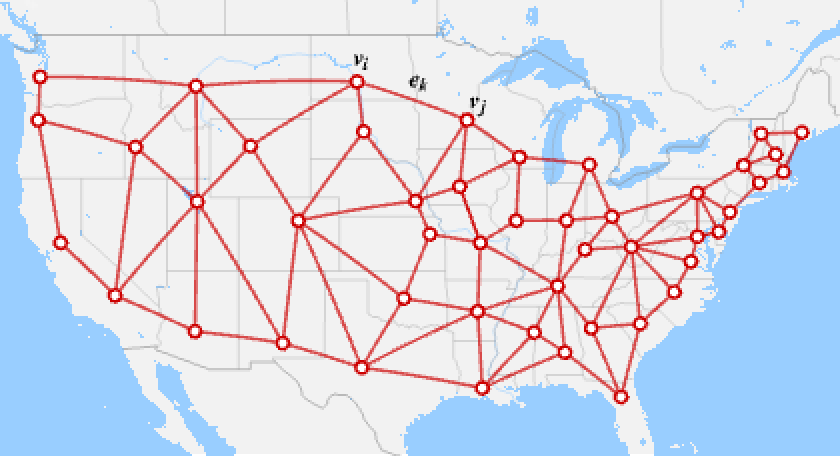
powernetwork = [image];GeoGraphPlot[powernetwork, VertexStyle -> Red, EdgeStyle -> Directive[Thickness[0.006], Orange]]Properties & Relations (10)
Use GraphPlot for non-geographic networks:
GraphPlot[{4 -> 6, 2 -> 9, 2 -> 6, 2 -> 3, 1 -> 6, 5 -> 1, 7 -> 1, 7 -> 5, 9 -> 7, 3 -> 4, 2 -> 8, 2 -> 5, 1 -> 1, 4 -> 5, 8 -> 8, 5 -> 3, 6 -> 5, 1 -> 7, 10 -> 9, 6 -> 7}]Use GeoGraphValuePlot to show the values on geographic networks:
GeoGraphValuePlot[{{Entity["City", {"Rome", "Lazio", "Italy"}], Entity["City", {"Milan", "Lombardy", "Italy"}], 2.2}, {Entity["City", {"Milan", "Lombardy", "Italy"}], Entity["City", {"Paris", "IleDeFrance", "France"}], 2.4}, {Entity["City", {"Milan", "Lombardy", "Italy"}], Entity["City", {"Frankfurt", "Hesse", "Germany"}], 5}, {Entity["City", {"Paris", "IleDeFrance", "France"}], Entity["City", {"Frankfurt", "Hesse", "Germany"}], 3.2}, {Entity["City", {"Paris", "IleDeFrance", "France"}], Entity["City", {"Madrid", "Madrid", "Spain"}], 4.3}, {Entity["City", {"Paris", "IleDeFrance", "France"}], Entity["City", {"London", "GreaterLondon", "UnitedKingdom"}], 3.3}, {Entity["City", {"Madrid", "Madrid", "Spain"}], Entity["City", {"Seville", "Seville", "Spain"}], 3.6}, {Entity["City", {"Madrid", "Madrid", "Spain"}], Entity["City", {"Barcelona", "Barcelona", "Spain"}], 1.8}}]Use GeoListPlot to show the locations of geographic locations and entities:
GeoListPlot[RandomGeoPosition[100]]Use GeoBubbleChart to show values with scaled bubbles:
states = EntityValue[EntityClass["AdministrativeDivision", "USStatesAllStates"], EntityFunction[e, {e, e["Population"]}]];GeoBubbleChart[states]Use GeoRegionValuePlot to show values with colored regions:
states = EntityValue[EntityClass["AdministrativeDivision", "USStatesAllStates"], EntityFunction[e, {e, e["Population"]}]];GeoRegionValuePlot[states]Use GeoHistogram to aggregate locations into bins:
pts = RandomGeoPosition[["US"], 500];GeoHistogram[pts, "AdministrativeDivision1"]Use GeoSmoothHistogram to generate smooth densities from locations:
pts = RandomGeoPosition[["US"], 500];GeoSmoothHistogram[pts]Use GeoVectorPlot and GeoStreamPlot for vector fields:
vecs = GeoVectorENU[GeoPosition[{{41.72044646550199, -97.44319222116899},
    {46.35277665685431, -111.4315456426783}, {38.869826216010324, -106.10009940692615},
    {31.787574043650135, -96.48279364395346}, {39.852469082609225, -93.15525687634982},
   ... 25157985637201197},
   {0.4901023278760972, 0.9891989981823661}, {0.8720928861484118, 0.30133102014639235},
   {-0.9277032216653329, -0.5872478295734753}, {0.947583037831254, -0.6748021812104095},
{-0.6838608673381241, 0.12312620699389898}}];{GeoVectorPlot[vecs], GeoStreamPlot[vecs]}Draw contours on a map with GeoContourPlot:
GeoContourPlot[IconizedObject[«locs»] -> IconizedObject[«vals»]]Smoothly shade a map using color with GeoDensityPlot:
GeoDensityPlot[IconizedObject[«locs»] -> IconizedObject[«vals»]]Text
Wolfram Research (2021), GeoGraphPlot, Wolfram Language function, https://reference.wolfram.com/language/ref/GeoGraphPlot.html.
CMS
Wolfram Language. 2021. "GeoGraphPlot." Wolfram Language & System Documentation Center. Wolfram Research. https://reference.wolfram.com/language/ref/GeoGraphPlot.html.
APA
Wolfram Language. (2021). GeoGraphPlot. Wolfram Language & System Documentation Center. Retrieved from https://reference.wolfram.com/language/ref/GeoGraphPlot.html