The Structure of Graphics and Sound
The Structure of Graphics and Sound
"Graphics and Sound" discusses how to use functions like Plot and ListPlot to plot graphs of functions and data. This tutorial discusses how the Wolfram Language represents such graphics, and how you can program the Wolfram Language to create more complicated images.
The basic idea is that the Wolfram Language represents all graphics in terms of a collection of graphics primitives. The primitives are objects like Point, Line, and Polygon, which represent elements of a graphical image, as well as directives such as RGBColor and Thickness.
ListPlot[Table[Prime[n], {n, 20}]]InputForm shows how the Wolfram Language represents the graphics. Each point is represented as a coordinate in a Point graphics primitive. All the various graphics options used in this case are also given:
InputForm[%]Each complete piece of graphics in the Wolfram Language is represented as a graphics object. There are several different kinds of graphics object, corresponding to different types of graphics. Each kind of graphics object has a definite head that identifies its type.
| Graphics[list] | general two‐dimensional graphics |
| Graphics3D[list] | general three‐dimensional graphics |
The functions like Plot and ListPlot discussed in "The Structure of Graphics and Sound" all work by building up Wolfram Language graphics objects and then displaying them.
You can create other kinds of graphical images in the Wolfram Language by building up your own graphics objects. Since graphics objects in the Wolfram Language are just symbolic expressions, you can use all the standard Wolfram Language functions to manipulate them.
Graphics objects are automatically formatted by the Wolfram System front end as graphics upon output. Graphics may also be printed as a side effect using the Print command.
The Graphics object is computed by the Wolfram Language, but its output is suppressed by the semicolon:
Graphics[Circle[]];
2 + 2
A side effect output can be generated using the Print command. It has no Out[] label because it is a side effect:
Print[Graphics[Circle[]]];
2 + 2
| Show[g,opts] | display a graphics object with new options specified by opts |
| Show[g1,g2,…] | display several graphics objects combined using the options from g1 |
| Show[g1,g2,…,opts] | display several graphics objects with new options specified by opts |
Show can be used to change the options of an existing graphic or to combine multiple graphics.
g1 = Plot[Sin[x], {x, 0, 2Pi}];
Show[g1, Background -> Pink]
This uses Show to combine two graphics. The values used for PlotRange and other options are based upon those which were set for the first graphic:
Show[{g1, Graphics[Circle[]]}]Show[{g1, Graphics[Circle[]]}, PlotRange -> All, AspectRatio -> Automatic]Given a particular list of graphics primitives, the Wolfram Language provides two basic mechanisms for modifying the final form of graphics you get. First, you can insert into the list of graphics primitives certain graphics directives, such as RGBColor, which modify the subsequent graphical elements in the list. In this way, you can specify how a particular set of graphical elements should be rendered.
poly = Polygon[Table[N[{Cos[n Pi / 5], Sin[n Pi / 5]}], {n, 0, 5}]];
Graphics[poly]
InputForm shows the complete graphics object:
InputForm[%]This takes the graphics primitive created above and adds the graphics directives RGBColor and EdgeForm:
Graphics[{RGBColor[0.3, 0.5, 1], EdgeForm[Thickness[0.01]], poly}]By inserting graphics directives, you can specify how particular graphical elements should be rendered. Often, however, you want to make global modifications to the way a whole graphics object is rendered. You can do this using graphics options.
By adding the graphics option Frame you can modify the overall appearance of the graphics:
Show[%, Frame -> True]InputForm[%]You can specify graphics options in Show. As a result, it is straightforward to take a single graphics object and show it with many different choices of graphics options.
Notice however that Show always returns the graphics objects it has displayed. If you specify graphics options in Show, then these options are automatically inserted into the graphics objects that Show returns. As a result, if you call Show again on the same objects, the same graphics options will be used, unless you explicitly specify other ones. Note that in all cases new options you specify will overwrite ones already there.
| Options[g] | give a list of all graphics options for a graphics object |
| Options[g,opt] | give the setting for a particular option |
Some graphics options can be used as options to visualization functions that generate graphics. Options which can take the right-hand side of Automatic are sometimes resolved into specific values by the visualization functions.
zplot = Plot[Abs[Zeta[1 / 2 + I x]], {x, 0, 10}, PlotRange -> Automatic]The Wolfram Language uses an internal algorithm to compute an explicit value for PlotRange in the resulting graphic:
Options[zplot, PlotRange]| FullGraphics[g] | translate objects specified by graphics options into lists of explicit graphics primitives |
When you use a graphics option such as Axes, the Wolfram System front end automatically draws objects such as axes that you have requested. The objects are represented merely by the option values rather than by a specific list of graphics primitives. Sometimes, however, you may find it useful to represent these objects as the equivalent list of graphics primitives. The function FullGraphics gives the complete list of graphics primitives needed to generate a particular plot, without any options being used.
ListPlot[Table[EulerPhi[n], {n, 10}]]FullGraphics yields a graphics object that includes graphics primitives representing axes and so on:
Short[InputForm[FullGraphics[%]], 6]| Point[{x,y}] | point at position x, y |
| Line[{{x1,y1},{x2,y2},…}] | line through the points {x1,y1}, {x2,y2}, … |
| Rectangle[{xmin,ymin},{xmax,ymax}] | filled rectangle |
| Polygon[{{x1,y1},{x2,y2},…}] | filled polygon with the specified list of corners |
| Circle[{x,y},r] | circle with radius r centered at x, y |
| Disk[{x,y},r] | filled disk with radius r centered at x, y |
| Raster[{{a11,a12,…},{a21,…},…}] | rectangular array of gray levels between 0 and 1 |
| Text[expr,{x,y}] |
sawline = Line[Table[{n, (-1) ^ n}, {n, 6}]]sawgraph = Graphics[sawline]Show[%, Axes -> True]You can combine graphics objects that you have created explicitly from graphics primitives with ones that are produced by functions like Plot.
Plot[Sin[Pi x], {x, 0, 6}]Show[%, sawgraph]You can combine different graphical elements simply by giving them in a list. In two‐dimensional graphics, the Wolfram System will render the elements in exactly the order you give them. Later elements are therefore effectively drawn on top of earlier ones.
Here are two blue Rectangle graphics elements:
{Blue, Rectangle[{1, -1}, {2, -0.6}], Rectangle[{4, .3}, {5, .8}]}Graphics[{sawline, %}]The Polygon graphics primitive takes a list of  ,
,  coordinates, corresponding to the corners of a polygon. The Wolfram System joins the last corner with the first one, and then fills the resulting area.
pentagon = Table[{Sin[2 Pi n / 5], Cos[2 Pi n / 5]}, {n, 5}]This displays the pentagon. With the default choice of aspect ratio, the pentagon looks somewhat squashed:
Graphics[Polygon[pentagon]]| Point[{pt1,pt2,…}] | a multipoint consisting of points at pt1, pt2, … |
| Line[{line1,line2,…}] | a multiline consisting of lines line1, line2, … |
| Polygon[{poly1,poly2,…}] | a multipolygon consisting of polygons poly1, poly2, … |
A large number of points can be represented by putting a list of coordinates inside of a single Point primitive. Similarly, a large number of lines or polygons can be represented as a list of coordinate lists. This representation is efficient and can generally be rendered more quickly by the Wolfram System front end. Graphics directives such as RGBColor apply uniformly to the entire set of primitives.
Graphics[Polygon[{pentagon, 1 + .5pentagon, 1.5 + .2pentagon}]]Graphics[{Blue, Point[Table[{x, Cos[x]}, {x, -6, 6, .2}]]}, Axes -> True]| Circle[{x,y},r] | a circle with radius r centered at the point {x,y} |
| Circle[{x,y},{rx,ry}] | an ellipse with semiaxes rx and ry |
| Circle[{x,y},r,{theta1,theta2}] | a circular arc |
| Circle[{x,y},{rx,ry},{theta1,theta2}] | an elliptical arc |
| Disk[{x,y},r]
, etc.
| filled disks |
Graphics[{Circle[{0, 0}, 2], Circle[{1, 1}, 2]}]This shows a sequence of disks with progressively larger semiaxes in the  direction, and progressively smaller ones in the
  direction:
Graphics[Table[Disk[{3n, 0}, {n / 4, 2 - n / 4}], {n, 4}]]The Wolfram System allows you to generate arcs of circles and segments of ellipses. In both cases, the objects are specified by starting and finishing angles. The angles are measured counterclockwise in radians with zero corresponding to the positive  direction.
Graphics[Disk[{0, 0}, 1, {0, 140 Degree}]]| Raster[{{a11,a12,…},{a21,…},…}] | array of gray levels between 0 and 1 |
| Raster[{{{a11,o11},…},…}] | array of gray levels with opacity between 0 and 1 |
| Raster[{{{r11,g11,b11},…},…}] | array of rgb values between 0 and 1 |
| Raster[{{{r11,g11,b11,o11},…},…}] | array of rgb values with opacity between 0 and 1 |
| Raster[array,{{xmin,ymin},{xmax,ymax}},{zmin,zmax}] | array of gray levels between zmin and zmax drawn in the rectangle defined by {xmin,ymin} and {xmax,ymax} |
modtab = Table[Mod[i, j] / 3, {i, 4}, {j, 4}]//NGraphics[Raster[modtab]]Graphics[{Raster[modtab, {{0, 0}, {2, 2}}], Raster[modtab, {{1.5, 1.5}, {3, 2}}]}]Graphics[{Raster[modtab, ColorFunction -> Hue]}]When you set up a graphics object in the Wolfram Language, you typically give a list of graphical elements. You can include in that list graphics directives which specify how subsequent elements in the list should be rendered.
In general, the graphical elements in a particular graphics object can be given in a collection of nested lists. When you insert graphics directives in this kind of structure, the rule is that a particular graphics directive affects all subsequent elements of the list it is in, together with all elements of sublists that may occur. The graphics directive does not, however, have any effect outside the list it is in.
The first sublist contains the graphics directive GrayLevel:
{{GrayLevel[0.5], Rectangle[{0, 0}, {1, 1}]}, Rectangle[{1, 1}, {2, 2}]}Only the rectangle in the first sublist is affected by the GrayLevel directive:
Graphics[%]| GrayLevel[i] |
gray level between 0 (black) and 1 (white)
|
| RGBColor[r,g,b] |
color with specified red, green and blue components, each between 0 and 1
|
| Hue[h] | color with hue h between 0 and 1 |
| Hue[h,s,b] |
color with specified hue, saturation and brightness, each between 0 and 1
|
The Wolfram Language accepts the names of many colors directly as color specifications. These color names, such as Red, Gray, LightGreen, and Purple, are implemented as variables which evaluate to an RGBColor specification. The color names can be used interchangeably with color directives.
The first plot is colored with a color name, while the second one has a fine-tuned RGBColor specification:
Plot[{BesselI[1, x], BesselI[2, x]}, {x, 0, 5}, PlotStyle -> {{Red}, {RGBColor[0.3, 0.7, 0.1]}}]The function Hue[h] provides a convenient way to specify a range of colors using just one parameter. As h varies from 0 to 1, Hue[h] runs through red, yellow, green, cyan, blue, magenta, and back to red again. Hue[h,s,b] allows you to specify not only the "hue", but also the "saturation" and "brightness" of a color. Taking the saturation to be equal to one gives the deepest colors; decreasing the saturation toward zero leads to progressively more "washed out" colors.
When you give a graphics directive such as RGBColor, it affects all subsequent graphical elements that appear in a particular list. The Wolfram Language also supports various graphics directives which affect only specific types of graphical elements.
The graphics directive PointSize[d] specifies that all Point elements which appear in a graphics object should be drawn as circles with diameter d. In PointSize, the diameter d is measured as a fraction of the width of your whole plot.
The Wolfram Language also provides the graphics directive AbsolutePointSize[d], which allows you to specify the "absolute" diameter of points, measured in fixed units. The units are  of an inch, approximately printer's points.
| PointSize[d] | give all points a diameter d as a fraction of the width of the whole plot |
| AbsolutePointSize[d] | give all points a diameter d measured in absolute units |
Table[Point[{n, Prime[n]}], {n, 6}]Graphics[{PointSize[0.1], %}, PlotRange -> All]ListPlot[Table[Prime[n], {n, 20}], PlotStyle -> AbsolutePointSize[3]]| Thickness[w] | give all lines a thickness w as a fraction of the width of the whole plot |
| AbsoluteThickness[w] | give all lines a thickness w measured in absolute units |
| Dashing[{w1,w2,…}] |
show all lines as a sequence of dashed segments, with lengths
w1
,
w2
,
…
|
| AbsoluteDashing[{w1,w2,…}] | use absolute units to measure dashed segments |
| CapForm[type] | give all lines endcaps of the specified type |
| JoinForm[type] | give all lines joins of the specified type |
Table[{AbsoluteThickness[n], Line[{{0, 0}, {n, 1}}]}, {n, 4}]Graphics[%]The Dashing graphics directive allows you to create lines with various kinds of dashing. The basic idea is to break lines into segments which are alternately drawn and omitted. By changing the lengths of the segments, you can get different line styles. Dashing allows you to specify a sequence of segment lengths. This sequence is repeated as many times as necessary in drawing the whole line.
Graphics[{Dashing[{0.05, 0.05}], Line[{{-1, -1}, {1, 1}}]}]Graphics[{Dashing[{0.01, 0.05, 0.05, 0.05}], Line[{{-1, -1}, {1, 1}}]}]Dashing can be turned off by specifying an empty list. Here, Dashing is turned off for only the second line:
Graphics[{Dashing[{0.05}], Line[{{0, 0}, {1, 1}}],
	{Dashing[{}], Line[{{0, 0}, {2, 1}}]},
	Line[{{0, 0}, {3, 1}}]}]
Graphics directives which require a numerical size specification can also accept values of Tiny, Small, Medium, and Large. For each directive, these values have been fine-tuned to produce an appearance which will seem appropriate to the human eye.
Plot[Sin[x], {x, 0, 2Pi}, PlotStyle -> {Dashing[{Medium}], Thickness[Large]}]Graphics[{PointSize[Large], Green, Point[{{0, 0}, {1, 0.5}, {2, 0}, {1, -.5}}]}]The CapForm directive lets you specify the shapes of the end caps of lines. End cap shapes can be "Butt", "Square", or "Round".
This shows the different shapes available to CapForm:
Graphics[{
	Thickness[.07],
	{CapForm["Butt"], Line[{{0, 2}, {5, 2}}]},
	{CapForm["Square"], Line[{{0, 1}, {5, 1}}]},
	{CapForm["Round"], Line[{{0, 0}, {5, 0}}]}
}]CapForm["Butt"] specifies that lines end exactly at their endpoints. "Square" end caps extend one-half line width beyond the ends of a line. "Round" end caps are half-circles whose diameter is the width of the line.
You can also specify the shapes of the joins between line segments via the JoinForm directive.
Here are the shapes available to JoinForm:
Graphics[{
	Thickness[.07],
	{JoinForm["Bevel"], Line[{{0, 0}, {1, 1}, {0, 1}}]},
	{JoinForm["Miter"], Line[{{2, 0}, {3, 1}, {2, 1}}]},
	{JoinForm["Round"], Line[{{4, 0}, {5, 1}, {4, 1}}]}
}, PlotRangePadding -> .3]| JoinForm[{"Miter",d}] | extend the join by at most d times the line width |
When the angle between adjacent line segments is small, the point at a miter join can be very long. Excessively long points are by default truncated to bevel joins. The length at which this happens, the "miter limit", is by default set so that the points of 5-pointed stars are sharp, but more acute joins are beveled. You can specify an explicit miter limit using JoinForm to control exactly when sharp joins are beveled. The miter limit is the number of line widths that the point at a join is allowed to extend past the vertex of the join before it is beveled.
Graphics[{EdgeForm[{Blue, Thickness[.06]}],
Polygon[Table[{Cos[a], Sin[a]}, {a, 0, 6π, 2π 3 / 7}]]}, PlotRangePadding -> .5]Graphics[{EdgeForm[{Blue, Thickness[.06], JoinForm[{"Miter", 5}]}], Polygon[Table[{Cos[a], Sin[a]}, {a, 0, 6π, 2π 3 / 7}]]}, PlotRangePadding -> .5]| RoundingRadius->r | specify that corners should be rounded with radius r |
The corners of Rectangle primitives can be rounded with the RoundingRadius option, which specifies the radius of the rectangle's corners. The actual rounding is limited to the half-length of an adjacent side.
Graphics[{
	Rectangle[{0, 2}, {2, 3}, RoundingRadius -> 0],
	Rectangle[{3, 2}, {5, 3}, RoundingRadius -> .2],
	Rectangle[{0, 0}, {2, 1}, RoundingRadius -> .5],
	Rectangle[{3, 0}, {5, 1}, RoundingRadius -> 1]
	}]
One way to use Wolfram Language graphics directives is to insert them directly into the lists of graphics primitives used by graphics objects. Sometimes, however, you want the graphics directives to be applied more globally, and for example to determine the overall "style" with which a particular type of graphical element should be rendered. There are typically graphics options which can be set to specify such styles in terms of lists of graphics directives.
| PlotStyle->style | specify a style to be used for all curves in Plot |
| PlotStyle->{{style1},{style2},…} |
specify styles to be used (cyclically) for a sequence of curves in
Plot
|
| MeshStyle->style | specify a style to be used for a mesh in density and surface graphics |
| BoxStyle->style | specify a style to be used for the bounding box in three‐dimensional graphics |
Plot[{BesselJ[1, x], BesselJ[2, x]}, {x, 0, 10}, PlotStyle -> {{Thickness[0.02], Gray}}]A different PlotStyle expression can be used to give specific styles to each curve:
Plot[{BesselJ[1, x], BesselJ[2, x]}, {x, 0, 10}, PlotStyle -> {{Thickness[0.02], Gray}, {Red}}]The various "style options" allow you to specify how particular graphical elements in a plot should be rendered. The Wolfram Language also provides options that affect the rendering of the whole plot.
| Background->color | specify the background color for a plot |
| BaseStyle->color |
specify the base style for a plot, affecting elements not affected by
PlotStyle
|
| Prolog->g | give graphics to render before a plot is started |
| Epilog->g | give graphics to render after a plot is finished |
Plot[Sin[Sin[x]], {x, 0, 10}, Background -> Gray, PlotStyle -> White, Epilog -> Arrow[{{3Pi / 2, 1}, {2Pi, 0}}]]Show[%, BaseStyle -> Orange]When you set up a graphics object in the Wolfram Language, you give coordinates for the various graphical elements that appear. When the Wolfram Language renders the graphics object, it has to translate the original coordinates you gave into "display coordinates" that specify where each element should be placed in the final display area.
| PlotRange->{{xmin,xmax},{ymin,ymax}} | the range of original coordinates to include in the plot |
When the Wolfram Language renders a graphics object, one of the first things it has to do is to work out what range of original  and
and  coordinates it should actually display. Any graphical elements that are outside this range will be clipped, and not shown.
The option PlotRange specifies the range of original coordinates to include. As discussed in "Options for Graphics", the default setting is PlotRange->Automatic, which makes the Wolfram Language try to choose a range which includes all "interesting" parts of a plot, while dropping "outliers". By setting PlotRange->All, you can tell the Wolfram Language to include everything. You can also give explicit ranges of coordinates to include.
obj = Polygon[Table[{Sin[n Pi / 10], Cos[n Pi / 10]} + 0.05 (-1) ^ n, {n, 20}]];Graphics[obj]Specifying an explicit PlotRange allows you to zoom in on a section of a graphic:
Graphics[obj, PlotRange -> {{0, 1}, All}]| AspectRatio->r | make the ratio of height to width for the display area equal to r |
| AspectRatio->Automatic | determine the shape of the display area from the original coordinate system |
What we have discussed so far is how the Wolfram Language translates the original coordinates you specify into positions in the final display area. What remains to discuss, however, is what the final display area is like.
On most computer systems, there is a certain fixed region of screen or paper into which the Wolfram Language display area must fit. How it fits into this region is determined by its "shape" or aspect ratio. In general, the option AspectRatio specifies the ratio of height to width for the final display area.
It is important to note that the setting of AspectRatio does not affect the meaning of the scaled or display coordinates. These coordinates always run from 0 to 1 across the display area. What AspectRatio does is to change the shape of this display area.
For two‐dimensional graphics, AspectRatio is set by default to Automatic. This determines the aspect ratio from the original coordinate system used in the plot instead of setting it at a fixed value. One unit in the  direction in the original coordinate system corresponds to the same distance in the final display as one unit in the
  direction. In this way, objects that you define in the original coordinate system are displayed with their "natural shape".
This generates a graphic object corresponding to a regular hexagon. With the default value of AspectRatio->Automatic, the aspect ratio of the final display area is determined from the original coordinate system, and the hexagon is shown with its "natural shape":
Graphics[Polygon[Table[{Sin[n Pi / 3], Cos[n Pi / 3]}, {n, 6}]]]Show[%, AspectRatio -> 3]Sometimes, you may find it convenient to specify the display coordinates for a graphical element directly. You can do this by using scaled coordinates Scaled[{sx,sy}] rather than {x,y}. The scaled coordinates are defined to run from 0 to 1 in  and
and  , with the origin taken to be at the lower‐left corner of the plot range.
| {x,y} | original coordinates |
| Scaled[{sx,sy}] | coordinates scaled to the plot range |
| ImageScaled[{sx,sy}] | coordinates scaled to the display area |
g = Graphics[{Green, Disk[]}, PlotRange -> 2, Frame -> True, FrameLabel -> {Style["x", Large]}]Using Scaled coordinates, the rectangle falls at the origin, which is at the center of the specified plot range:
Show[g, Prolog -> {Rectangle[Scaled[{0.25, 0.25}], Scaled[{0.75, 0.75}]]}]Using ImageScaled coordinates, the rectangle falls at exactly the center of the graphic, which does not coincide with the center of the plot range:
Show[g, Prolog -> {Rectangle[ImageScaled[{0.25, 0.25}], ImageScaled[{0.75, 0.75}]]}]When you use {x,y}, Scaled[{sx,sy}], or ImageScaled[{sx,sy}], you are specifying the position either completely in original coordinates, or completely in scaled coordinates. Sometimes, however, you may need to use a combination of these coordinate systems. For example, if you want to draw a line at a particular point whose length is a definite fraction of the width of the plot, you will have to use original coordinates to specify the basic position of the line, and scaled coordinates to specify its length.
You can use Scaled[{dsx,dsy},{x,y}] to specify a position using a mixture of original and scaled coordinates. In this case, {x,y} gives a position in original coordinates, and {dsx,dsy} gives the offset from the position in scaled coordinates.
| Circle[{x,y},Scaled[sx]] | a circle whose radius is scaled to the width of the plot range |
| Disk[{x,y},Scaled[sx]] | a disk whose radius is scaled to the width of the plot range |
| FontSize->Scaled[sx] | specification for a font size scaled to the width of the plot range |
Some places where Scaled can be used with a single argument.
Both the radius of the circle and the size of the font are specified in Scaled values:
Graphics[{Circle[{0, 0}, Scaled[0.3]], FontSize -> Scaled[0.2], Text["some text", {0, 0}]}]| Scaled[{sdx,sdy},{x,y}] | scaled offset from original coordinates |
| ImageScaled[{sdx,sdy},{x,y}] | image scaled offset from original coordinates |
| Offset[{adx,ady},{x,y}] | absolute offset from original coordinates |
| Offset[{adx,ady},Scaled[{sx,sy}]] | absolute offset from scaled coordinates |
| Offset[{adx,ady},ImageScaled[{sx,sy}]] | absolute offset from image scaled coordinates |
Graphics[Table[Line[{{x, x ^ 2}, Offset[{0, 6}, {x, x ^ 2}]}], {x, 10}], Frame -> True]You can also use Offset inside Circle with just one argument to create a circle with a certain absolute radius:
Graphics[Table[Circle[{x, x ^ 2}, Offset[{2, 2}]], {x, 10}], Frame -> True]In most kinds of graphics, you typically want the relative positions of different objects to adjust automatically when you change the coordinates or the overall size of your plot. But sometimes you may instead want the offset from one object to another to be constrained to remain fixed. This can be the case, for example, when you are making a collection of plots in which you want certain features to remain consistent, even though the different plots have different forms.
Offset[{adx,ady},position] allows you to specify the position of an object by giving an absolute offset from a position that is specified in original or scaled coordinates. The units for the offset are printer's points, equal to  of an inch.
When you give text in a plot, the size of the font that is used is also specified in printer's points. Therefore, a 10‐point font, for example, has letters whose basic height is 10 printer's points. You can use Offset to move text around in a plot, and to create plotting symbols or icons which match the size of the text.
Using scaled coordinates, you can specify the sizes of graphical elements as fractions of the size of the display area. You cannot, however, tell the Wolfram Language the actual physical size at which a particular graphical element should be rendered. Of course, this size ultimately depends on the details of your graphics output device, and cannot be determined for certain within the Wolfram Language. Nevertheless, graphics directives such as AbsoluteThickness discussed in "Graphics Directives and Options" do allow you to indicate "absolute sizes" to use for particular graphical elements. The sizes you request in this way will be respected by most, but not all, output devices. (For example, if you optically project an image, it is neither possible nor desirable to maintain the same absolute size for a graphical element within it.)
| Axes->True | give a pair of axes |
| GridLines->Automatic | draw grid lines on the plot |
| Frame->True | put axes on a frame around the plot |
| PlotLabel->"text" | give an overall label for the plot |
bp = Plot[BesselJ[2, x], {x, 0, 10}]Show[bp, Frame -> True]Show[%, GridLines -> Automatic]| Axes->False | draw no axes |
| Axes->True | draw both |
| Axes->{False,True} | draw a |
| AxesOrigin->Automatic | choose the crossing point for the axes automatically |
| AxesOrigin->{x,y} | specify the crossing point |
| AxesStyle->style | specify the style for the axes |
| AxesStyle->{xstyle,ystyle} | specify individual styles for the axes |
| AxesLabel->None | give no axis labels |
| AxesLabel->ylabel | put a label on the |
| AxesLabel->{xlabel,ylabel} | put labels on both the |
Show[bp, AxesOrigin -> {5, 0}, AxesLabel -> {"x", "y"}]| Ticks->None | draw no tick marks |
| Ticks->Automatic | place tick marks automatically |
| Ticks->{xticks,yticks} | specify tick marks for each axis |
Settings for the Ticks option.
With the default setting Ticks->Automatic, the Wolfram Language creates a certain number of major and minor tick marks, and places them on axes at positions which yield the minimum number of decimal digits in the tick labels. In some cases, however, you may want to specify the positions and properties of tick marks explicitly. You will need to do this, for example, if you want to have tick marks at multiples of  , or if you want to put a nonlinear scale on an axis.
| None | draw no tick marks |
| Automatic | place tick marks automatically |
| {x1,x2,…} | draw tick marks at the specified positions |
| {{x1,label1},{x2,label2},…} | draw tick marks with the specified labels |
| {{x1,label1,len1},…} | draw tick marks with the specified scaled lengths |
| {{x1,label1,{plen1,mlen1}},…} | draw tick marks with the specified lengths in the positive and negative directions |
| {{x1,label1,len1,style1},…} | draw tick marks with the specified styles |
| func | a function to be applied to xmin, xmax to get the tick mark option |
This gives tick marks at specified positions on the  axis, and chooses the tick marks automatically on the
  axis:
axis:
Show[bp, Ticks -> {{0, Pi, 2Pi, 3Pi}, Automatic}]Show[bp, Ticks -> {{0, {Pi / 2, ""}, Pi, {3Pi / 2, ""}, 2Pi, {5Pi / 2, ""}, 3Pi}, Automatic}]Particularly when you want to create complicated tick mark specifications, it is often convenient to define a "tick mark function" which creates the appropriate tick mark specification given the minimum and maximum values on a particular axis.
units[xmin_, xmax_] := Range[Floor[xmin], Floor[xmax], 1]Show[bp, Ticks -> {units, Automatic}]| Frame->False | draw no frame |
| Frame->True | draw a frame around the plot |
| FrameStyle->style | specify a style for the frame |
| FrameStyle->{{left,right},{bottom,top}} | specify styles for each edge of the frame |
| FrameLabel->None | give no frame labels |
| FrameLabel->{{left,right},{bottom,top}} | put labels on edges of the frame |
| RotateLabel->False | do not rotate text in labels |
| FrameTicks->None | draw no tick marks on frame edges |
| FrameTicks->Automatic | position tick marks automatically |
| FrameTicks->{{left,right},{bottom,top}} | specify tick marks for frame edges |
The Axes option allows you to draw a single pair of axes in a plot. Sometimes, however, you may instead want to show the scales for a plot on a frame, typically drawn around the whole plot. The option Frame allows you effectively to draw four axes, corresponding to the four edges of the frame around a plot.
Show[bp, Frame -> True, FrameLabel -> {{"left label", "right label"}, {"bottom label", "top label"}}]| GridLines->None | draw no grid lines |
| GridLines->Automatic | position grid lines automatically |
| GridLines->{xgrid,ygrid} | specify grid lines in analogy with tick marks |
Grid lines in the Wolfram Language work very much like tick marks. As with tick marks, you can specify explicit positions for grid lines. There is no label or length to specify for grid lines. However, you can specify a style.
Show[bp, GridLines -> {Automatic, None}]"Redrawing and Combining Plots" describes how you can make regular arrays of plots using GraphicsGrid. Using the Inset graphics primitive, however, you can combine and superimpose plots in any way.
| Inset[obj, pos] | specifies that the inset should be placed at position pos in the graphic |
| Inset[obj,pos, opos, size] | render an object with a given size so that point opos in obj is positioned at point pos in the containing graphic |
| Inset[obj,pos, opos, size, dirs] | specifies that the axes of the inset should be oriented in directions dirs |
p1 = Plot[{Sin[x], Sin[2x]}, {x, 0, 2π}, ImageSize -> 200, Frame -> True, Background -> StandardGray]ParametricPlot[{Sin[x], Sin[2x]}, {x, 0, 4π}, Epilog -> Inset[p1, {.3, -.5}]]p3 = Plot3D[Sin[x] Exp[y], {x, -5, 5}, {y, -2, 2}]This creates a two‐dimensional graphics object that contains two differently sized copies of the three‐dimensional plot:
Graphics[{Inset[p3, -{1, 1}, Center, {2, 2}], Inset[p3, {.5, .5}, Center, {3, 3}]}, PlotRange -> 2]Graphics[{
Inset[p1, {1, 0}, Center, {1, 1}, {1, 1}],
Inset[p1, {2, 0}, Center, {1, 1}, {{1, 0}, {1, 1}}]
}]The Wolfram Language can render plots, arbitrary 2D or 3D graphics, cells, and text within an Inset. Notice that in general the display area for graphics objects will be sized so as to touch at least one pair of edges of the Inset.
| DensityPlot[f,{x,xmin,xmax},{y,ymin,ymax}] | |
make a density plot of f | |
| ContourPlot[f,{x,xmin,xmax},{y,ymin,ymax}] | |
make a contour plot of f as a function of x and y | |
DensityPlot[Sin[x] Sin[y], {x, -2, 2}, {y, -2, 2}]option name | default value | |
| ColorFunction | Automatic | what colors to use for shading; Hue uses a sequence of hues |
| Mesh | None | whether to draw a mesh |
| PlotPoints | Automatic | number of initial sample points in each direction |
| MaxRecursion | Automatic | the maximum number of recursive subdivision steps to do |
Some options for DensityPlot.
DensityPlot[Sin[x] Sin[y], {x, -2, 2}, {y, -2, 2}, Mesh -> 19]In a density plot, the color of each point represents the value at that point of the function being plotted. By default, the color ranges from black to white through intermediate shades of blue as the value of the function increases. In general, however, you can specify other "color maps" for the relation between the value at a point and its color. The option ColorFunction allows you to specify a function which is applied to the function value to find the color at any point. The color function may return any Wolfram Language color directive, such as GrayLevel, Hue, or RGBColor. A common setting to use is ColorFunction->Hue.
DensityPlot[Sin[x] Sin[y], {x, -2, 2}, {y, -2, 2}, ColorFunction -> Hue]A significant resource for customized color functions is the ColorData function. ColorData provides many customized sets of colors which can be used directly by ColorFunction.
This shows a list of the gradients which can be accessed using ColorData:
ColorData["Gradients"]DensityPlot[Sin[x] Sin[y], {x, -2, 2}, {y, -2, 2}, ColorFunction -> ColorData["SolarColors"]]ContourPlot[Sin[x] Sin[y], {x, -2, 2}, {y, -2, 2}]A contour plot gives you essentially a "topographic map" of a function. The contours join points on the surface that have the same height. The default is to have contours corresponding to a sequence of equally spaced z values. Contour plots produced by the Wolfram Language are by default shaded, in such a way that regions with higher z values are lighter.
option name | default value | |
| ColorFunction | Automatic | what colors to use for shading; Hue uses a sequence of hues |
| Contours | Automatic | the total number of contours, or the list of z values for contours |
| PlotRange | {Full,Full,Automatic} | |
| ContourShading | Automatic | how to shade the regions; None leaves the regions blank, or a list of colors can be provided |
| PlotPoints | Automatic | number of initial sample points in each direction |
| MaxRecursion | Automatic | the maximum number of recursive subdivision steps to do |
Some options for ContourPlot.
ContourPlot[Sin[x] Sin[y], {x, -2, 2}, {y, -2, 2}, ContourShading -> None]ContourPlot[Sin[x] Sin[y], {x, -2, 2}, {y, -2, 2}, ContourShading -> {LightRed, LightPurple}]Both DensityPlot and ContourPlot use an adaptive algorithm that subdivides parts of the plot region to obtain more sample points for a smoother representation of the function you are plotting. Because the number of sample points is always finite, however, it is possible that features of your function will sometimes be missed. When necessary, you can increase the number of sample points by increasing the values of the PlotPoints and MaxRecursion options.
One point to notice is that whereas a curve generated by Plot may be inaccurate if your function varies too quickly in a particular region, the shape of contours generated by ContourPlot can be inaccurate if your function varies too slowly. A rapidly varying function gives a regular pattern of contours, but a function that is almost flat can give irregular contours. You can typically overcome this by increasing the value of PlotPoints or MaxRecursion.
One of the most powerful aspects of graphics in the Wolfram System is the availability of three‐dimensional as well as two‐dimensional graphics primitives. By combining three‐dimensional graphics primitives, you can represent and render three‐dimensional objects in the Wolfram System.
| Point[{x,y,z}] | point with coordinates x, y, z |
| Line[{{x1,y1,z1},{x2,y2,z2},…}] | line through the points {x1,y1,z1}, {x2,y2,z2}, … |
| Polygon[{{x1,y1,z1},{x2,y2,z2},…}] | |
filled polygon with the specified list of corners | |
| Cuboid[{xmin,ymin,zmin},{xmax,ymax,zmax}] | |
cuboid | |
| Arrow[{pt1,pt2}] | arrow pointing from pt1 to pt2 |
| Text[expr,{x,y,z}] | |
rcoord := RandomReal[1., {3}]pts = Table[Point[rcoord], {20}];Graphics3D[pts]Graphics3D[Line[Table[rcoord, {10}]]]If you give a list of graphics elements in two dimensions, the Wolfram System simply draws each element in turn, with later elements obscuring earlier ones. In three dimensions, however, the Wolfram System collects together all the graphics elements you specify, then displays them as three‐dimensional objects, with the ones in front in three‐dimensional space obscuring those behind.
rantri := Polygon[Table[rcoord, {3}]]Graphics3D[rantri]Graphics3D[Table[rantri, {5}]]By creating an appropriate list of polygons, you can build up any three‐dimensional object in the Wolfram System. Thus, for example, all the surfaces produced by ParametricPlot3D are represented essentially as lists of polygons.
| Point[{pt1,pt2,…}] | a multipoint consisting of points at pt1, pt2, … |
| Line[{line1,line2,…}] | a multiline consisting of lines line1, line2, … |
| Polygon[{poly1,poly2,…}] | a multipolygon consisting of polygons poly1, poly2, … |
As with the two-dimensional primitives, some three-dimensional graphics primitives have multi-coordinate forms, which are a more efficient representation. When dealing with a very large number of primitives, using these multi-coordinate forms where possible can both reduce the memory footprint of the resulting graphic and make it render much more quickly.
rantricoords := Table[rcoord, {3}]Using the multi-coordinate form of Polygon, this efficiently represents a very large number of triangles:
Graphics3D[Polygon[Table[rantricoords, {10000}]]]The Wolfram System allows polygons in three dimensions to have any number of vertices in any configuration. Depending upon the locations of the vertices, the resulting polygons may be non-coplanar or nonconvex. When rendering non-coplanar polygons, the Wolfram System will break the polygon into triangles, which are planar by definition, before rendering it.
The non-coplanar polygon is broken up into triangles. The interior edge joining the triangles is not outlined like the outer edges of the Polygon primitive:
Graphics3D[{Polygon[{{0, 0, 0}, {0, 0, 1}, {1, 1, 0}, {1, 0, 1}}]}]Self-intersecting nonconvex polygons are filled according to an even‐odd rule that alternates between filling and not filling at each crossing:
Graphics3D[Polygon[Table[{Cos[2π k / 5], Sin[2π k / 5], 0}, {k, 0, 8, 2}]]]| Cone[{{x1,y1,z1},{x2,y2,z2}}] | a cone with a base radius of 1 centered around {x1,y1,z1} with the point at {x2,y2,z2} |
| Cone[{{x1,y1,z1},{x2,y2,z2}},r] | a cone with a base radius of r |
| Cuboid[{x,y,z}] | a unit cube with opposite corners having coordinates {x,y,z} and {x+1,y+1,z+1} |
| Cuboid[{xmin,ymin,zmin},{xmax,ymax,zmax}] |
a cuboid (rectangular parallelepiped) with opposite corners having the specified coordinates
|
| Cylinder[{{x1,y1,z1},{x2,y2,z2}}] | a cylinder of radius 1 with endpoints at {x1,y1,z1} and {x2,y2,z2} |
| Cylinder[{{x1,y1,z1},{x2,y2,z2}},r] | a cylinder of radius r |
| Sphere[{x,y,z}] | a unit sphere centered at {x,y,z} |
| Sphere[{x,y,z},r] | a sphere of radius r |
| Tube[{{x1,y1,z1},{x2,y2,z2},…}] | a tube connecting the specified points |
| Tube[{{x1,y1,z1},{x2,y2,z2},…},r] | a tube of radius r |
Graphics3D[Table[{Cuboid[10 rcoord], Sphere[10 rcoord]}, {10}]]Even though Cone, Cylinder, Sphere, and Tube produce high-quality renderings, their usage is scalable. A single image can contain thousands of these primitives. When rendering so many primitives, you can increase the efficiency of rendering by using special options to change the number of points used by default to render Cone, Cylinder, Sphere, and Tube. The "ConePoints" Method option to Graphics3D is used to reduce the rendering quality of each individual cone. Cylinder, sphere, and tube quality can be similarly adjusted using "CylinderPoints", "SpherePoints", and "TubePoints", respectively.
Because the cylinders are so small, the number of points used to render them can be reduced with almost no perceptible change:
Graphics3D[Table[Cylinder[{rcoord, rcoord}, .01], {10000}], Method -> {"CylinderPoints" -> 6}]In three dimensions, just as in two dimensions, you can give various graphics directives to specify how the different elements in a graphics object should be rendered.
All the graphics directives for two dimensions also work in three dimensions. There are, however, some additional directives in three dimensions.
Just as in two dimensions, you can use the directives PointSize, Thickness, and Dashing to tell the Wolfram System how to render Point and Line elements. Note that in three dimensions, the lengths that appear in these directives are measured as fractions of the total width of the display area for your plot.
pts = Table[Point[Table[RandomReal[], {3}]], {20}];This displays the points, with each one being a circle whose diameter is 5% of the display area width:
Graphics3D[{PointSize[0.05], pts}]As in two dimensions, you can use AbsolutePointSize, AbsoluteThickness, and AbsoluteDashing if you want to measure length in absolute units.
line = Line[Table[RandomReal[], {10}, {3}]];Graphics3D[{AbsoluteThickness[2], AbsoluteDashing[{5, 5}], line}]For Point and Line objects, the color specification directives also work the same in three dimensions as in two dimensions. For Polygon objects, however, they can work differently.
In two dimensions, polygons are always assumed to have an intrinsic color, specified directly by graphics directives such as RGBColor and Opacity. In three dimensions, however, the Wolfram System generates colors for polygons using a more physical approach based on simulated illumination. Polygons continue to have an intrinsic color defined by color directives, but the final color observed when rendering the graphic may be different based upon the values of the lights shining on the polygon. Polygons are intrinsically white by default.
| Lighting->Automatic | use default light placements and values |
| Lighting->None | disable all lights |
| Lighting->"Neutral" | light using only white light sources |
This draws an icosahedron with default lighting. The intrinsic color value of the polygons is white:
PolyhedronData["Icosahedron"]This draws the icosahedron using the same lighting parameters, but defines the intrinsic color value of the polygons to be gray:
Graphics3D[{Gray, PolyhedronData["Icosahedron", "GraphicsComplex"]}]The intrinsic color value of the polygons becomes more obvious when using the "Neutral" lighting scheme:
Graphics3D[{Gray, PolyhedronData["Icosahedron", "GraphicsComplex"]}, Lighting -> "Neutral"]Graphics3D[{PolyhedronData["Icosahedron", "GraphicsComplex"], Gray, Thickness[0.1], Line[{{0, 0, -2}, {0, 0, 2}}]}]As with two-dimensional directives, the color directive can be scoped to the line by using a sublist:
Graphics3D[{{Gray, Thickness[0.1], Line[{{0, 0, -2}, {0, 0, 2}}]}, PolyhedronData["Icosahedron", "GraphicsComplex"]}]| EdgeForm[] | draw no lines at the edges of polygons |
| EdgeForm[g] | use the graphics directives g to determine how to draw lines at the edges of polygons |
When you render a three‐dimensional graphics object in the Wolfram System, there are two kinds of lines that can appear. The first kind is lines from explicit Line primitives that you included in the graphics object. The second kind is lines that were generated as the edges of polygons.
You can tell the Wolfram System how to render all lines of the second kind by giving a list of graphics directives inside EdgeForm.
Graphics3D[{EdgeForm[{GrayLevel[0.5], Thickness[0.02]}], PolyhedronData["Dodecahedron", "GraphicsComplex"]}]| FaceForm[gfront,gback] | use gfront graphics directives for the front face of each polygon, and gback for the back |
An important aspect of polygons in three dimensions is that they have both front and back faces. The Wolfram System uses the following convention to define the "front face" of a polygon: if you look at a polygon from the front, then the corners of the polygon will appear counterclockwise, when taken in the order that you specified them.
This makes the front (outside) face of each polygon mostly transparent, and the back (inside) face fully opaque:
Graphics3D[{FaceForm[{Opacity[0.3]}, White], PolyhedronData["Cube", "GraphicsComplex"]}]Whenever the Wolfram Language draws a three‐dimensional object, it always effectively puts a cuboidal box around the object. With the default option setting Boxed->True, the Wolfram Language in fact draws the edges of this box explicitly. But in general, the Wolfram Language automatically "clips" any parts of your object that extend outside of the cuboidal box.
The option PlotRange specifies the range of  ,
,  , and
, and  coordinates that the Wolfram Language should include in the box. As in two dimensions the default setting is PlotRange->Automatic, which makes the Wolfram Language use an internal algorithm to try and include the "interesting parts" of a plot, but drop outlying parts. With PlotRange->All, the Wolfram Language will include all parts.
<<PolyhedronOperations`stel = Stellate[PolyhedronData["Icosahedron", "GraphicsComplex"]];Graphics3D[stel, Axes -> True]With this setting for PlotRange, many parts of the stellated icosahedron lie outside the box, and are clipped:
Show[%, PlotRange -> {-1, 1}]Much as in two dimensions, you can use either "original" or "scaled" coordinates to specify the positions of elements in three‐dimensional objects. Scaled coordinates, specified as Scaled[{sx,sy,sz}], are taken to run from 0 to 1 in each dimension. The coordinates are set up to define a right‐handed coordinate system on the box.
| {x,y,z} | original coordinates |
| Scaled[{sx,sy,sz}] |
scaled coordinates, running from 0 to 1 in each dimension
|
Graphics3D[{stel, Cuboid[Scaled[{0, 0, 0}], Scaled[{0.2, 0.2, 0.2}]]}]Once you have specified where various graphical elements go inside a three‐dimensional box, you must then tell the Wolfram Language how to draw the box. The first step is to specify what shape the box should be. This is analogous to specifying the aspect ratio of a two‐dimensional plot. In three dimensions, you can use the option BoxRatios to specify the ratio of side lengths for the box. For Graphics3D objects, the default is BoxRatios->Automatic, specifying that the shape of the box should be determined from the ranges of actual coordinates for its contents.
Graphics3D[stel, BoxRatios -> {1, 1, 5}]To produce an image of a three‐dimensional object, you have to tell the Wolfram Language from what view point you want to look at the object. You can do this using the option ViewPoint.
Some common settings for this option were given in "Three-Dimensional Surface Plots". In general, however, you can tell the Wolfram Language to use any view point.
View points are specified in the form ViewPoint->{sx,sy,sz}. The values si are given in a special coordinate system, in which the center of the box is {0,0,0}. The special coordinates are scaled so that the longest side of the box corresponds to one unit. The lengths of the other sides of the box in this coordinate system are determined by the setting for the BoxRatios option. For a cubical box, therefore, each of the special coordinates runs from  to
to  across the box. Note that the view point must always lie outside the box.
surf = Plot3D[(2 + Sin[x]) Cos[2 y], {x, -2, 2}, {y, -3, 3}, AxesLabel -> {"x", "y", "z"}]Show[surf, ViewPoint -> {1.2, 1.2, 1.2}]Show[surf, ViewPoint -> {5, 5, 5}]option name | default value | |
| ViewPoint | {1.3,-2.4,2} | the point in a special scaled coordinate system from which to view the object |
| ViewCenter | Automatic | the point in the scaled coordinate system that appears at the center of the final image |
| ViewVertical | {0,0,1} | the direction in the scaled coordinate system that appears as vertical in the final image |
| ViewAngle | Automatic | the opening angle for a simulated camera used to view the graphic |
| ViewVector | Automatic | the position and direction of the simulated camera in the graphic's regular coordinate system |
In making a picture of a three‐dimensional object, you have to specify more than just where you want to look at the object from. You also have to specify how you want to "frame" the object in your final image. You can do this using the additional options ViewCenter, ViewVertical, and ViewAngle.
ViewCenter allows you to tell the Wolfram Language what point in the object should appear at the center of your final image. The point is specified by giving its scaled coordinates, running from 0 to 1 in each direction across the box. With the setting ViewCenter->{1/2,1/2,1/2}, the center of the box will therefore appear at the center of your final image. With many choices of view point, however, the box will not appear symmetrical, so this setting for ViewCenter will not center the whole box in the final image area. You can do this by setting ViewCenter->Automatic.
ViewVertical specifies which way up the object should appear in your final image. The setting for ViewVertical gives the direction in scaled coordinates that ends up vertical in the final image. With the default setting ViewVertical->{0,0,1}, the  direction in your original coordinate system always ends up vertical in the final image.
The Wolfram Language uses the properties of a simulated camera to visualize the final image. The position, orientation, and facing of the camera are determined by the ViewCenter, ViewVertical, and ViewPoint options. The ViewAngle option specifies the width of the opening of the camera lens. The ViewAngle specifies, in radians, twice of the maximum angle from the line stretching from the ViewPoint to the ViewCenter that can be viewed by the camera. This means that ViewAngle can effectively be used to zoom in on a part of the image. The default value of ViewAngle resolves to 35°, which is the typical viewing angle for the human eye.
Show[surf, ViewVertical -> {1, 0, 0}]This uses ViewAngle to effectively zoom in on the center of the image:
Show[surf, ViewAngle -> 10Degree]When you set the options ViewPoint, ViewCenter, and ViewVertical, you can think about it as specifying how you would look at a physical object. ViewPoint specifies where your head is relative to the object. ViewCenter specifies where you are looking (the center of your gaze). And ViewVertical specifies which way up your head is.
In terms of coordinate systems, settings for ViewPoint, ViewCenter, and ViewVertical specify how coordinates in the three‐dimensional box should be transformed into coordinates for your image in the final display area.
| ViewVector->Automatic | uses the values of the ViewPoint and ViewCenter options to determine the position and facing of the simulated camera |
| ViewVector->{x,y,z} | position of the camera in the coordinates used for objects; the facing of the camera is determined by the ViewCenter option |
| ViewVector->{{x,y,z},{tx,ty,tz}} | position of the camera and of the point the camera is focused on in the coordinates used for objects |
Possible values of the ViewVector option.
The position and facing of the camera can be fully determined by the ViewPoint and ViewCenter options, but the ViewVector option offers a useful generalization. Instead of specifying the position and facing of the camera using scaled coordinates, ViewVector provides the ability to position the camera using the same coordinate system used to position objects within the graphic.
This specifies that the camera should be placed on the negative  axis and facing toward the center of the graphic:
Show[surf, ViewVector -> {-5, 0, 0}]The camera is in the same position but pointing in a different direction. In combination with ViewAngle, this zooms in on a particular section of the graphic:
Show[surf, ViewVector -> {{-5, 0, 0}, {2, -3, 2}}, ViewAngle -> 20 Degree]Once you have obtained a two‐dimensional image of a three‐dimensional object, there are still some issues about how this image should be rendered. The issues, however, are identical to those that occur for two‐dimensional graphics. Thus, for example, you can modify the final shape of your image by changing the AspectRatio option. And you specify what region of your whole display area your image should take up by setting the PlotRegion option.
drag
| rotate the graphic about its center |
Ctrl
+
drag
| zoom into or out of the graphic |
Shift
+
drag
| pan across the graphic in the plane of the screen |
When interactively modifying graphics, the Wolfram Language makes changes to the view options. If you have specified the position of the camera using ViewPoint, then rotating the graphic causes the Wolfram Language to change the value of the ViewPoint option. If the position of the camera is specified using ViewVector, interactive rotation will instead change the value of that option. In both cases, interactive rotation can also affect the value of the ViewVertical option. Interactive zooming of the graphic corresponds directly to changing the ViewAngle option. Interactively panning the graphic changes values of the ViewCenter option.
Show[surf, Axes -> False, AspectRatio -> 0.3]The Wolfram Language usually scales the images of three‐dimensional objects to be as large as possible, given the display area you specify. Although in most cases this scaling is what you want, it does have the consequence that the size at which a particular three‐dimensional object is drawn may vary with the orientation of the object. You can set the option SphericalRegion->True to avoid such variation. With this option setting, the Wolfram Language effectively puts a sphere around the three‐dimensional bounding box, and scales the final image so that the whole of this sphere fits inside the display area you specify. The sphere has its center at the center of the bounding box, and is drawn so that the bounding box just fits inside it.
Framed[Show[surf, BoxRatios -> {1, 5, 1}]]With SphericalRegion->True, the final image is scaled so that a sphere placed around the bounding box would fit in the display area:
Framed[Show[surf, BoxRatios -> {1, 5, 1}, SphericalRegion -> True]]By setting SphericalRegion->True, you can make the scaling of an object consistent for all orientations of the object. This is useful if you create animated sequences that show a particular object in several different orientations.
| SphericalRegion->False | scale three‐dimensional images to be as large as possible |
| SphericalRegion->True | scale images so that a sphere drawn around the three‐dimensional bounding box would fit in the final display area |
With the default option setting Lighting->Automatic, the Wolfram Language uses a simulated lighting model to determine how to color polygons in three‐dimensional graphics.
The Wolfram Language allows you to specify various components to the illumination of an object. One component is the "ambient lighting", which produces uniform shading all over the object. Other components are directional, and produce different shading on different parts of the object. "Point lighting" simulates light emanating in all directions from one point in space. "Spot lighting" is similar to point lighting, but emanates a cone of light in a particular direction. "Directional lighting" simulates a uniform field of light pointing in the given direction. The Wolfram Language adds together the light from all of these sources in determining the total illumination of a particular polygon.
| {"Ambient",color} | uniform ambient lighting |
| {"Directional",color,{pos1,pos2}} | directional lighting parallel to the vector from pos1 to pos2 |
| {"Point",color,pos} | spherical point light source at position pos |
| {"Spot",color,{pos,tar},α} | spotlight at position pos aimed at the target position tar with a half-angle opening of α |
| Lighting->{light1,light2,…} | a number of lights |
The default lighting used by the Wolfram Language involves three point light sources, and no ambient component. The light sources are colored respectively red, green and blue, and are placed at  angles on the right‐hand side of the object.
spheres = Graphics3D[{Sphere[{-1, -1, 0}], Sphere[{-1, 1, 0}], Sphere[{1, 1, 0}], Sphere[{1, -1, 0}]}, Axes -> True, AxesLabel -> {"x", "y", "z"}]This shows the result of adding ambient light, and removing all point light sources. Note the Lighting option takes a list of light sources:
Show[spheres, Lighting -> {{"Ambient", Blue}}]This adds a single point light source positioned at the red point. The lights are combined as appropriate:
Show[{spheres, Graphics3D[{Red, PointSize[Large], Point[{0, 0, 2}]}]}, Lighting -> {{"Ambient", Blue}, {"Point", Red, {0, 0, 2}}}]Objects do not block light sources or cast shadows, so all objects in a scene will be lit evenly by light sources:
Show[{spheres, Graphics3D[{Red, PointSize[Large], Point[{3, 0, 0}]}]}, Lighting -> {{"Ambient", Blue}, {"Point", Red, {3, 0, 0}}}]This adds a directional green light shining from the negative  direction, effectively an infinite distance away:
Show[%, Lighting -> {{"Ambient", Blue}, {"Point", Red, {3, 0, 0}}, {"Directional", Green, {{0, 0, 0}, {0, 1, 0}}}}]Plot3D[Sin[x + Sin[y]], {x, -3, 3}, {y, -3, 3}, Lighting -> {{"Ambient", RGBColor[0, 0, .6]}, {"Spot", Red, {{0, 0, 5}, {0, 0, 0}}, 15 Degree}}]The Lighting option controls the lighting of all objects in a scene when used as an option to Graphics3D or Show. Lighting can also be used inline as a directive which specifies lighting for particular objects. The Lighting directive replaces the inherited lighting specifications.
The Lighting directive replaces the default value of Lighting for the two spheres after the directive:
Graphics3D[{Sphere[{0, 0, 0}], Lighting -> {{"Point", Green, {0, 0, 5}}}, Sphere[{1, 1, 1}], Sphere[{2, 2, 2}]}]This example uses list braces to restrict the effect of the Lighting directive to the middle sphere:
Graphics3D[{Sphere[{0, 0, 0}], {Lighting -> {{"Point", Green, {0, 0, 5}}}, Sphere[{1, 1, 1}]}, Sphere[{2, 2, 2}]}]The perceived color of a polygon depends not only on the light which falls on the polygon, but also on how the polygon reflects that light. You can use the graphics directives RGBColor, Specularity, and Glow to specify the way that polygons reflect or emit light.
If you do not explicitly use these coloring directives, the Wolfram Language effectively assumes that all polygons have matte white surfaces. Thus the polygons reflect light of any color incident on them, and do so equally in all directions. This is an appropriate model for materials such as uncoated white paper.
Using RGBColor, Specularity, and Glow, however, you can specify more complicated models. These directives separately specify three kinds of light emission: diffuse reflection, specular reflection, and glow.
In diffuse reflection, light incident on a surface is scattered equally in all directions. When this kind of reflection occurs, a surface has a "dull" or "matte" appearance. Diffuse reflectors obey Lambert's law of light reflection, which states that the intensity of reflected light is  times the intensity of the incident light, where
  is the angle between the incident light direction and the surface normal vector. Note that when
  , there is no reflected light.
In specular reflection, a surface reflects light in a mirror‐like way. As a result, the surface has a "shiny" or "gloss" appearance. With a perfect mirror, light incident at a particular angle is reflected at exactly the same angle. Most materials, however, scatter light to some extent, and so lead to reflected light that is distributed over a range of angles. The Wolfram Language allows you to specify how broad the distribution is by giving a specular exponent, defined according to the Phong lighting model. With specular exponent  , the intensity of light at an angle
  away from the mirror reflection direction is assumed to vary like
  . As
. As  , therefore, the surface behaves like a perfect mirror. As
  decreases, however, the surface becomes less "shiny", and for
  , the surface is a completely diffuse reflector. Typical values of
  for actual materials range from about 1 to several hundred.
Glow is light radiated from a surface at a certain color and intensity of light that is independent of incident light.
Most actual materials show a mixture of diffuse and specular reflection, and some objects glow in addition to reflecting light. For each kind of light emission, an object can have an intrinsic color. For diffuse reflection, when the incident light is white, the color of the reflected light is the material's intrinsic color. When the incident light is not white, each color component in the reflected light is a product of the corresponding component in the incident light and in the intrinsic color of the material. Similarly, an object may have an intrinsic specular reflection color, which may be different from its diffuse reflection color, and the specularly reflected light is a componentwise product of the incident light and the intrinsic specular color. For glow, the color emitted is determined by intrinsic properties alone, with no dependence on incident light.
In the Wolfram Language, you can specify light properties by giving any combination of diffuse reflection, specular reflection, and glow directives. To get no reflection of a particular kind, you may give the corresponding intrinsic color as Black, or GrayLevel[0]. For materials that are effectively "white", you can specify intrinsic colors of the form GrayLevel[a], where a is the reflectance or albedo of the surface.
| GrayLevel[a] | matte surface with albedo a |
| RGBColor[r,g,b] | matte surface with intrinsic color |
| Specularity[spec,n] | surface with specularity spec and specular exponent n; spec can be a number between 0 and 1 or an RGBColor specification |
| Glow[col] | glowing surface with color col |
This shows a sphere with the default matte white surface, illuminated by several colored light sources:
Graphics3D[Sphere[]]This makes the sphere have low diffuse reflectance, but high specular reflectance. As a result, the sphere has a "specular highlight" near the light sources, and is quite dark elsewhere:
Graphics3D[{GrayLevel[0.2], Specularity[0.8, 5], Sphere[]}]When you set up light sources and surface colors, it is important to make sure that the total intensity of light reflected from a particular polygon is never larger than 1. You will get strange effects if the intensity is larger than 1.
The Wolfram Language provides various options for labeling three‐dimensional graphics. Some of these options are directly analogous to those for two‐dimensional graphics, discussed in "Labeling Two-Dimensional Graphics". Others are different.
| Boxed->True |
draw a cuboidal bounding box around the graphics (default)
|
| Axes->True | draw |
| Axes->{False,False,True} | draw the |
| FaceGrids->All | draw grid lines on the faces of the box |
| PlotLabel->text | give an overall label for the plot |
The default for Graphics3D is to include a box, but no other forms of labeling:
Graphics3D[PolyhedronData["Dodecahedron", "GraphicsComplex"]]Show[%, Axes -> True]Show[%, FaceGrids -> All]| BoxStyle->style | specify the style for the box |
| AxesStyle->style | specify the style for the axes |
| AxesStyle->{xstyle,ystyle,zstyle} | specify separate styles for each axis |
Graphics3D[PolyhedronData["Dodecahedron", "GraphicsComplex"], BoxStyle -> Dashing[{0.02, 0.02}], Axes -> True, AxesStyle -> Thickness[0.01]]By setting the option Axes->True, you tell the Wolfram Language to draw axes on the edges of the three‐dimensional box. However, for each axis, there are in principle four possible edges on which it can be drawn. The option AxesEdge allows you to specify on which edge to draw each of the axes.
| AxesEdge->Automatic | use an internal algorithm to choose where to draw all axes |
| AxesEdge->{xspec,yspec,zspec} | give separate specifications for each of the |
| None | do not draw this axis |
| Automatic | decide automatically where to draw this axis |
| {diri,dirj} | specify on which of the four possible edges to draw this axis |
This draws the  on the edge with larger
  and
and  coordinates, draws no
  axis, and chooses automatically where to draw the
  axis:
axis:
Show[%, Axes -> True, AxesEdge -> {{1, 1}, None, Automatic}]When you draw the  axis on a three‐dimensional box, there are four possible edges on which the axis can be drawn. These edges are distinguished by having larger or smaller
  and
and  coordinates. When you use the specification
 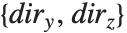 for where to draw the
  axis, you can set the
  to be +1 or -1 to represent larger or smaller values for the
  and
and  coordinates.
| AxesLabel->None | give no axis labels |
| AxesLabel->zlabel | put a label on the |
| AxesLabel->{xlabel,ylabel,zlabel} | put labels on all three axes |
You can use AxesLabel to label edges of the box, without necessarily drawing scales on them:
Show[PolyhedronData["Dodecahedron"], Axes -> True, AxesLabel -> {"x", "y", "z"}, Ticks -> None]| Ticks->None | draw no tick marks |
| Ticks->Automatic | place tick marks automatically |
| Ticks->{xticks,yticks,zticks} | specify tick marks for each axis |
Settings for the Ticks option.
You can give the same kind of tick mark specifications in three dimensions as were described for two‐dimensional graphics in "Labeling Two-Dimensional Graphics".
| FaceGrids->None | draw no grid lines on faces |
| FaceGrids->All | draw grid lines on all faces |
| FaceGrids->{face1,face2,…} | draw grid lines on the faces specified by the facei |
| FaceGrids->{{face1,{xgrid1,ygrid1}},…} | use xgridi, ygridi to determine where and how to draw grid lines on each face |
The Wolfram Language allows you to draw grid lines on the faces of the box that surrounds a three‐dimensional object. If you set FaceGrids->All, grid lines are drawn in gray on every face. By setting FaceGrids->{face1,face2,…} you can tell the Wolfram Language to draw grid lines only on specific faces. Each face is specified by a list 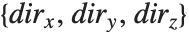 , where two of the
  must be 0, and the third one is +1 or -1. For each face, you can also explicitly tell the Wolfram Language where and how to draw the grid lines, using the same kind of specifications as you give for the GridLines option in two‐dimensional graphics.
Show[PolyhedronData["Dodecahedron"], FaceGrids -> {{0, 0, 1}, {0, 0, -1}}]| Point[{pt1,pt2,…}] | a multipoint consisting of points at pt1, pt2, … |
| Line[{line1,line2,…}] | a multiline consisting of lines line1, line2, … |
| Polygon[{poly1,poly2,…}] | a multipolygon consisting of polygons poly1, poly2, … |
Some primitives have multi-element forms that can be processed and rendered more quickly by the Wolfram System front end than the equivalent individual primitives. For large numbers of primitives, using the multi-element forms can also significantly reduce the sizes of notebook files. Notebooks that use multi-element forms can be less than half the size of those that do not, and render up to ten times faster.
Graphics[Point[Table[RandomReal[NormalDistribution[0, 1], 2], {10000}]]]| GraphicsComplex[{pt1,pt2,…},data] | a graphics complex in which coordinates given as integers i in graphics primitives in data are taken to be pti |
When many primitives share the same coordinate data, as in meshes and graphs, further efficiency can be gained by using GraphicsComplex to factor out the coordinate data. The output of the Wolfram Language's surface- and graph-plotting functions typically use this representation.
Graphics[GraphicsComplex[{{0, 0}, {0, 1}, {1, 1}, {1, 0}, {.5, .5}}, {Line[{{1, 2, 3}, {5, 4}}], Red, PointSize[.05], Point[{1, 2, 3, 4, 5}]}]]In addition to being efficient, GraphicsComplex is useful interactively. Primitives that share coordinates stay connected when one of them is dragged.
Because the output of GraphPlot is a GraphicsComplex, the graph stays connected when any part of it is dragged:
GraphPlot[Table[i -> Mod[i^2 - 199, 10], {i, 1, 22}]]Any primitive may be used within a GraphicsComplex, and GraphicsComplex can be used in both 2D and 3D graphics. Within GraphicsComplex, coordinate positions in primitives are replaced by indices into the coordinate data in the GraphicsComplex.
This GraphicsComplex combines several types of primitives:
Graphics3D[GraphicsComplex[Table[{i, i, i}, {i, 1, 5}], {
	Sphere[4, 1.5],
	Text[Style[∫f[x]ⅆx, 36], 4],
	Point[Range[5]]
	}]]
GraphicsComplex is especially useful for representing meshes of polygons. By using GraphicsComplex, numerical errors that could cause gaps between adjacent polygons are avoided.
Plot3D[Sin[x] y ^ 2, {x, 0, 22}, {y, 0, 4}]| BaseStyle->value | an option for the text style in a graphic |
| FormatType->value | an option for the text format type in a graphic |
Plot[Sin[x] ^ 2, {x, 0, 2 Pi}, PlotLabel -> Sin[x] ^ 2]Plot[Sin[x] ^ 2, {x, 0, 2 Pi}, PlotLabel -> Sin[x] ^ 2, BaseStyle -> {FontWeight -> "Bold", FontSize -> 12}]Plot[Sin[x] ^ 2, {x, 0, 2 Pi}, PlotLabel -> Sin[x] ^ 2, FormatType -> StandardForm]SetOptions[Plot, BaseStyle -> {FontFamily -> "Times", FontSize -> 14}];Plot[Sin[x] ^ 2, {x, 0, 2 Pi}, PlotLabel -> Sin[x] ^ 2]| "style" | a named style in your current stylesheet |
| FontSize->n | the size of font to use in printer’s points |
| FontSlant->"Italic" | use an italic font |
| FontWeight->"Bold" | use a bold font |
| FontFamily->"name" |
specify the name of the font family to use (e.g.
"Times"
,
"Courier"
,
"Helvetica"
)
|
Typical elements used in the setting for BaseStyle.
If you use the standard notebook front end for the Wolfram Language, then you can set BaseStyle to be the name of a style defined in your current notebook's stylesheet. You can also explicitly specify how text should be formatted by using options such as FontSize and FontFamily. Note that FontSize gives the absolute size of the font to use, measured in units of printer’s points, with one point being  inches. If you resize a plot whose font size is specified as a number, the text in it will not by default change size: to get text of a different size you must explicitly specify a new value for the FontSize option. If you resize a plot whose font size is specified as a scaled quantity, the font will scale as the plot is resized. With FontSize->Scaled[s], the effective font size will be s scaled units in the plot.
Plot[Sin[x] ^ 2, {x, 0, 2 Pi}, BaseStyle -> {FontSize -> Scaled[.05]}]| Style[expr,"style"] | output expr in the specified style |
| Style[expr,options] | output expr using the specified font and style options |
| StandardForm[expr] | output expr in StandardForm |
Plot[Sin[x] ^ 2, {x, 0, 2 Pi}, PlotLabel -> Style[Sin[x] ^ 2, "Section"]]Plot[Sin[x] ^ 2, {x, 0, 2 Pi}, PlotLabel -> Style[Sin[x] ^ 2, "Section", FontSlant -> "Italic"]]Plot[Sin[x] ^ 2, {x, 0, 2 Pi}, PlotLabel -> Style[StandardForm[Sin[x] ^ 2], FontSize -> 12]]You should realize that the ability to refer to styles such as "Section" depends on using the standard Wolfram Language notebook front end. Even if you are just using a text‐based interface to the Wolfram Language, however, you can still specify formatting of text in graphics using options such as FontSize. The complete collection of options that you can use is given in "Text and Font Options".
With the Text graphics primitive, you can insert text at any position in two‐ or three‐dimensional Wolfram Language graphics. Unless you explicitly specify a style or font using Style, the text will be given in the graphic's base style.
| Text[expr,{x,y}] | text centered at the point {x,y} |
| Text[expr,{x,y},{-1,0}] | text with its left‐hand end at {x,y} |
| Text[expr,{x,y},{1,0}] | right‐hand end at {x,y} |
| Text[expr,{x,y},{0,-1}] | centered above {x,y} |
| Text[expr,{x,y},{0,1}] | centered below {x,y} |
| Text[expr,{x,y},{dx,dy}] | text positioned so that {x,y} is at relative coordinates {dx,dy} within the box that bounds the text |
| Text[expr,{x,y},{dx,dy},{0,1}] | text oriented vertically to read from bottom to top |
| Text[expr,{x,y},{dx,dy},{0,-1}] | text that reads from top to bottom |
| Text[expr,{x,y},{dx,dy},{-1,0}] | text that is upside‐down |
Show[Graphics[Table[Text[Expand[(1 + x) ^ n], {n, n}], {n, 5}]], PlotRange -> All]Show[Graphics[Text[Style["Some text", FontSize -> 14, FontWeight -> "Bold"], {2, 2}, {-1, 0}, {0, 1}]], Frame -> True]When you specify an offset for text, the relative coordinates that are used are taken to run from  to
to  in each direction across the box that bounds the text. The point {0,0} in this coordinate system is defined to be center of the text. Note that the offsets you specify need not lie in the range
  to
to  .
.
Note that you can specify the color of a piece of text by preceding the Text graphics primitive with an appropriate RGBColor or other graphics directive.
| Text[expr,{x,y,z}] | text centered at the point {x,y,z} |
| Text[expr,{x,y,z},{sdx,sdy}] | text with a two‐dimensional offset |
Graphics3D[{PolyhedronData["Dodecahedron", "GraphicsComplex"], Text["a point", {2, 2, 2}, {1, 1}]}]Note that when you use text in three‐dimensional graphics, the Wolfram Language assumes that the text is never hidden by any polygons or other objects.
option name | default value | |
| Background | None | background color |
| BaseStyle | {} | style or font specification |
| FormatType | StandardForm | format type |
Options for Text.
Graphics[{{GrayLevel[0.5], Rectangle[{0, 0}, {1, 1}]}, Text["Some text", {0.5, 0.5}]}]Graphics[{{GrayLevel[0.5], Rectangle[{0, 0}, {1, 1}]}, Text["Some text", {0.5, 0.5}, Background -> Automatic]}]"Sound" describes how you can take functions and lists of data and produce sounds from them. This tutorial discusses how sounds are represented in the Wolfram System.
The Wolfram System treats sounds much like graphics. In fact, the Wolfram System allows you to combine graphics with sound to create pictures with "sound tracks".
In analogy with graphics, sounds in the Wolfram System are represented by symbolic sound objects. The sound objects have head Sound, and contain a list of sound primitives, which represent sounds to be played in sequence.
| Sound[{s1,s2,…}] | a sound object containing a list of sound primitives |
play = Play[(2 + Cos[20 t]) * Sin[3000 t + 2 Sin[50 t] ], {t, 0, 2}]Sound Primitives
| SampledSoundList[{a1,a2,…},r] |
a sound with a sequence of amplitude levels, sampled at rate
r
|
| SampledSoundFunction[f,n,r] | a sound whose amplitude levels sampled at rate r are found by applying the function f to n successive integers |
| SoundNote[n,t,"style"] | a note-like sound with note n, time specification t, with the specified style |
At the lowest level, all sounds in the Wolfram System are represented as a sequence of amplitude samples, or as a sequence of MIDI events. In SampledSoundList, these amplitude samples are given explicitly in a list. In SampledSoundFunction, however, they are generated when the sound is output, by applying the specified function to a sequence of integer arguments. In both cases, all amplitude values obtained must be between  and
and  . In SoundNote, a note-like sound is represented as a sequence of MIDI events that represent the frequency, duration, amplitude, and styling of the note.
Create a SampledSoundList from a numeric list, with a sample rate of 8000:
sampledSoundList = SampledSoundList[RandomReal[{-1, 1}, 10 ^ 4], 8000]Sound[sampledSoundList]Create a SampledSoundFunction from a function, with a sample rate of 8000:
sampledSoundFunction = SampledSoundFunction[Sin[0.25#]&, 8000, 8000]Sound[sampledSoundFunction]Create a SoundNote:
soundNote = SoundNote[5, 2, "Piano"]Sound[soundNote]ListPlay generates SampledSoundList primitives, while Play generates SampledSoundFunction primitives. With the default option setting Compiled->True, Play will produce a SampledSoundFunction object containing a CompiledFunction.
Once you have generated a Sound object containing various sound primitives, you must then output it as a sound. Much as with graphics, the basic scheme is to take the Wolfram System representation of the sound and convert it to a lower‐level form that can be handled by an external program, such as a Wolfram System front end.
Sound[{sampledSoundList, sampledSoundFunction, soundNote}]Sound[{Sound[sampledSoundList, {0, 1}], Sound[sampledSoundFunction, {0, 1}]}]The low‐level representation of sampled sound used by the Wolfram System consists of a sequence of hexadecimal numbers specifying amplitude levels. Within the Wolfram System, amplitude levels are given as approximate real numbers between  and
and  . In producing the low‐level form, the amplitude levels are "quantized". You can use the option SampleDepth to specify how many bits should be used for each sample. The default is SampleDepth->8, which yields 256 possible amplitude levels, sufficient for most purposes. The low-level representation of note-based sound is as a time-quantized byte stream of MIDI events that specify various parameters about the note objects. The quantization of time is determined automatically at playback.
You can use the option SampleDepth in Play and ListPlay. In sound primitives, you can specify the sample depth by replacing the sample rate argument by the list {rate,depth}.
Import/Export
It is possible to import audio data from a file on the local file system or from any accessible remote location.
snd = Import["ExampleData/Rule30.wav", "Sound"]Use Export to write a sound to disk.
Write the imported Sound to disk:
Export["soundbite.wav", snd]The Wolfram Language allows you to export graphics and sounds in a wide variety of formats. If you use the notebook front end for the Wolfram Language, then you can typically just copy and paste graphics and sounds directly into other programs using the standard mechanism available on your computer system.
| Export["name.ext",graphics] | export graphics to a file in a format deduced from the file name |
| Export["file",graphics,"format"] | export graphics in the specified format |
| Export["!command",graphics,"format"] | export graphics to an external command |
| Export["file",{g1,g2,…},…] | export a sequence of graphics for an animation |
| ExportString[graphics,"format"] | generate a string representation of exported graphics |
| "EPS" |
Encapsulated PostScript (
.eps
)
|
| "PDF" |
Adobe Acrobat portable document format (
.pdf
)
|
| "SVG" |
Scalable Vector Graphics (
.svg
)
|
| "PICT" | Macintosh PICT |
| "WMF" |
Windows metafile format (
.wmf
)
|
| "TIFF" |
TIFF (
.tif
,
.tiff
)
|
| "GIF" |
GIF and animated GIF (
.gif
)
|
| "JPEG" |
JPEG (
.jpg
,
.jpeg
)
|
| "PNG" |
PNG format (
.png
)
|
| "BMP" |
Microsoft bitmap format (
.bmp
)
|
| "PCX" |
PCX format (
.pcx
)
|
| "XBM" |
X window system bitmap (
.xbm
)
|
| "PBM" |
portable bitmap format (
.pbm
)
|
| "PPM" |
portable pixmap format (
.ppm
)
|
| "PGM" |
portable graymap format (
.pgm
)
|
| "PNM" |
portable anymap format (
.pnm
)
|
| "DICOM" |
DICOM medical imaging format (
.dcm
,
.dic
)
|
| "AVI" |
Audio Video Interleave format (
.avi
)
|
Typical graphics formats supported by the Wolfram Language. Formats in the first group are resolution independent.
Plot[Sin[x] + Sin[Sqrt[2] x], {x, 0, 10}]Export["sinplot.eps", %]When you export a graphic outside of the Wolfram Language, you usually have to specify the absolute size at which the graphic should be rendered. You can do this using the ImageSize option to Export.
ImageSize->x makes the width of the graphic be x printer's points; ImageSize->72xi thus makes the width xi inches. The default is to produce an image that is four inches wide. ImageSize->{x,y} scales the graphic so that it fits in an x×y region.
| ImageSize | Automatic | absolute image size in printer's points |
| "ImageTopOrientation" | Top | how the image is oriented in the file |
| ImageResolution | Automatic | resolution in dpi for the image |
Options for Export.
Within the Wolfram Language, graphics are manipulated in a way that is completely independent of the resolution of the computer screen or other output device on which the graphics will eventually be rendered.
Many programs and devices accept graphics in resolution‐independent formats such as Encapsulated PostScript (EPS). But some require that the graphics be converted to rasters or bitmaps with a specific resolution. The ImageResolution option for Export allows you to determine what resolution in dots per inch (dpi) should be used. The lower you set this resolution, the lower the quality of the image you will get, but also the less memory the image will take to store. For screen display, typical resolutions are 72 dpi and above; for printers, 300 dpi and above.
| "WAV" |
Microsoft wave format (
.wav
)
|
| "AU" |
μ
law encoding (
.au
)
|
| "SND" |
sound file format (
.snd
)
|
| "AIFF" |
AIFF format (
.aif
,
.aiff
)
|
The Wolfram Language allows you not only to export graphics and sounds, but also to import them. With Import you can read graphics and sounds in a wide variety of formats, and bring them into the Wolfram Language as Wolfram Language expressions.
| Import["name.ext"] | import graphics from the file name.ext in a format deduced from the file name |
| Import["file","format"] | import graphics in the specified format |
| ImportString["string","format"] | import graphics from a string |
g = Import["ExampleData/ocelot.jpg"]GraphicsGrid[{{g, g}, {g, g}}]Import["ExampleData/rule30.wav", "Sound"]Import yields expressions with different structures depending on the type of data it reads. Typically you will need to know the structure if you want to manipulate the data that is returned.
| Graphics[primitives,opts] | resolution‐independent graphics |
| Image[data,opts] | resolution‐dependent bitmap images |
| {graphics1,graphics2,…} | animated graphics |
| Audio[data] | audio signals |
Structures of expressions returned by Import.
Short[InputForm[g]]d = ImageData[g];Dimensions[d]ListPlot[Sort[Flatten[d]]]Image[d ^ 2 / Max[d ^ 2]]