


GeoRegionValuePlot
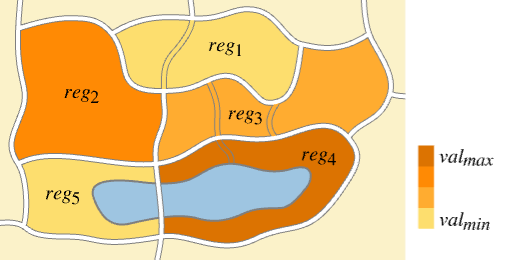
GeoRegionValuePlot[{reg1val1,reg2val2,…}]
generates a plot in which the geographic regions regi are colored according to the values vali.
GeoRegionValuePlot[regionsvalues]
uses a collection of regions regi from regions with corresponding values vali from values.
GeoRegionValuePlot[regionprop]
generates a plot in which the geographic subdivisions in region are colored according to the values EntityValue[…,prop].
GeoRegionValuePlot[data]
generates a plot using the data available in data.
Details and Options
- GeoRegionValuePlot is also known as a chloropleth map, shaded map and a thematic map.
- GeoRegionValuePlot uses color to associate numeric values with regions on a map.
- By default, GeoRegionValuePlot outlines and shades the specified regions over an unlabeled street map.
- The geographic regions regi can be given in the following forms:
-
GeoPosition[{lat,lon}] latitude and longitude Entity[…] geographic entity Dated[ent,date] dated entity GeoGroup[{…}] grouped set of entities Polygon,GeoDisk,… geographic regions - Multiple regions regions can be given in the following forms:
-
{reg1,reg2,…} list of individual regions GeoPosition[{pos1,pos2,…}] array of geo positions EntityClass[…] class of geo entities - The values vali can be given in the following forms:
-
vali positive number Quantity[vali,unit] magnitude with units RGBColor[…],Hue[…],… specific color - Multiple values values can be given in the following forms:
-
{val1,val2,…} list of individual regions QuantityArray[{val1,val2,…},unit] array of quantities - The data datai for GeoRegionValuePlot can be given in the following forms:
-
{e1,e2,…} list of elements with or without wrappers <k1e1,k2e2,…> association of keys and values WeightedData[…] positions with weights for values w[{e1,e2,…},…] wrapper applied to a whole dataset w[{data1,data1,…},…] wrapper applied to all datasets - In GeoRegionValuePlot[region"prop"], region can be given in the following forms:
-
Entity[…] an entity containing further divisons of entities EntityClass[…] a class of entities {ent1,ent2,…} a list of entities - The following wrappers can be used for chart elements:
-
Annotation[e,label] provide an annotation Button[e,action] define an action to execute when the element is clicked EventHandler[e,…] define a general event handler for the element Hyperlink[e,uri] make the element act as a hyperlink Labeled[e,…] display the element with labeling Legended[e,…] include features of the element in a chart legend PopupWindow[e,cont] attach a popup window to the element StatusArea[e,label] display in the status area when the element is moused over Style[e,opts] show the element using the specified styles Tooltip[e,label] attach an arbitrary tooltip to the element - Data not given in these forms is ignored in forming the plot.
- GeoRegionValuePlot takes the same options as GeoGraphics, with the following additions and changes: [List of all options]
-
ClippingStyle Automatic how to color regi if vali are not in PlotRange ColorFunction Automatic how to translate numerical values into colors ColorFunctionBinning None whether to bin values into discrete colors ColorFunctionScaling True whether to scale arguments to ColorFunction ColorRules Automatic specify color rules for explicit values GeoLabels None whether and how to add labels to the loci LabelingSize Automatic maximum size of callouts and labels LabelStyle Automatic graphics directives to determine style of labels MissingStyle Automatic how to display regi if vali are missing or invalid PlotLegends Automatic how the legend will appear PlotMarkers Automatic how to mark very small locations PlotRange All the range of values to display PlotStyle Automatic graphics directives to determine style of the loci ScalingFunctions None how to scale individual values TargetUnits Automatic specify units to use in the legend - ColorFunctionBinningbin specifies how to bin the values into discrete groups for computing colors.
- Possible settings for bin are:
-
None use a continuous set of colors Automatic automatically determine the bins n use n color bins "KMeans" use the k-means clustering algorithm to find the bins "Quantile" use quantiles to compute the bins {d} use bins with width d {min,max,d} use bins from min to max with width d {{b1,b2,…,bn}} use specific break points bi to separate the bins {"name",n} use a named specification with n bins - The following settings for GeoLabels can be used:
-
Automatic add text labels to graphical output None add no labels func apply the function func - PlotMarkers can take the following forms:
-
Automatic automatically chosen plot markers Polygon use polygons Point use points GeoMarker use geo markers "OpenMarkers" open shapes g markers consisting of copies of expression g {g,s} expression g at size s {Automatic,spec} automatic marker with fallback spec {Polygon,spec} polygon with fallback spec - With PlotMarkers->Automatic, polygons are used to show entity regions. A point will be used instead if no polygon is available.
- The arguments supplied to functions in GeoLabels are graphicsi, regi, EntityValue[regi,"Position"] and vali, where graphicsi is the Graphics or GeoGraphics object that marks regi, by default either a Point or a Polygon.
- The following settings for PlotRange can be used:
-
Automatic range includes all of the vali max range includes all of the vali less than max {min,max} range includes all of the vali from min to max
List of all options
Examples
open all close allBasic Examples (1)
Scope (41)
General Data (4)
Use quantities with units as values:
GeoRegionValuePlot[{Entity["Country", "Japan"] -> Quantity[5.2, "BarrelsOfOil"], Entity["Country", "SouthKorea"] -> Quantity[22.1, "BarrelsOfOil"], Entity["Country", "China"] -> Quantity[32.4, "BarrelsOfOil"], Entity["Country", "Philippines"] -> Quantity[12.5, "BarrelsOfOil"]}]GeoRegionValuePlot[<|Entity["Country", "Albania"] -> 2.4, Entity["Country", "Romania"] -> 1.2, Entity["Country", "Poland"] -> 3, Entity["Country", "Estonia"] -> 4.5|>]Use a derived list of entities in the left-hand side of a rule:
GeoRegionValuePlot[EntityList@Entity["AdministrativeDivision", {EntityProperty["AdministrativeDivision", "ParentRegion"] -> Entity["Country", "China"]}] -> "Population"]Color all the subentities of an EntityClass:
GeoRegionValuePlot[EntityClass["Country", "SouthAmerica"] -> "MerchantShips"]Special Data (7)
Use GeoDisk as region:
GeoRegionValuePlot[{GeoDisk[Entity["City", {"NewYork", "NewYork", "UnitedStates"}], Quantity[30, "Miles"]] -> 1, GeoDisk[Entity["City", {"Boston", "Massachusetts", "UnitedStates"}], Quantity[50, "Miles"]] -> 2.5, GeoDisk[Entity["City", {"Washington", "DistrictOfColumbia", "UnitedStates"}], Quantity[40, "Miles"]] -> 3.5, GeoDisk[Entity["City", {"Philadelphia", "Pennsylvania", "UnitedStates"}]] -> 5}]Use Polygon as region:
GeoRegionValuePlot[{Polygon[{GeoPosition[{35, -110}], GeoPosition[{45, -100}], GeoPosition[{35, -90}]}] -> 4.5, Polygon[{GeoPosition[{55, -100}], GeoPosition[{65, -90}], GeoPosition[{55, -80}]}] -> 1.5, Polygon[{GeoPosition[{45, -105}], GeoPosition[{45, -85}], GeoPosition[{55, -80}]}] -> 3.5}]GeoRegionValuePlot[{GeoHemisphere[Here] -> 1, GeoVisibleRegion[{0, 0, 1000000}] -> 5}, GeoProjection -> "LambertAzimuthal"]Use GeoGroup:
GeoRegionValuePlot[{GeoGroup[{Entity["Country", "France"], Entity["Country", "Spain"]}] -> 1, GeoGroup[{Entity["Country", "Hungary"], Entity["Country", "Germany"]}] -> 3, Entity["Country", "Italy"] -> 5}]Use quantities with units as values:
GeoRegionValuePlot[{Entity["Country", "Japan"] -> Quantity[5.2, "BarrelsOfOil"], Entity["Country", "SouthKorea"] -> Quantity[22.1, "BarrelsOfOil"], Entity["Country", "China"] -> Quantity[32.4, "BarrelsOfOil"], Entity["Country", "Philippines"] -> Quantity[12.5, "BarrelsOfOil"]}]Use QuantityArray for the values:
countries = EntityClass["Country", "SouthAmerica"];
populationdensity = QuantityArray[EntityValue[countries, "PopulationDensity"]]GeoRegionValuePlot[countries -> populationdensity]Mix cities and countries and use explicit colors:
GeoRegionValuePlot[{["Ilmenau"] -> RGBColor[0.17, 0.71, 0.6], ["Spain"] -> RGBColor[0, 0, 1], ["Germany"] -> RGBColor[0.88, 1, 0.88], ["France"] -> RGBColor[0.7, 0.9, 0.4]}]Data Wrappers (5)
Wrap a Tooltip on data:
GeoRegionValuePlot[{Tooltip[Entity["AdministrativeDivision", {"Illinois", "UnitedStates"}] -> 10, Blue], Entity["AdministrativeDivision", {"Iowa", "UnitedStates"}] -> 19.8, Entity["AdministrativeDivision", {"Minnesota", "UnitedStates"}] -> 5, Entity["AdministrativeDivision", {"Wisconsin", "UnitedStates"}] -> 15}]Override the default tooltips:
GeoRegionValuePlot[{Entity["AdministrativeDivision", {"NewJersey", "UnitedStates"}] -> 150, Tooltip[Entity["City", {"NewYork", "NewYork", "UnitedStates"}] -> 200, "New York"]}]Use any object in the tooltip:
data = Table[Tooltip[c -> c["GDP"], c["Flag"]], {c, CountryData["G7"]}];GeoRegionValuePlot[data]Wrap Style, StatusArea and Button:
GeoRegionValuePlot[{Style[Entity["AdministrativeDivision", {"Illinois", "UnitedStates"}] -> 10, Blue], StatusArea[Entity["AdministrativeDivision", {"Iowa", "UnitedStates"}], "Iowa"] -> 19.8, Button[Entity["AdministrativeDivision", {"Minnesota", "UnitedStates"}], Print["Minessota"]] -> 5, Tooltip[Entity["AdministrativeDivision", {"Wisconsin", "UnitedStates"}], "Wisconsin"] -> 15}]GeoRegionValuePlot[{StatusArea[Tooltip[Entity["Country", "Spain"], "This is Spain"], "Spain"] -> 1,
Button[Tooltip[Entity["Country", "France"], "This is France"], Print["France"]] -> 5, Tooltip[Style[Entity["Country", "Germany"], Blue], "This is Germany"] -> 2.5}]Labeling and Legending (3)
Automatically add the names of the specified locations as labels:
GeoRegionValuePlot[{Entity["Country", "Spain"] -> 1.5, Entity["Country", "Italy"] -> 4.5, Entity["Country", "France"] -> 2.2}, GeoLabels -> True]Add custom labels for regions:
GeoRegionValuePlot[{Labeled[Entity["Country", "Spain"], "España", Center] -> 1.5, Entity["Country", "Italy"] -> 4.5, Entity["Country", "France"] -> 2.2}]Use tooltips to show multiple pieces of information:
GeoRegionValuePlot[{Entity["Country", "Bulgaria"], Entity["Country", "Romania"], Entity["Country", "Turkey"], Entity["Country", "Greece"], Entity["Country", "Italy"], Entity["Country", "Spain"]} -> "Population", GeoLabels -> (Tooltip[#1, Row[{#2, ": ", #4, ", ", EntityValue[#2, "ReligionsFractions"]}]]&)]Presentation (22)
Color regions using an existing color scheme:
GeoRegionValuePlot[Entity["Country", "China"] -> "Population", ColorFunction -> "TemperatureMap"]Use equally sized bins for coloring the map:
GeoRegionValuePlot[Entity["Country", "China"] -> "Population", ColorFunctionBinning -> Automatic]Use a clustering algorithm to compute the bins:
GeoRegionValuePlot[Entity["Country", "China"] -> "Population", ColorFunctionBinning -> "KMeans"]Mark locations with a special character:
GeoRegionValuePlot[{Entity["AdministrativeDivision", {"Ontario", "Canada"}] -> 19, Entity["City", {"Albany", "NewYork", "UnitedStates"}] -> 1, Entity["City", {"NewYork", "NewYork", "UnitedStates"}] -> 8, Entity["City", {"Buffalo", "NewYork", "UnitedStates"}] -> 11},
  PlotMarkers -> Style["♜", 20], GeoBackground -> GeoStyling["ReliefMap"]]
Mark locations with a GeoMarker:
GeoRegionValuePlot[{Entity["City", {"Madrid", "Madrid", "Spain"}] -> 31, Entity["Country", "Andorra"] -> 45, Entity["City", {"Rome", "Lazio", "Italy"}] -> 20, Entity["Country", "Switzerland"] -> 16, Entity["City", {"Frankfurt", "Hesse", "Germany"}] -> 24, Entity["City", {"Paris", "IleDeFrance", "France"}] -> 5}, PlotMarkers -> GeoMarker]For default, all regions are shown:
GeoRegionValuePlot[EntityClass["Country", "Europe"] -> "Population"]Show points for small regions:
GeoRegionValuePlot[EntityClass["Country", "Europe"] -> "Population", PlotMarkers -> {Automatic, Point}]Show polygons of all regions with a Polygon property:
GeoRegionValuePlot[{Entity["City", {"Madrid", "Madrid", "Spain"}] -> 31, Entity["Country", "Andorra"] -> 45, Entity["City", {"Rome", "Lazio", "Italy"}] -> 20, Entity["Country", "Switzerland"] -> 16, Entity["City", {"Frankfurt", "Hesse", "Germany"}] -> 24, Entity["City", {"Paris", "IleDeFrance", "France"}] -> 5}, PlotMarkers -> Polygon]Show polygons for extended regions and GeoMarker for small regions or with no Polygon property:
GeoRegionValuePlot[{Entity["City", {"Madrid", "Madrid", "Spain"}] -> 31, Entity["Country", "Andorra"] -> 45, Entity["City", {"Rome", "Lazio", "Italy"}] -> 20, ["switzerland"] -> 16, Entity["City", {"Frankfurt", "Hesse", "Germany"}] -> 24, Entity["City", {"Paris", "IleDeFrance", "France"}] -> 5}, PlotMarkers -> {Polygon, GeoMarker}]Show Tiny "OpenMarkers" for small regions:
GeoRegionValuePlot[EntityClass["Country", "Europe"] -> "Population", PlotMarkers -> {Automatic, {"OpenMarkers", Tiny}}]Use a Point for all regions and label regions with a Tooltip:
GeoRegionValuePlot[EntityClass["Country", "Europe"] -> "Population", PlotMarkers -> Point, GeoLabels -> (Tooltip[#1, Column[{#2, #4}]]&)]Specify that missing data should be colored green with a dashed outline:
GeoRegionValuePlot[EntityClass["Country", "Europe"] -> "GreenhouseGasEmissions", MissingStyle -> Directive[Green, EdgeForm[Dashed]]]Change the style of the automatically generated labels:
GeoRegionValuePlot[{Entity["City", {"Houston", "Texas", "UnitedStates"}] -> 4, Entity["City", {"Atlanta", "Georgia", "UnitedStates"}] -> 3}, GeoLabels -> True, LabelStyle -> {13, Bold, Italic, Purple}]Use EdgeForm to change the outline of extended regions:
GeoRegionValuePlot[{Entity["Country", "Ukraine"] -> 2, Entity["Country", "Belarus"] -> 8, Entity["Country", "Poland"] -> 5.4},
PlotStyle -> Directive[EdgeForm[{Thick, Opacity[1], Dashing[.05], Black}]]]
Color clipped regions lighter blue if the value is too low and darker blue if the value is too high:
GeoRegionValuePlot[EntityClass["Country", "SouthAmerica"] -> "Population", ClippingStyle -> {Lighter[Blue], Darker[Blue]}, PlotRange -> {10 ^ 6, 99999999}]Color clipped regions light gray:
GeoRegionValuePlot[EntityClass["Country", "SouthAmerica"] -> "Population", ClippingStyle -> LightGray, PlotRange -> {10 ^ 6, 99999999}]GeoRegionValuePlot[EntityClass["Country", "SouthAmerica"] -> "Population", ClippingStyle -> None, PlotRange -> {10 ^ 6, 99999999}]Color only clipped regions when the value is too high:
GeoRegionValuePlot[EntityClass["Country", "SouthAmerica"] -> "Population", ClippingStyle -> {None, Red}, PlotRange -> {10 ^ 6, 99999999}]GeoRegionValuePlot[Entity["Country", "UnitedStates"] -> "Population", PlotLegends -> None]Change the location of the legend:
GeoRegionValuePlot[Entity["Country", "UnitedStates"] -> "Population", PlotLegends -> Placed[Automatic, Left]]Use a continuous gradient coloring for the plot and the legend:
GeoRegionValuePlot[EntityValue[Entity["Country", "UnitedStates"], "AdministrativeDivisions"] -> "Population", PlotLegends -> Placed[Automatic, Left], ColorFunction -> "Rainbow"]Draw a relief map background for the map:
GeoRegionValuePlot[Entity["GeographicRegion", "Africa"][EntityProperty["GeographicRegion", "Countries"]] -> "Population", GeoBackground -> "ReliefMap"]Specify a specific location for the center of the map:
GeoRegionValuePlot[{Entity["Country", "China"], Entity["Country", "India"], Entity["Country", "UnitedStates"], Entity["Country", "Brazil"], Entity["Country", "Australia"]} -> "Population", GeoCenter -> {0, -180}]GeoRegionValuePlot[Entity["Country", "UnitedStates"] -> "Population", GeoRange -> {GeoPosition[{30, -120}], GeoPosition[{50, -90}]}]Options (62)
AspectRatio (4)
By default, the ratio of the height to width for the plot is determined automatically:
GeoRegionValuePlot[EntityClass["Country", "SouthAmerica"] -> "Population"]Make the height the same as the width with AspectRatio1:
GeoRegionValuePlot[EntityClass["Country", "SouthAmerica"] -> "Population", AspectRatio -> 1]Use numerical value to specify the height to width ratio:
GeoRegionValuePlot[EntityClass["Country", "SouthAmerica"] -> "Population", AspectRatio -> 1 / GoldenRatio]AspectRatioFull adjusts the height and width to tightly fit inside other constructs:
plot = GeoRegionValuePlot[EntityClass["Country", "SouthAmerica"] -> "Population", AspectRatio -> Full];{Framed[Pane[plot, {75, 200}]], Framed[Pane[plot, {150, 150}]], Framed[Pane[plot, {200, 100}]]}Axes (3)
By default, Axes are not drawn:
GeoRegionValuePlot[EntityClass["Country", "SouthAmerica"] -> "Population"]Use AxesTrue to turn on axes:
GeoRegionValuePlot[EntityClass["Country", "SouthAmerica"] -> "Population", Axes -> True]Turn each axis on individually:
{GeoRegionValuePlot[EntityClass["Country", "SouthAmerica"] -> "Population", Axes -> {True, False}], GeoRegionValuePlot[EntityClass["Country", "SouthAmerica"] -> "Population", Axes -> {False, True}]}AxesLabel (3)
No axes labels are drawn by default:
GeoRegionValuePlot[EntityClass["Country", "Europe"] -> "Population", Axes -> True]GeoRegionValuePlot[EntityClass["Country", "Europe"] -> "Population", Axes -> True, AxesLabel -> y]GeoRegionValuePlot[EntityClass["Country", "Europe"] -> "Population", Axes -> True, AxesLabel -> {x, y}]AxesOrigin (2)
The position of the axes is determined automatically:
GeoRegionValuePlot[EntityClass["Country", "Europe"] -> "Population", Axes -> True]Specify an explicit origin for the axes:
GeoRegionValuePlot[EntityClass["Country", "Europe"] -> "Population", Axes -> True, AxesOrigin -> {.4, .4}]AxesStyle (4)
Change the style for the axes:
GeoRegionValuePlot[EntityClass["Country", "SouthAmerica"] -> "Population", Axes -> True, AxesStyle -> Red]Specify the style of each axis:
GeoRegionValuePlot[EntityClass["Country", "SouthAmerica"] -> "Population", Axes -> True, AxesStyle -> {{Thick, Brown}, {Thick, Blue}}]Use different styles for the ticks and the axes:
GeoRegionValuePlot[EntityClass["Country", "SouthAmerica"] -> "Population", Axes -> True, AxesStyle -> Green, TicksStyle -> Red]Use different styles for the labels and the axes:
GeoRegionValuePlot[EntityClass["Country", "SouthAmerica"] -> "Population", Axes -> True, AxesStyle -> Green, LabelStyle -> Red]ClippingStyle (3)
Color clipped regions lighter blue if the value is too low and darker blue if the value is too high:
GeoRegionValuePlot[EntityClass["Country", "SouthAmerica"] -> "Population", ClippingStyle -> {Lighter[Blue], Darker[Blue]}, PlotRange -> {10 ^ 6, 99999999}]Color clipped regions light gray:
GeoRegionValuePlot[EntityClass["Country", "SouthAmerica"] -> "Population", ClippingStyle -> LightGray, PlotRange -> {10 ^ 6, 99999999}]Color only clipped regions when the value is too high:
GeoRegionValuePlot[EntityClass["Country", "SouthAmerica"] -> "Population", ClippingStyle -> {None, Red}, PlotRange -> {10 ^ 6, 99999999}]ColorFunction (1)
ColorFunctionBinning (7)
Use None to use a continuous range of colors:
GeoRegionValuePlot[EntityClass["Country", "Europe"] -> "GDP", ColorFunctionBinning -> None]Use colors corresponding to equal-width bins:
GeoRegionValuePlot[EntityClass["Country", "Europe"] -> "GDP", ColorFunctionBinning -> Automatic]Specify how large the bins should be:
GeoRegionValuePlot[EntityClass["Country", "Europe"] -> "GDP", ColorFunctionBinning -> {5 10 ^ 11}]Use the ![]() -means algorithm for find clusters of values:
-means algorithm for find clusters of values:
GeoRegionValuePlot[EntityClass["Country", "Europe"] -> "GDP", ColorFunctionBinning -> "KMeans"]Specify how many clusters to find:
GeoRegionValuePlot[EntityClass["Country", "Europe"] -> "GDP", ColorFunctionBinning -> {"KMeans", 7}]Using "Quantile" will put approximately the same number of regions in each bin:
GeoRegionValuePlot[EntityClass["Country", "Europe"] -> "GDP", ColorFunctionBinning -> "Quantile"]Some of the regions are small and may not be visible:
GeoRegionValuePlot[EntityClass["Country", "Europe"] -> "GDP", ColorFunctionBinning -> "Quantile", PlotMarkers -> {Automatic, Point}]Color the regions according to what quartile they are in:
GeoRegionValuePlot[EntityClass["Country", "Europe"] -> "GDP", ColorFunctionBinning -> {"Quantile", 4}]GeoRegionValuePlot[EntityClass["Country", "Europe"] -> "GDP", ColorFunctionBinning -> {{10 ^ 9, 10 ^ 10, 10 ^ 11, 10 ^ 12, 10 ^ 13}}]ColorFunctionScaling (1)
ColorRules (1)
Frame (4)
GeoRegionValuePlot does not use a frame by default:
GeoRegionValuePlot[Entity["Country", "China"] -> "Population"]Use FrameTrue to draw a frame around the plot:
GeoRegionValuePlot[Entity["Country", "China"] -> "Population", Frame -> True]Draw a frame on the left and right edges:
GeoRegionValuePlot[Entity["Country", "China"] -> "Population", Frame -> {{True, True}, {False, False}}]Draw a frame on the left and bottom edges:
GeoRegionValuePlot[Entity["Country", "China"] -> "Population", Frame -> {{True, False}, {True, False}}]FrameLabel (4)
Place a label along the bottom frame of a plot:
GeoRegionValuePlot[Entity["Country", "China"] -> "Population", Frame -> True, FrameLabel -> {"label"}]Frame labels are placed on the bottom and left frame edges by default:
GeoRegionValuePlot[Entity["Country", "China"] -> "Population", Frame -> True, FrameLabel -> {"latitude", "longitude"}]Place labels on each of the edges in the frame:
GeoRegionValuePlot[Entity["Country", "China"] -> "Population", Frame -> True, FrameLabel -> {{"left", "right"}, {"bottom", "top"}}]Use a customized style for both labels and frame tick labels:
GeoRegionValuePlot[Entity["Country", "China"] -> "Population", Frame -> True, FrameLabel -> {{"left", "right"}, {"bottom", "top"}}, LabelStyle -> Directive[Bold, StandardBrown]]FrameStyle (2)
Specify the style of the frame:
GeoRegionValuePlot[Entity["Country", "China"] -> "Population", Frame -> True, FrameStyle -> Directive[StandardBrown, Thick]]Specify the style for each frame edge:
GeoRegionValuePlot[Entity["Country", "China"] -> "Population", Frame -> True, FrameStyle -> {{Directive[Green, Thick], Red}, {Directive[Gray, Thick], Blue}}]GeoBackground (1)
Use the default background for map region and background:
GeoRegionValuePlot[Entity["GeographicRegion", "Africa"][EntityProperty["GeographicRegion", "Countries"]] -> "Population"]Draw a relief map background for the map:
GeoRegionValuePlot[Entity["GeographicRegion", "Africa"][EntityProperty["GeographicRegion", "Countries"]] -> "Population", GeoBackground -> "ReliefMap"]GeoCenter (1)
Maps are automatically centered based on the data:
GeoRegionValuePlot[{Entity["Country", "China"], Entity["Country", "India"], Entity["Country", "UnitedStates"], Entity["Country", "Brazil"], Entity["Country", "Australia"]} -> "Population"]Specify a specific location for the center of the map:
GeoRegionValuePlot[{Entity["Country", "China"], Entity["Country", "India"], Entity["Country", "UnitedStates"], Entity["Country", "Brazil"], Entity["Country", "Australia"]} -> "Population", GeoCenter -> {0, -45}]GeoLabels (3)
Automatically add the names of the specified locations as labels:
GeoRegionValuePlot[{Entity["Country", "SouthAfrica"] -> 2, Entity["Country", "Germany"] -> 3, Entity["Country", "Nigeria"] -> 8, Entity["City", {"LosAngeles", "California", "UnitedStates"}] -> 1.2}, GeoLabels -> Automatic]Use tooltips to show the names of locations:
GeoRegionValuePlot[{Entity["Desert", "GobiDesert::cy8gv"] -> Quantity[5.2 10^7, "Years"], Entity["Desert", "AtacamaDesert::bv7nz"] -> Quantity[8.5 10^7, "Years"], Entity["Desert", "Sahara::rhz4h"] -> Quantity[3.5 10^7, "Years"], Entity["Desert", "MojaveDesert::9wjp8"] -> Quantity[8.1 10^7, "Years"]}, GeoLabels -> (Tooltip[#1, #2]&)]Use tooltips to show multiple pieces of information:
GeoRegionValuePlot[{Entity["Country", "Bulgaria"], Entity["Country", "Turkey"], Entity["Country", "Greece"], Entity["Country", "Romania"]} -> "Population", GeoLabels -> (Tooltip[#1, Row[{#2, ": ", #4, ", ", EntityValue[#2, "ReligionsFractions"]}]]&)]GeoProjection (1)
Specify projection to use for the plot:
GeoRegionValuePlot[Entity["GeographicRegion", "Asia"][EntityProperty["GeographicRegion", "Countries"]] -> "Population"]GeoRegionValuePlot[Entity["GeographicRegion", "Asia"][EntityProperty["GeographicRegion", "Countries"]] -> "Population", GeoProjection -> "Orthographic"]GeoRange (1)
The geographic region to show is automatically determined:
GeoRegionValuePlot[Entity["Country", "UnitedStates"] -> "Population"]GeoRegionValuePlot[Entity["Country", "UnitedStates"] -> "Population", GeoRange -> {GeoPosition[{30, -120}], GeoPosition[{50, -90}]}]LabelStyle (1)
MissingStyle (1)
PlotLegends (3)
GeoRegionValuePlot[Entity["Country", "UnitedStates"] -> "Population", PlotLegends -> None]Change the location of the legend:
GeoRegionValuePlot[Entity["Country", "UnitedStates"] -> "Population", PlotLegends -> Placed[Automatic, Left]]Use a continuous gradient coloring for the plot and the legend:
GeoRegionValuePlot[EntityValue[Entity["Country", "UnitedStates"], "AdministrativeDivisions"] -> "Population", PlotLegends -> Placed[Automatic, Left], ColorFunction -> "Rainbow"]PlotMarkers (7)
Mark locations with a special character:
GeoRegionValuePlot[{Entity["AdministrativeDivision", {"Ontario", "Canada"}] -> 19, Entity["City", {"Albany", "NewYork", "UnitedStates"}] -> 1, Entity["City", {"NewYork", "NewYork", "UnitedStates"}] -> 8, Entity["City", {"Buffalo", "NewYork", "UnitedStates"}] -> 11},
  PlotMarkers -> Style["♜", 20], GeoBackground -> GeoStyling["ReliefMap"]]
Mark locations with a GeoMarker:
GeoRegionValuePlot[{Entity["City", {"Madrid", "Madrid", "Spain"}] -> 31, Entity["Country", "Andorra"] -> 45, Entity["City", {"Rome", "Lazio", "Italy"}] -> 20, Entity["Country", "Switzerland"] -> 16, Entity["City", {"Frankfurt", "Hesse", "Germany"}] -> 24, Entity["City", {"Paris", "IleDeFrance", "France"}] -> 5}, PlotMarkers -> GeoMarker]By default, all regions are shown:
GeoRegionValuePlot[EntityClass["Country", "Europe"] -> "Population"]Show points for small regions:
GeoRegionValuePlot[EntityClass["Country", "Europe"] -> "Population", PlotMarkers -> {Automatic, Point}]Show polygons of all regions with a Polygon property:
GeoRegionValuePlot[{Entity["City", {"Madrid", "Madrid", "Spain"}] -> 31, Entity["Country", "Andorra"] -> 45, Entity["City", {"Rome", "Lazio", "Italy"}] -> 20, Entity["Country", "Switzerland"] -> 16, Entity["City", {"Frankfurt", "Hesse", "Germany"}] -> 24, Entity["City", {"Paris", "IleDeFrance", "France"}] -> 5}, PlotMarkers -> Polygon]Show polygons for extended regions and GeoMarker for small regions or with no Polygon property:
GeoRegionValuePlot[{Entity["City", {"Madrid", "Madrid", "Spain"}] -> 31, Entity["Country", "Andorra"] -> 45, Entity["City", {"Rome", "Lazio", "Italy"}] -> 20, Entity["Country", "Switzerland"] -> 16, Entity["City", {"Frankfurt", "Hesse", "Germany"}] -> 24, Entity["City", {"Paris", "IleDeFrance", "France"}] -> 5}, PlotMarkers -> {Polygon, GeoMarker}]Show tiny "OpenMarkers" for small regions:
GeoRegionValuePlot[EntityClass["Country", "Europe"] -> "Population", PlotMarkers -> {Automatic, {"OpenMarkers", Tiny}}]PlotRange (1)
Use all the color contrast for the countries with fewer than 20,000,000 people:
GeoRegionValuePlot[EntityClass["Country", "SouthAmerica"] -> "Population", PlotRange -> 20 10 ^ 6]Use all the color contrast for the countries between 11,000,000 and 20,000,000 people:
GeoRegionValuePlot[EntityClass["Country", "SouthAmerica"] -> "Population", PlotRange -> {11 10 ^ 6, 20 10 ^ 6}]PlotStyle (2)
Use different style directives:
GeoRegionValuePlot[{Entity["Country", "Albania"] -> 4, Entity["Country", "France"] -> 2, Entity["Country", "Germany"] -> 3}, PlotStyle -> Directive[Opacity[.4]]]Use EdgeForm to change the outline of extended regions:
GeoRegionValuePlot[{Entity["Country", "Ukraine"] -> 2, Entity["Country", "Belarus"] -> 8, Entity["Country", "Poland"] -> 5.4},
PlotStyle -> Directive[EdgeForm[{Thick, Opacity[1], Dashing[.05], Black}]]]
TargetUnits (1)
Change the units shown in the legend:
GeoRegionValuePlot[{Entity["Country", "Malaysia"] -> Quantity[899788, "Pounds"], Entity["Country", "Indonesia"] -> Quantity[1.898 10^7, "Pounds"], Entity["Country", "Thailand"] -> Quantity[898988, "Pounds"], Entity["Country", "Cambodia"] -> Quantity[8.998 10^6, "Pounds"]}, TargetUnits -> "Kilograms"]Properties & Relations (9)
Use GeoBubbleChart to show values with scaled bubbles:
states = EntityValue[EntityClass["AdministrativeDivision", "USStatesAllStates"], EntityFunction[e, {e, e["Population"]}]];GeoBubbleChart[states]Use GeoHistogram to aggregate locations into bins:
pts = RandomGeoPosition[Entity["Country", "UnitedStates"], 500];GeoHistogram[pts, "AdministrativeDivision1"]Use GeoSmoothHistogram to generate smooth densities from locations:
pts = RandomGeoPosition[Entity["Country", "UnitedStates"], 500];GeoSmoothHistogram[pts]Use GeoListPlot for individual locations:
GeoListPlot[RandomGeoPosition[Entity["Country", "Italy"], 500]]Use GeoVectorPlot and GeoStreamPlot for vector fields:
vecs = GeoVectorENU[GeoPosition[{{41.72044646550199, -97.44319222116899},
    {46.35277665685431, -111.4315456426783}, {38.869826216010324, -106.10009940692615},
    {31.787574043650135, -96.48279364395346}, {39.852469082609225, -93.15525687634982},
   ... 25157985637201197},
   {0.4901023278760972, 0.9891989981823661}, {0.8720928861484118, 0.30133102014639235},
   {-0.9277032216653329, -0.5872478295734753}, {0.947583037831254, -0.6748021812104095},
{-0.6838608673381241, 0.12312620699389898}}];{GeoVectorPlot[vecs], GeoStreamPlot[vecs]}Draw contours on a map with GeoContourPlot:
GeoContourPlot[IconizedObject[«locs»] -> IconizedObject[«vals»]]Smoothly shade a map using color with GeoDensityPlot:
GeoDensityPlot[IconizedObject[«locs»] -> IconizedObject[«vals»]]Use GeoGraphValuePlot to show the values on geographic networks:
GeoGraphValuePlot[{{Entity["City", {"Rome", "Lazio", "Italy"}], Entity["City", {"Milan", "Lombardy", "Italy"}], 2.2}, {Entity["City", {"Milan", "Lombardy", "Italy"}], Entity["City", {"Paris", "IleDeFrance", "France"}], 2.4}, {Entity["City", {"Milan", "Lombardy", "Italy"}], Entity["City", {"Frankfurt", "Hesse", "Germany"}], 5}, {Entity["City", {"Paris", "IleDeFrance", "France"}], Entity["City", {"Frankfurt", "Hesse", "Germany"}], 3.2}, {Entity["City", {"Paris", "IleDeFrance", "France"}], Entity["City", {"Madrid", "Madrid", "Spain"}], 4.3}, {Entity["City", {"Paris", "IleDeFrance", "France"}], Entity["City", {"London", "GreaterLondon", "UnitedKingdom"}], 3.3}, {Entity["City", {"Madrid", "Madrid", "Spain"}], Entity["City", {"Seville", "Seville", "Spain"}], 3.6}, {Entity["City", {"Madrid", "Madrid", "Spain"}], Entity["City", {"Barcelona", "Barcelona", "Spain"}], 1.8}}]Plot relationships between geographic locations on a map:
GeoGraphPlot[IconizedObject[«nearest US cities»]]Neat Examples (3)
Color the countries of the world by their net migration:
GeoRegionValuePlot[CountryData[] -> "NetMigration"]Color some tall buildings by height, with rich tooltip information:
samples = BuildingData["SampleEntities"];
heights = SortBy[Transpose[{samples, BuildingData[samples, "FloorCount"]}], Last];GeoRegionValuePlot[heights, GeoLabels -> (Tooltip[#1, Column[Function[{p}, Column[{Style[p <> ":", Italic], EntityValue[#2, p]}]] /@ {"Name", "Architect", "ConstructionEndDate"}, Left, 2]]&)]Show land elevations and water depths in the region of New York City with color and tooltips:
data = MapThread[Rule, {#, Map[GeoElevationData[#]&, #, {2}]}, 2]&[Table[GeoPosition[{39.945833 + i / 5, -72.985833 - j / 5}], {i, 1, 10}, {j, 1, 10}]];GeoRegionValuePlot[(Flatten@data), GeoBackground -> GeoStyling["ReliefMap"], GeoLabels -> (Tooltip[#1, #4]&)]Text
Wolfram Research (2014), GeoRegionValuePlot, Wolfram Language function, https://reference.wolfram.com/language/ref/GeoRegionValuePlot.html (updated 2020).
CMS
Wolfram Language. 2014. "GeoRegionValuePlot." Wolfram Language & System Documentation Center. Wolfram Research. Last Modified 2020. https://reference.wolfram.com/language/ref/GeoRegionValuePlot.html.
APA
Wolfram Language. (2014). GeoRegionValuePlot. Wolfram Language & System Documentation Center. Retrieved from https://reference.wolfram.com/language/ref/GeoRegionValuePlot.html