



Plot3D
更多信息和选项
- Plot3D 也被称为曲面图(Surface Plot 或 Surface Graph).
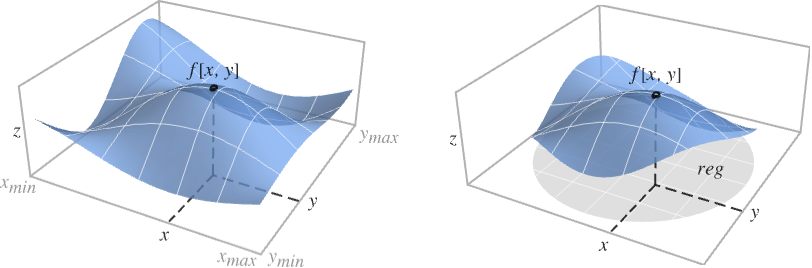
- Plot3D 在绘制域中的 x 和 y 值处计算 f,并连接点 {x,y,f[x,y]} 以形成一个曲面,显示 f 如何随 x 和 y 变化.
- 它对集合
 进行可视化.
 - 在 fi 运算为除实数以外任何值的点上都会留下间隙.
- Plot3D 将变量 x 和 y 视为局部变量,使用 Block 有效实现.
- Plot3D 有属性 HoldAll, 并仅在对变量 x 和 y 赋给特定数值后计算 f.
- 在某些情况中,在对变量 x 和 y 赋值之前,用 Evaluate 计算 f 更有效.
- 以下封装 w 可用于 fi:
-
Annotation[fi,label] 为 fi 提供注解 Button[fi,action] 当点击曲线 fi 时计算 action Callout[fi,label] 用标注标签函数 Callout[fi,label,pos] 把标注放在相关位置 pos EventHandler[fi,events] 为 fi 定义一般事件句柄 Hyperlink[fi,uri] 使函数成为超链接 Labeled[fi,label] 标签一个函数 Labeled[fi,label,pos] 把标签放在相关位置 pos Legended[fi,label] 在图例中标识函数 PopupWindow[fi,cont] 把弹出窗口附加在函数中 StatusArea[fi,label] 鼠标悬停时显示在状态区域 Style[fi,styles] 使用指定的样式显示函数 Tooltip[fi,label] 把提示条附加在函数上 Tooltip[fi] 使用函数作为提示条 - 封装 w 可用于多层:
-
w[fi] 封装 fi w[{f1,…}] 封装 fi 集合 w1[w2[…]] 使用嵌套的封装 - Callout、Labeled 和 Placed 可用于以下位置 pos:
-
Automatic 自动放置标签 Above, Below, Before, After 曲面周围的位置 {x,y} 靠近位置 {x,y} 的曲面 {x,y,z} 在位置 {x,y,z} {s,Above},{s,Below},… 在位置 s 曲面周围相关位置 {pos,epos} 放在曲面相关位置 pos 的标签 epos - Plot3D 具有同 Graphics3D 相同的属性,并可以附加下列值和变化: [所有选项的列表]
- PlotStyle->None 不绘制曲面,实际上并不消去隐含曲面.
- Plot3D 最初根据 PlotPoints 指定的等间隔的样本点来计算每个函数. 然后使用自适应的算法选择其它的样本点,划分成给定的间隔,划分次数最多为 MaxRecursion 次.
- 应该注意的是,由于使用有限数量的样本点,Plot3D 可能会遗漏函数中的特征. 如果想要检查所得结果是否正确,应尝试增大 PlotPoints 和 MaxRecursion 的设置.
- 设置 Mesh->All,Plot3D 绘制网格线来显示所有子划分.
- 默认设置 MeshFunctions->{{#1&,#2&}} 在每个曲面上绘制一个 x、y 网格线.
- MeshFunctions 和 RegionFunction 的函数变量是 x、y、z. ColorFunction 和 TextureCoordinateFunction 中的函数在默认情况下提供这些自变量的缩放版本.
- ColorFunction、MeshFunctions、RegionFunction 和 TextureCoordinateFunction 在每个曲面上都计算.
- 在默认设置 Exclusions->Automatic 和 ExclusionsStyle->None 下,Plot3D 在它检测到的不连续处断开曲面. Exclusions->None 连接不连续处.
- ScalingFunctions 的可能设置包括:
-
sz 缩放 z 轴 {sx,sy} 缩放 x 和 y 轴 {sx,sy,sz} 缩放 x、y 和 z 轴 - 各缩放函数 si 可以是字符串 "scale" 或 {g,g-1},其中 g-1 是 g 的反函数.
- Plot3D 返回 Graphics3D[GraphicsComplex[data]].
- 影响三维曲面的主题包括:
-
"DarkMesh" 暗色网格线 
"GrayMesh" 灰色网格线 
"LightMesh" 浅色网格线 
"ZMesh" 垂直分布的网格线 
"ThickSurface" 使曲面有厚度 
"FilledSurface" 在曲面下填充
所有选项的列表
范例
打开所有单元 关闭所有单元基本范例 (4)
Plot3D[Sin[x + y ^ 2], {x, -3, 3}, {y, -2, 2}]Plot3D[{x ^ 2 + y ^ 2, -x ^ 2 - y ^ 2}, {x, -2, 2}, {y, -2, 2}, ColorFunction -> "RustTones"]Plot3D[{x ^ 2 + y ^ 2, -x ^ 2 - y ^ 2}, {x, -2, 2}, {y, -2, 2}, RegionFunction -> Function[{x, y, z}, x ^ 2 + y ^ 2 ≤ 4], BoxRatios -> Automatic]Plot3D[Im[ArcSin[(x + I y) ^ 4]], {x, -2, 2}, {y, -2, 2}, Mesh -> None, PlotStyle -> Directive[Yellow, Specularity[White, 20], Opacity[0.8]], ExclusionsStyle -> {None, Red}]范围 (26)
采样 (11)
Plot3D[Sin[x y], {x, 0, 3}, {y, 0, 3}, Mesh -> All]Plot3D[1 / (x ^ 2 + y ^ 2), {x, -1, 1}, {y, -1, 1}]Plot3D[Sqrt[x y], {x, -1, 1}, {y, -1, 1}]Plot3D[Im[ArcSin[(x + I y) ^ 3]], {x, -2, 2}, {y, -2, 2}]用 PlotPoints 和 MaxRecursion 控制相应的采样:
Grid[Table[Plot3D[Sin[x y], {x, 0, 4}, {y, 0, 4}, PlotPoints -> pp, MaxRecursion -> mr, Mesh -> None], {mr, {0, 1, 2}}, {pp, {5, 15}}]]用 PlotRange 强调感兴趣的区域:
{Plot3D[x ^ 4 - 2x ^ 2 + y ^ 4 - 2y ^ 2 + 5, {x, -2, 2}, {y, -2, 2}], Plot3D[x ^ 4 - 2x ^ 2 + y ^ 4 - 2y ^ 2 + 1, {x, -2, 2}, {y, -2, 2}, PlotRange -> {-2, 2}, ClippingStyle -> None]}用 Exclusions 删除曲线或分割最后的曲面:
{Plot3D[1 / (ChebyshevU[x y - 1, 2]), {x, -5, 5}, {y, -5, 5}], Plot3D[1 / (ChebyshevU[x y - 1, 2]), {x, -5, 5}, {y, -5, 5}, Exclusions -> {x == 0, y == 0}]}用 RegionFunction 限制曲面在不等式给出的区域上:
Plot3D[Sin[x + y ^ 2], {x, -3, 3}, {y, -2, 2}, RegionFunction -> Function[{x, y, z}, 0 < x + y ^ 2 < Pi]]Plot3D[Sin[x + Cos[y]], {x, y}∈Disk[{0, 0}, 3]]用 MeshRegion 来指定变量的取值范围:
𝒟 = MeshRegion[{{0, 0}, {5, -2}, {3, 0}, {5, 2}}, Polygon[{1, 2, 3, 4}]];Plot3D[x ^ 2 + y ^ 2, {x, y}∈𝒟]Plot3D[ArcTan[x]ArcTan[y], {x, -Infinity, Infinity}, {y, -Infinity, Infinity}]标签和图例 (6)
用 Labeled 标签曲面:
Plot3D[Labeled[Sin[x + Cos[y]], "label"], {x, -3, 3}, {y, -3, 3}]用 PlotLabels 标签曲面:
Plot3D[Sin[x + Cos[y]], {x, -3, 3}, {y, -3, 3}, PlotLabels -> Sin[x + Cos[y]]]Plot3D[Labeled[Sin[x + Cos[y]], "label", {0, 0}], {x, -3, 3}, {y, -3, 3}]使用 Callout:
Plot3D[Callout[Sin[x + Cos[y]], "label", {0, 0}], {x, -3, 3}, {y, -3, 3}, PlotRange -> All]Plot3D[Callout[Sin[x + Cos[y]], "label", {2, 0, 1}], {x, -3, 3}, {y, -3, 3}, PlotRange -> All]Plot3D[{x ^ 2 + y ^ 2, -x ^ 2 - y ^ 2}, {x, -2, 2}, {y, -2, 2}, PlotLegends -> "Expressions"]使用 Legended 为指定曲线提供图例:
Plot3D[{x ^ 2 + y ^ 2, Legended[-x ^ 2 - y ^ 2, "surface"]}, {x, -2, 2}, {y, -2, 2}]使用 Placed 改变图例位置:
Plot3D[{x ^ 2 + y ^ 2, Legended[-x ^ 2 - y ^ 2, Placed["surface", Below]]}, {x, -2, 2}, {y, -2, 2}]演示 (9)
对曲面提供一个明确的 PlotStyle:
Plot3D[Sin[x + y ^ 2], {x, -2, 2}, {y, -2, 2}, PlotStyle -> Directive[Orange, Specularity[White, 20]]]Plot3D[{Sin[x], Cos[x]}, {x, 0, 2Pi}, {y, 0, 2Pi}, PlotStyle -> {Red, Blue}]Plot3D[Sin[x y], {x, 0, 3}, {y, 0, 3}, AxesLabel -> {x, y}, PlotLabel -> Sin[x y]]Plot3D[Sin[x y], {x, 0, 3}, {y, 0, 3}, ColorFunction -> Function[{x, y, z}, Hue[z]]]Plot3D[Sin[x y], {x, 0, 3}, {y, 0, 3}, ColorFunction -> "SolarColors", PlotLegends -> Automatic]Plot3D[Sin[x]Cos[y], {x, 0, 2π}, {y, 0, 2π}, PlotTheme -> "Web"]Plot3D[Sqrt[1 - x ^ 2 - y ^ 2], {x, -1, 1}, {y, -1, 1}, Mesh -> 8, ColorFunction -> Hue, MeshShading -> {{Yellow, Orange}, {Pink, Red}}]对曲面提供一个交互的 Tooltip:
Plot3D[Tooltip[Sqrt[x y]], {x, -2, 2}, {y, -2, 2}]Plot3D[Sin[x + y ^ 2], {x, -2, 2}, {y, -2, 2}, RegionFunction -> (#1 ^ 2 + #2 ^ 2 < 4&), Filling -> Bottom, FillingStyle -> Directive[Opacity[0.4], Red]]选项 (103)
Background (1)
BoundaryStyle (6)
Plot3D[Sin[x y], {x, -2, 2}, {y, -2, 2}]Plot3D[Sin[x y], {x, -2, 2}, {y, -2, 2}, BoundaryStyle -> Thick]Plot3D[Sin[x y], {x, -2, 2}, {y, -2, 2}, BoundaryStyle -> Directive[Red, Thick]]Plot3D[Sin[x y], {x, -2, 2}, {y, -2, 2}, BoundaryStyle -> None]BoundaryStyle 应用到 RegionFunction 分割的奇点上:
Plot3D[Sin[x y], {x, -2, 2}, {y, -2, 2}, BoundaryStyle -> Thick, RegionFunction -> Function[{x, y, z}, x ^ 2 + y ^ 2 ≥ 1]]BoundaryStyle 不应用到 Exclusions 分割的奇点上:
Plot3D[Im[Sqrt[x + I y]], {x, -2, 2}, {y, -2, 2}, BoundaryStyle -> Thick]BoxRatios (2)
{Plot3D[Sqrt[1 - x ^ 2 - y ^ 2], {x, 0, 1}, {y, 0, 1}], Plot3D[Sqrt[1 - x ^ 2 - y ^ 2], {x, 0, 1}, {y, 0, 1}, BoxRatios -> Automatic]}用 BoxRatios 强调某些特点,如此例中的马鞍曲面:
Plot3D[y ^ 2 - x ^ 2, {x, -4, 4}, {y, -4, 4}, MeshFunctions -> {#3&}, BoxRatios -> {1, 1, 2}]ClippingStyle (4)
Plot3D[Re[Sin[x + I y]], {x, -2Pi, 2Pi}, {y, -2Pi, 2Pi}]Plot3D[Re[Sin[x + I y]], {x, -2Pi, 2Pi}, {y, -2Pi, 2Pi}, ClippingStyle -> None]Plot3D[Re[Sin[x + I y]], {x, -2Pi, 2Pi}, {y, -2Pi, 2Pi}, ClippingStyle -> Opacity[0.5]]Plot3D[Re[Sin[x + I y]], {x, -2Pi, 2Pi}, {y, -2Pi, 2Pi}, ClippingStyle -> {Red, Blue}]ColorFunction (6)


Plot3D[Sin[x y], {x, 0, 3}, {y, 0, 3}, ColorFunction -> Function[{x, y, z}, RGBColor[x, y, 0.]]]
Plot3D[x / Exp[x ^ 2 + y ^ 2], {x, -2, 2}, {y, -2, 2}, ColorFunction -> Function[{x, y, z}, Hue[.65(1 - z)]]]预定义的颜色梯度用 ColorData:
Plot3D[x / Exp[x ^ 2 + y ^ 2], {x, -2, 2}, {y, -2, 2}, ColorFunction -> (ColorData["DarkRainbow"][#3]&)]
Plot3D[x / Exp[x ^ 2 + y ^ 2], {x, -2, 2}, {y, -2, 2}, ColorFunction -> "DarkRainbow"]ColorFunction 比 PlotStyle 有更高的优先级:
Plot3D[x / Exp[x ^ 2 + y ^ 2], {x, -2, 2}, {y, -2, 2}, ColorFunction -> "DarkRainbow", PlotStyle -> Directive[Opacity[0.5], Red]]ColorFunction 比 MeshShading 有较低的优先级:
Plot3D[x / Exp[x ^ 2 + y ^ 2], {x, -2, 2}, {y, -2, 2}, ColorFunction -> Hue, MeshShading -> {{Automatic, None}, {None, Automatic}}]ColorFunctionScaling (2)
Plot3D[Abs[Sin[x + I y]], {x, -2Pi, 2Pi}, {y, -2, 2}, ColorFunction -> Function[{x, y, z}, Hue@Rescale[Arg[Sin[x + I y]], {-Pi, Pi}]], ColorFunctionScaling -> False]


Plot3D[Sin[x y], {x, 0, 3}, {y, 0, 3}, ColorFunction -> Function[{x, y, z}, Hue[y, x, 1]], ColorFunctionScaling -> {True, False, False}]EvaluationMonitor (2)
显示 Plot3D 在函数中取样的位置:
ListPlot[Reap[Plot3D[Sin[x]Sin[y], {x, -2, 2}, {y, -3, 3}, EvaluationMonitor :> Sow[{x, y}]]][[-1, 1]]]
Block[{k = 0}, Plot3D[Sin[x y], {x, 0, 2}, {y, 0, 2}, EvaluationMonitor :> k++];k]Exclusions (5)
Plot3D[Im[ArcSin[x + I y]], {x, -2, 2}, {y, -2, 2}]Plot3D[Im[ArcSin[x + I y]], {x, -2, 2}, {y, -2, 2}, Exclusions -> None]Plot3D[1 / (ChebyshevU[x y - 1, 2]), {x, -2, 2}, {y, -2, 2}, Exclusions -> {x == 0, y == 0}]Plot3D[Im[Sqrt[x + I y]], {x, -2, 2}, {y, -2, 2}, Exclusions -> {{y == 0, x ≤ 0}}]Plot3D[Im[Sqrt[I x y] / (ChebyshevU[x ^ 2 - y ^ 2, 2])], {x, -2, 2}, {y, -2, 2}, Exclusions -> {Automatic, y ^ 2 - x ^ 2 == 1}]ExclusionsStyle (3)
Plot3D[Im[ArcSin[x + I y]], {x, -2, 2}, {y, -2, 2}, ExclusionsStyle -> {None, Directive[Thick, Blue]}]Plot3D[Im[ArcSin[x + I y]], {x, -2, 2}, {y, -2, 2}, ExclusionsStyle -> {Opacity[0.5], Directive[Thick, Blue]}]Plot3D[Im[ArcSin[x + I y]], {x, -2, 2}, {y, -2, 2}, ExclusionsStyle -> Opacity[0.5]]Filling (4)
Plot3D[Sin[x + y ^ 2], {x, -2, 2}, {y, -2, 2}, Filling -> Bottom]沿着 RegionFunction 切割的区域填充:
Plot3D[Sin[x + y ^ 2], {x, -2, 2}, {y, -2, 2}, Filling -> Bottom, RegionFunction -> (#1 ^ 2 + #2 ^ 2 < 3&)]Plot3D[Sin[x + y ^ 2], {x, -2, 2}, {y, -2, 2}, Filling -> {1 -> Top, 1 -> Bottom}, RegionFunction -> (#1 ^ 2 + #2 ^ 2 < 3&)]用蓝色对曲面 1 填充到底部,用红色对曲面 2 填充到顶部:
Plot3D[{Cos[x], Cos[x] + 1}, {x, 0, 2Pi}, {y, 0, 2Pi}, Filling -> {1 -> {Bottom, Blue}, 2 -> {Top, Red}}]FillingStyle (3)
Table[Plot3D[Sin[x + y ^ 2], {x, -2, 2}, {y, -2, 2}, Filling -> Bottom, FillingStyle -> fs], {fs, {Opacity[0.5], Orange}}]
Plot3D[Sin[x + y ^ 2], {x, -2, 2}, {y, -2, 2}, Filling -> 0, FillingStyle -> {Red, Blue}]
Plot3D[Sin[x + y ^ 2], {x, -2, 2}, {y, -2, 2}, Filling -> 0, FillingStyle -> {Red, None}]LabelingSize (2)
Plot3D[Sin[x + Cos[y]], {x, 0, 5}, {y, 0, 5}, PlotLabels -> "tropopause"]Plot3D[Sin[x + Cos[y]], {x, 0, 5}, {y, 0, 5}, PlotLabels -> "tropopause", LabelingSize -> 30]label = [image];Plot3D[Sin[x + Cos[y]], {x, 0, 5}, {y, 0, 5}, PlotLabels -> label]Plot3D[Sin[x + Cos[y]], {x, 0, 5}, {y, 0, 5}, PlotLabels -> label, LabelingSize -> 60]Plot3D[Sin[x + Cos[y]], {x, 0, 5}, {y, 0, 5}, PlotLabels -> label, LabelingSize -> Full]MaxRecursion (1)
Mesh (6)
Plot3D[Sin[x + y ^ 2], {x, -3, 3}, {y, -2, 2}, Mesh -> None]{Plot3D[Sin[x + y ^ 2], {x, -3, 3}, {y, -2, 2}, Mesh -> Full], Plot3D[Sin[x + y ^ 2], {x, -3, 3}, {y, -2, 2}, Mesh -> All]}Plot3D[Sin[x + y ^ 2], {x, -3, 3}, {y, -2, 2}, Mesh -> 5]

Plot3D[Sin[x + y ^ 2], {x, -3, 3}, {y, -2, 2}, Mesh -> {3, 6}]Plot3D[Sin[x + y ^ 2], {x, -3, 3}, {y, -2, 2}, Mesh -> {{-1, 1}, {0}}]Plot3D[Sin[x + y ^ 2], {x, -3, 3}, {y, -2, 2}, Mesh -> {{{0, Thick}}, {{0, Red}}}]MeshFunctions (3)

Plot3D[Sin[x + y ^ 2], {x, -3, 3}, {y, -2, 2}, MeshFunctions -> {#3&}, Mesh -> 5]

Plot3D[Sin[x + y ^ 2], {x, -3, 3}, {y, -2, 2}, MeshFunctions -> {#1&, #2&}, Mesh -> {5, 5}]Plot3D[Sin[x + y ^ 2], {x, -3, 3}, {y, -2, 2}, MeshFunctions -> {Sqrt[#1 ^ 2 + #2 ^ 2 + #3 ^ 2]&}, Mesh -> 5]MeshShading (4)
用 None 清除区域:
Plot3D[Sin[x y], {x, 0, 3}, {y, 0, 3}, Mesh -> 10, MeshFunctions -> {#3&}, MeshShading -> {Red, None}]Plot3D[Sin[x y], {x, 0, 3}, {y, 0, 3}, Mesh -> 7, MeshFunctions -> {#1&, #2&}, MeshShading -> {{Yellow, Green}, {Green, Yellow}}]MeshShading 比 PlotStyle 有更高的优先级:
Plot3D[Sin[x y], {x, 0, 3}, {y, 0, 3}, Mesh -> 7, PlotStyle -> Red, MeshShading -> {{Automatic, Green}, {Green, Automatic}}]MeshShading 比 ColorFunction 有更高的优先级:
Plot3D[Sin[x y], {x, 0, 3}, {y, 0, 3}, Mesh -> 10, MeshFunctions -> {#1&, #2&}, MeshShading -> {{Automatic, None}, {None, Automatic}}, ColorFunction -> "DarkRainbow"]MeshStyle (2)


NormalsFunction (3)
Plot3D[Sin[x + y ^ 2], {x, -3, 3}, {y, -2, 2}, Mesh -> None]用 None 使所有多面体获得较平阴影:
Plot3D[Sin[x + y ^ 2], {x, -3, 3}, {y, -2, 2}, NormalsFunction -> None, Mesh -> None]Plot3D[Sin[x + y ^ 2], {x, -3, 3}, {y, -2, 2}, Mesh -> None, NormalsFunction -> Function[{x, y, z}, RandomReal[{0, 1}, {3}]]]PerformanceGoal (2)
PlotLabels (3)
Plot3D[-x ^ 2 - y ^ 2, {x, -2, 2}, {y, -2, 2}, PlotLabels -> "Expressions"]Plot3D[-x ^ 2 - y ^ 2, {x, -2, 2}, {y, -2, 2}, PlotLabels -> "paraboloid"]Plot3D[{x ^ 2 + y ^ 2, -x ^ 2 - y ^ 2}, {x, 0, 2}, {y, -2, 2}, PlotLabels -> {Callout["label1", Above], Callout["label2", Below]}]PlotLegends (5)
Plot3D[{Sin[x^2 + y], Cos[x^2 + y]}, {x, 0, Pi}, {y, 0, Pi}, PlotLegends -> Automatic]Plot3D[{Sin[x^2 + y], Cos[x^2 + y]}, {x, 0, Pi}, {y, 0, Pi}, PlotLegends -> {"one", "two"}]Plot3D[{Sin[x^2 + y], Cos[x^2 + y]}, {x, 0, Pi}, {y, 0, Pi}, PlotLegends -> "Expressions"]使用 Placed 控制图例位置:
Plot3D[{Sin[x^2 + y], Cos[x^2 + y]}, {x, 0, Pi}, {y, 0, Pi}, PlotLegends -> Placed[Automatic, Below]]使用 SwatchLegend 改变外观:
Plot3D[{Sin[x^2 + y], Cos[x^2 + y]}, {x, 0, Pi}, {y, 0, Pi}, PlotLegends -> SwatchLegend[Automatic, {"surf1", "surf2"}, LegendFunction -> "Frame", LegendMargins -> 10]]Plot3D[Sin[x^2 + y], {x, 0, Pi}, {y, 0, Pi}, ColorFunction -> "Rainbow", PlotLegends -> Automatic]使用 BarLegend 改变外观:
Plot3D[Sin[x^2 + y], {x, 0, Pi}, {y, 0, Pi}, ColorFunction -> "Rainbow", PlotLegends -> BarLegend[Automatic, LegendMarkerSize -> {10, 100}]]PlotPoints (2)


PlotRange (5)

Plot3D[1 / (x ^ 2 + y ^ 2), {x, -2, 2}, {y, -2, 2}]Plot3D[1 / (x ^ 2 + y ^ 2), {x, -2, 2}, {y, -2, 2}, PlotRange -> All]

Plot3D[Sqrt[1 - x ^ 2 - y ^ 2], {x, -2, 2}, {y, -2, 2}, PlotRange -> Full]

Plot3D[Sqrt[1 - x ^ 2 - y ^ 2], {x, -2, 2}, {y, -2, 2}, PlotRange -> Automatic]
Plot3D[x ^ 2 - y ^ 2, {x, -4, 4}, {y, -4, 4}, PlotRange -> {-2, 2}]PlotStyle (5)
Plot3D[Sin[x + y ^ 2], {x, -3, 3}, {y, -2, 2}, PlotStyle -> Orange]用 Specularity 来获得高亮区:
Plot3D[Sin[x + y ^ 2], {x, -3, 3}, {y, -2, 2}, PlotStyle -> Directive[Orange, Specularity[White, 50]]]用 Opacity 获得透明曲面:
Plot3D[Sin[x + y ^ 2], {x, -3, 3}, {y, -2, 2}, PlotStyle -> Directive[Opacity[0.8], Orange, Specularity[White, 50]]]Plot3D[{Re[Sin[x + I y]], Im[Sin[x + I y]]}, {x, -2Pi, 2Pi}, {y, -2Pi, 2Pi}, PlotStyle -> {Red, Blue}]Plot3D[Sin[x + y ^ 2], {x, -3, 3}, {y, -2, 2}, PlotStyle -> None]PlotTheme (2)
Plot3D[{4 + x ^ 2 - y ^ 2, -4 - x ^ 2 + y ^ 2}, {x, -2, 2}, {y, -2, 2}, PlotTheme -> "Detailed"]Plot3D[{4 + x ^ 2 - y ^ 2, -4 - x ^ 2 + y ^ 2}, {x, -2, 2}, {y, -2, 2}, PlotTheme -> "Detailed", FaceGrids -> None]Plot3D[Sin[x], {x, 0, 2Pi}, {y, 0, π / 2}, PlotTheme -> "ThickSurface"]RegionFunction (4)


Plot3D[Sin[x + y ^ 2], {x, -2, 2}, {y, -2, 2}, RegionFunction -> Function[{x, y, z}, 2 < x ^ 2 + y ^ 2 < 5]]Filling 将填充区域边界:
Plot3D[Sin[x + y ^ 2], {x, -2, 2}, {y, -2, 2}, RegionFunction -> Function[{x, y, z}, 2 < x ^ 2 + y ^ 2 < 5], Filling -> Bottom]Plot3D[Sin[x + y ^ 2], {x, -2, 2}, {y, -2, 2}, RegionFunction -> Function[{x, y, z}, 0 < Mod[x ^ 2 + y ^ 2, 2] < 1]]Plot3D[Exp[-(x ^ 2 + y ^ 2)], {x, -2, 2}, {y, -2, 2}, RegionFunction -> Function[{x, y, z}, x < 0 || y > 0]]ScalingFunctions (9)
Plot3D[Max[x, y], {x, 0, 10}, {y, 0, 10}]
Plot3D[Max[x, y], {x, 0, 10}, {y, 0, 10}, ScalingFunctions -> "Log"]
Plot3D[Max[x, y], {x, 0, 10}, {y, 0, 10}, ScalingFunctions -> "Reverse"]
Plot3D[Max[x, y], {x, 0, 10}, {y, 0, 10}, ScalingFunctions -> "Reciprocal"]

Plot3D[Max[x, y], {x, 0, 10}, {y, 0, 10}, ScalingFunctions -> {"Reverse", "Log"}]

Plot3D[Max[x, y], {x, 0, 10}, {y, 0, 10}, ScalingFunctions -> {"Reverse", None}]Plot3D[Max[x, y], {x, 0, 10}, {y, 0, 10}, ScalingFunctions -> {{-Log[#]&, Exp[-#]&}, None}]Ticks 上的位置自动调整尺度:
Plot3D[x ^ 2 + y ^ 2, {x, 0, 10}, {y, 0, 10}, ScalingFunctions -> {"Log", None, None}, Ticks -> {2 ^ Range[10], Automatic, Automatic}]PlotRange 自动调整尺度:
Plot3D[x ^ 2 + y ^ 2, {x, 0, 10}, {y, 0, 10}, ScalingFunctions -> "Log", PlotRange -> {1, 100}]TextureCoordinateFunction (4)


Plot3D[Sin[x y], {x, 0, 3}, {y, 0, 3}, Mesh -> None, PlotStyle -> Texture[ExampleData[{"ColorTexture", "MultiSpiralsPattern"}]]]

Plot3D[Sin[x y], {x, 0, 3}, {y, 0, 3}, Mesh -> None, TextureCoordinateFunction -> ({#1, #3}&), PlotStyle -> Texture[ExampleData[{"ColorTexture", "MultiSpiralsPattern"}]]]Plot3D[Sin[x y], {x, 0, 3}, {y, 0, 3}, Mesh -> None, TextureCoordinateScaling -> False, PlotStyle -> Texture[ExampleData[{"ColorTexture", "MultiSpiralsPattern"}]]]texture = ArrayPlot[{{1, 1, 1, 2, 1, 1}, {2, 0, 0, 2, 0, 0}, {2, 0, 0, 2, 0, 0}, {2, 1, 1, 1, 1, 1}, {2, 0, 0, 2, 0, 0}, {2, 0, 0, 2, 0, 0}}, ColorRules -> {1 -> Red, 2 -> Blue, 0 -> White}, Frame -> False, PlotRangePadding -> None, ImagePadding -> None, ImageSize -> 100]Plot3D[Sin[x y], {x, 0, 3}, {y, 0, 3}, Mesh -> None, TextureCoordinateScaling -> False, PlotStyle -> Texture[texture]]TextureCoordinateScaling (1)
texture = ArrayPlot[{{1, 1, 1, 2, 1, 1}, {2, 0, 0, 2, 0, 0}, {2, 0, 0, 2, 0, 0}, {2, 1, 1, 1, 1, 1}, {2, 0, 0, 2, 0, 0}, {2, 0, 0, 2, 0, 0}}, ColorRules -> {1 -> Red, 2 -> Blue, 0 -> White}, Frame -> False, PlotRangePadding -> None, ImagePadding -> None, ImageSize -> 100]Table[Plot3D[Sin[x y], {x, 0, 3}, {y, 0, 3}, Mesh -> None, TextureCoordinateScaling -> s, PlotStyle -> Texture[texture], PlotLabel -> s], {s, {True, False}}]应用 (17)
基本应用 (7)
Plot3D[ (x^2 + y^2) Exp[1 - x^2 - y^2], {x, -3, 3}, {y, -3, 3}, PlotStyle -> Opacity[0.5], Mesh -> None, PlotPoints -> 50]用 MeshShading 在曲面上生成空洞以查看其内部结构:
Plot3D[ (x^2 + y^2) Exp[1 - x^2 - y^2], {x, -3, 3}, {y, -3, 3}, MeshShading -> {{Automatic, None}, {None, Automatic}}, PlotPoints -> 50]用 MeshFunctions 指定使用的切面:
Plot3D[ (x^2 + y^2) Exp[1 - x^2 - y^2], {x, -3, 3}, {y, -3, 3}, MeshFunctions -> {#3&}, Mesh -> 8, MeshShading -> {Automatic, None}, PlotPoints -> 50]


Plot3D[{x^2 + y^2, x^2 - y^2}, {x, -1, 1}, {y, -1, 1}, BoxRatios -> Automatic, PlotLegends -> "Expressions"]Simplify[x^2 - y^2 ≤ x^2 + y^2, {x, y}∈Reals]![TemplateBox[{p, infty}, Norm2]<=TemplateBox[{p, 2}, Norm2]<=TemplateBox[{p, 1}, Norm2]](Files/Plot3D.zh/2.png "TemplateBox[{p, infty}, Norm2]<=TemplateBox[{p, 2}, Norm2]<=TemplateBox[{p, 1}, Norm2]")
Plot3D[{Norm[{x, y}, 1], Norm[{x, y}, 2], Norm[{x, y}, ∞]}, {x, -1, 1}, {y, -1, 1}, PlotStyle -> Opacity[0.7], Mesh -> None, PlotLegends -> "Expressions"]Simplify[Norm[{x, y}, ∞] ≤ Norm[{x, y}, 2] ≤ Norm[{x, y}, 1], {x, y}∈Reals]knots = {0, 0, 0, 1 / 2, 1, 1, 1};
fx = Table[BSplineBasis[{2, knots}, i, x], {i, 0, 3}];
fy = Table[BSplineBasis[{2, knots}, i, y], {i, 0, 3}];
fxy = Times@@@Tuples[{fx, fy}];Plot3D[Evaluate@fxy, {x, 0, 1}, {y, 0, 1}, PlotRange -> All, PlotPoints -> 50, PlotLegends -> "Expressions"]


Table[Plot3D[Norm[{x, y}, p], {x, -1.5, 1.5}, {y, -1.5, 1.5}, Ticks -> None, MeshFunctions -> {#3&}, Mesh -> {{1}}, MeshStyle -> Dashed, PlotLabel -> Norm[x, p]], {p, {1, 2, 3, Infinity}}]Plot3D[y ^ 2 - x ^ 2, {x, -4, 4}, {y, -4, 4}, MeshFunctions -> {#3&}, Mesh -> {{0}}, BoxRatios -> 1]函数特征 (2)
用 RegionFunction 产生一个缺口以帮助理解极限处的情况:
Plot3D[(10 x y/2x^2 + 3y^2), {x, -3, 3}, {y, -3, 3}, RegionFunction -> Function[{x, y, z}, 2x^2 + 3y^2 > 1 / 5], Mesh -> None]{Limit[(10 x y/2x^2 + 3y^2), x -> y], Limit[(10 x y/2x^2 + 3y^2), x -> -y]}用 MeshFunctions 突出显示函数  的局部极值:
f = Sin[Sqrt[2]x + y] + Sin[y];Plot3D[f, {x, 0, 10}, {y, 0, 10}, Mesh -> None]

mfx = Function[{x, y, z}, Evaluate[D[f, x]]];Plot3D[f, {x, 0, 10}, {y, 0, 10}, MeshFunctions -> {mfx}, Mesh -> {{0}}, MeshStyle -> {{Red}}, PlotPoints -> 50]

mfy = Function[{x, y, z}, Evaluate[D[f, y]]];Plot3D[f, {x, 0, 10}, {y, 0, 10}, MeshFunctions -> {mfy}, Mesh -> {{0}}, MeshStyle -> {{Blue}}, PlotPoints -> 50]

Plot3D[f, {x, 0, 10}, {y, 0, 10}, MeshFunctions -> {mfx, mfy}, Mesh -> {{0}, {0}}, MeshStyle -> {{Red}, {Blue}}, PlotPoints -> 50]梯度场 (2)
s = StreamPlot[Evaluate@Grad[Sin[x + y ^ 2], {x, y}], {x, -3, 3}, {y, -2, 2}, Frame -> False, PlotRangePadding -> None];Plot3D[Sin[x + y ^ 2], {x, -3, 3}, {y, -2, 2}, PlotStyle -> Texture[s], Mesh -> None]v = VectorPlot[Evaluate@Grad[Sin[x + y ^ 2], {x, y}], {x, -3, 3}, {y, -2, 2}, Frame -> False, PlotRangePadding -> None];Plot3D[Sin[x + y ^ 2], {x, -3, 3}, {y, -2, 2}, PlotStyle -> Texture[v], Mesh -> None]上图(Epigraph)和下图(Hypograph) (2)




复数函数 (2)

Plot3D[{Re[Sin[x + I y]], Im[Sin[x + I y]]}, {x, -2Pi, 2Pi}, {y, 0, 2}, BoxRatios -> Automatic, Ticks -> {Range[-2Pi, 2Pi, Pi], {0, 1, 2}}, Mesh -> None, PlotStyle -> {Yellow, Cyan}, AxesLabel -> Automatic]Table[Plot3D[f[ArcSin[(x + I y) ^ 2]], {x, -2, 2}, {y, -2, 2}, Mesh -> None, PlotStyle -> Directive[Yellow, Specularity[White, 20], Opacity[0.8]], ExclusionsStyle -> {None, Red}], {f, {Re, Im, Abs, Arg}}]其他应用 (2)
NDSolve[{D[u[t, x], t] == D[u[t, x], x, x], u[0, x] == 0, u[t, 0] == Sin[t], u[t, 5] == 0}, u, {t, 0, 10}, {x, 0, 5}]Plot3D[Evaluate[u[t, x] /. %], {t, 0, 10}, {x, 0, 5}, PlotRange -> All, ColorFunction -> "SunsetColors"]Plot3D[Nest[a #(1 - #)&, x0, 100], {a, 0, 3.6}, {x0, 0.1, 0.9}, AxesLabel -> Automatic]属性和关系 (8)
Plot3D 在需要的位置取样更多的点:
Plot3D[Sin[x y], {x, 0, 3}, {y, 0, 3}, Mesh -> All]Plot3D 是 ParametricPlot 的一个特例:
{Plot3D[Sin[x y], {x, -2, 2}, {y, -2, 2}], ParametricPlot3D[{x, y, Sin[x y]}, {x, -2, 2}, {y, -2, 2}, BoxRatios -> {1, 1, 0.4}]}对于绘制数据用 ListPlot3D:
data = Table[Sin[x y], {x, 0, 3, .1}, {y, 0, 3, .1}];ListPlot3D[data]ComplexPlot3D 绘制作为高度的函数幅度,使用相位绘制颜色:
ComplexPlot3D[Sin[z] ^ 3 / (z + 1) ^ 4, {z, -5 - 5I, 5 + 5I}]Plot3D[Abs[Sin[x + I * y] ^ 3 / (x + I * y + 1) ^ 4], {x, -5, 5}, {y, -5, 5}]对一元函数用 Plot:
Plot[Sin[x] + Sin[Sqrt[2]x], {x, 0, 20}]对于平面参数曲线和区域用 ParametricPlot:
{ParametricPlot[{Cos[θ], Sin[θ]}, {θ, 0, 2Pi}], ParametricPlot[{r Cos[θ], r Sin[θ]}, {θ, 0, 2Pi}, {r, 1 / 2, 1}]}对于隐式曲面和区域用 ContourPlot3D 和 RegionPlot3D:
{ContourPlot3D[Sin[x y] == z, {x, -2, 2}, {y, -2, 2}, {z, -2, 2}],
	RegionPlot3D[Sin[x y] ≥ z, {x, -2, 2}, {y, -2, 2}, {z, -2, 2}]}
对于密度图和等高图用 DensityPlot 和 ContourPlot:
{DensityPlot[Sin[x y], {x, -2, 2}, {y, -2, 2}],
	ContourPlot[Sin[x y], {x, -2, 2}, {y, -2, 2}]}
巧妙范例 (2)
$InverseTrigFunctions = {ArcSin, ArcCos, ArcSec, ArcCsc, ArcTan, ArcCot, ArcSinh, ArcCosh, ArcSech, ArcCsch, ArcTanh, ArcCoth};Table[Plot3D[Im[f[(x + I y) ^ 3]], {x, -2, 2}, {y, -2, 2}, PlotStyle -> Directive[Pink, Specularity[White, 50], Opacity[0.8]], ExclusionsStyle -> {None, Red}, ClippingStyle -> None, Mesh -> None, PlotLabel -> Im[f[(x + I y) ^ 3]], Ticks -> None], {f, $InverseTrigFunctions}]$TrigFunctions = {Sin, Cos, Sec, Csc, Tan, Cot, ArcSin, ArcCos, ArcSec, ArcCsc, ArcTan, ArcCot, Sinh, Cosh, Sech, Csch, Tanh, Coth, ArcSinh, ArcCosh, ArcSech, ArcCsch, ArcTanh, ArcCoth};Table[Plot3D[Abs[f[x + I y]], {x, -2, 2}, {y, -2, 2}, MeshFunctions -> Function@@@{{{x, y, z}, Re[f[x + I y]]}, {{x, y, z}, Im[f[x + I y]]}}, MeshStyle -> {Orange, Green}, PlotLabel -> f, Ticks -> None], {f, $TrigFunctions}]
 快速编程入门:图形
 NKS|Online
文本
Wolfram Research (1988),Plot3D,Wolfram 语言函数,https://reference.wolfram.com/language/ref/Plot3D.html (更新于 2021 年).
CMS
Wolfram 语言. 1988. "Plot3D." Wolfram 语言与系统参考资料中心. Wolfram Research. 最新版本 2021. https://reference.wolfram.com/language/ref/Plot3D.html.
APA
Wolfram 语言. (1988). Plot3D. Wolfram 语言与系统参考资料中心. 追溯自 https://reference.wolfram.com/language/ref/Plot3D.html 年