



PointValuePlot
PointValuePlot[{pt1val1,pt2val2,…}]
按照值 vali 绘制点 pti 的样式.
PointValuePlot[ptsvals]
使用 pts 中的一组点 pti,以及相应的来自 val 的值 vali.
PointValuePlot[…,enc]
使用视觉编码 enc 代表绘图中的值 vali.
PointValuePlot[data,…]
绘制 data 中的位置和值.
更多信息和选项
- PointValuePlot 亦称为分级符号图 (graduated symbol map) 和专题地图 (thematic map).
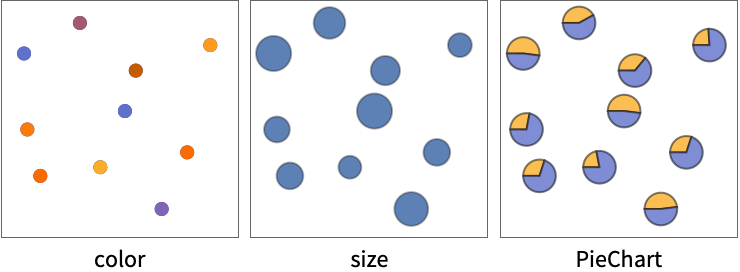
- PointValuePlot 使用不同的视觉编码 enc(如颜色、尺寸和形状)来表示特定位置的值.
- 可用下列方式给出点 pti 中的坐标 {x,y}:
-
xi 实数 Quantity[xi,unit] 带有单位的量 Around[xi,ei] 有不确定性 ei 的值 xi Interval[{xmin,xmax}] 在 xmin 和 xmax 之间的值 - ptsi 可以是具有以下形式的地理位置:
-
GeoPosition[{lat,lon}] 经度和纬度 Entity[…] 地理实体 Dated[…] 日期实体 - 可用以下形式给出多个点 pts:
-
{pt1,pt2,…} 点的列表 QuantityArray[…] 量的数组 GeoPosition[…] 测地位置的数组 - 值 vali 可以是任意格式,包括:
-
n 数值 Quantity[vali,unit] 带有单位的量 "str" 字符串 RGBColor[…],Hue[…],… 颜色 {vali1,vali2,…} 值的列表 - 可用以下形式给出多个值 values:
-
{val1,val2,…} 值的列表 QuantityArray[{val1,val2,…},unit] 量的数组 Dataset[…] 数值数据集 - 可用以下形式给出 PointValuePlot 的数据 data:
-
{e1,e2,…} 带有封装或没有封装的元素的列表 <k1e1,k2e2,…> 键和值组成的关联 SpatialPointData[…] 空间点和注释 WeightedData[…] 含有值的权重的位置 w[{e1,e2,…},…] 应用于整个数据集的封装 w[{data1,data1,…},…] 应用于所有数据集的封装 - 可将下列封装应用于绘图元素:
-
Annotation[e,label] 提供注释 Button[e,action] 定义一个当元素被点击时执行的动作 Callout[e,label] 用 callout 标记数据 EventHandler[e,…] 为元素定义一个通用事件处理器 Hyperlink[e,uri] 让元素作为超链接运行 Labeled[e,…] 显示带有标签的元素 Legended[e,…] 在图表图例中包含元素的特征 PopupWindow[e,cont] 在元素上附加一个弹出窗口 StatusArea[e,label] 当鼠标悬停在元素上时在状态区域中显示 Style[e,opts] 用指定样式显示元素 Tooltip[e,label] 在元素上附加任意提示条 - 不是按照这些格式给出的数据会在形成绘图的时候被忽略.
- 默认情况下,编码 enc 会根据值 vali 的格式自动选择.
- 编码 enc 的可能设置包括:
-
"Size" 根据值改变点的尺寸 "Color" 根据值为点平滑上色 "DiscreteColor" 根据值为点不连续上色 "Shape" 根据值改变点的形状 "Label" 用值对点添加标签 func 将 func 应用于值决定点标记符 nenc 用编码 enc 对点的第 n 个值进行编码 m;;nenc 用编码 enc 对第 m  到第 n
 个值进行编码
Allenc 用编码 enc 对点的所有值进行编码 {enc1,enc2,…} 对不同的值使用不同的编码 - PointValuePlot 与 Graphics 的选项基本相同,有下列添加和改变: [所有选项的列表]
所有选项的列表
范例
打开所有单元 关闭所有单元基本范例 (5)
PointValuePlot[Table[RandomReal[10, 2] -> RandomReal[], 10]]PointValuePlot[Table[RandomReal[10, 2] -> {RandomReal[], RandomChoice[{1, 2, 3}]}, 10]]PointValuePlot[Table[RandomReal[10, 2] -> RandomReal[], 10], "Size"]data = RandomReal[100, {10, 2}];
annotations = {{"on", "off", "on", "on", "off", "off", "on", "on", "off", "off"}, {275.9, 241.2, 256., 442.9, 209.4, 260.4, 348.8, 315.2, 275.3, 317.8}};PointValuePlot[SpatialPointData[data -> annotations], PlotLegends -> Automatic]PointValuePlot[Table[RandomGeoPosition[["US"]] -> RandomReal[3], 20]]范围 (14)
数据 (8)
PointValuePlot[{{1, 1} -> 1, {2, 2} -> 2, {3, 3} -> 3}]PointValuePlot[{{1, 1}, {2, 2}, {3, 3}} -> {1, 2, 3}]PointValuePlot[{{1, 1} -> Quantity[1, "Meters"], {2, 2} -> Quantity[2, "Meters"], {3, 3} -> Quantity[3, "Meters"]}]PointValuePlot[{{1, 1}, {2, 2}, {3, 3}} -> QuantityArray[{1, 2, 3}, "Meters"]]PointValuePlot[<|{1, 1} -> 1, {2, 2} -> 2, {3, 3} -> 3|>]PointValuePlot[<|Entity["City", {"London", "GreaterLondon", "UnitedKingdom"}] -> 1, Entity["City", {"Paris", "IleDeFrance", "France"}] -> 2, Entity["City", {"Berlin", "Berlin", "Germany"}] -> 3|>, "Size"]PointValuePlot[RandomGeoPosition[10] -> Range[10], "Size"]SpatialPointData 对象包括位置和值:
PointValuePlot[SpatialPointData[RandomReal[100, {10, 2}] -> RandomReal[1, 10]]]编码 (6)
PointValuePlot[{{1, 1}, {2, 2}, {3, 3}, {4, 4}, {5, 5}} -> {{"a", 1}, {"b", 2}, {"c", 3}, {"d", 4}, {"e", 5}}]PointValuePlot[{{1, 1}, {2, 2}, {3, 3}, {4, 4}, {5, 5}} -> {{"a", 1, 1}, {"b", 2, 1}, {"c", 3, 1}, {"d", 4, 2}, {"e", 5, 2}}, {2 -> "DiscreteColor", 3 -> "Size"}]PointValuePlot[{{1, 1}, {2, 2}, {3, 3}, {4, 4}, {5, 5}} -> {{"a", 1, 1}, {"b", 2, 1}, {"c", 3, 1}, {"d", 4, 2}, {"e", 5, 2}}, {2 -> "Color", 3 -> "Size"}, PlotLegends -> Automatic]PointValuePlot[{{1, 1}, {2, 2}, {3, 3}, {4, 4}, {5, 5}} -> {{"a", 1, 1}, {"b", 2, 1}, {"c", 3, 1}, {"d", 4, 2}, {"e", 5, 2}}, 2 ;; 3 -> PieChart]PointValuePlot[Table[RandomReal[1, 2] -> RandomReal[{5, 10}, 5], 20], All -> BarChart]PointValuePlot[Table[RandomReal[1, 2] -> RandomImage[1, {25, 25}], 20]]选项 (79)
AspectRatio (3)
PointValuePlot[IconizedObject[«plain»]]PointValuePlot[IconizedObject[«plain»], AspectRatio -> 1 / GoldenRatio]PointValuePlot[IconizedObject[«geo»]]PointValuePlot[IconizedObject[«geo»], GeoProjection -> "LambertAzimuthal"]Axes (3)
默认情况下,PointValuePlot 使用边框,而不是坐标轴:
PointValuePlot[IconizedObject[«plain»]]PointValuePlot[IconizedObject[«plain»], Frame -> False, Axes -> True]{PointValuePlot[IconizedObject[«plain»], Frame -> False, Axes -> {True, False}], PointValuePlot[IconizedObject[«plain»], Frame -> False, Axes -> {False, True}]}AxesLabel (3)
PointValuePlot[IconizedObject[«plain»], Frame -> False, Axes -> True]
PointValuePlot[IconizedObject[«plain»], Frame -> False, Axes -> True, AxesLabel -> y]PointValuePlot[IconizedObject[«plain»], Frame -> False, Axes -> True, AxesLabel -> {x, y}]AxesOrigin (2)
AxesStyle (3)
PointValuePlot[IconizedObject[«plain»], Frame -> False, Axes -> True, AxesStyle -> Red]PointValuePlot[IconizedObject[«plain»], Frame -> False, Axes -> True, AxesStyle -> {{Thick, Red}, {Thick, Blue}}]PointValuePlot[IconizedObject[«plain»], Frame -> False, Axes -> True, AxesStyle -> Green, TicksStyle -> Red]BubbleSizes (3)
PointValuePlot[IconizedObject[«plain»]]{PointValuePlot[IconizedObject[«plain»], BubbleSizes -> Small], PointValuePlot[IconizedObject[«plain»], BubbleSizes -> Large]}PointValuePlot[IconizedObject[«plain»], BubbleSizes -> {0.02, 0.15}]ColorFunction (3)
PointValuePlot[IconizedObject[«scalar»], PlotLegends -> Automatic]PointValuePlot[IconizedObject[«scalar»], PlotLegends -> Automatic, ColorFunction -> "Rainbow"]PointValuePlot[IconizedObject[«scalar»], PlotLegends -> Automatic, ColorFunction -> (Hue[#, 1, 1 - #]&)]ColorFunctionScaling (2)
PointValuePlot[IconizedObject[«scalar»], PlotLegends -> Automatic, ColorFunction -> (If[# < 1, Red, Blue]&)]PointValuePlot[IconizedObject[«scalar»], PlotLegends -> Automatic, ColorFunction -> (If[# < 1, Red, Blue]&), ColorFunctionScaling -> False]Frame (2)
FrameLabel (3)
FrameStyle (2)
GeoBackground (3)
PointValuePlot[IconizedObject[«geo scalar»]]PointValuePlot[IconizedObject[«geo scalar»], GeoBackground -> "Satellite"]PointValuePlot[IconizedObject[«geo scalar»], GeoBackground -> "ReliefMap"]GeoGridLines (3)
PointValuePlot[IconizedObject[«geo scalar»]]PointValuePlot[IconizedObject[«geo scalar»], GeoGridLines -> Automatic]PointValuePlot[IconizedObject[«geo scalar»], GeoGridLines -> Quantity[5, "AngularDegrees"]]GeoGridLinesStyle (2)
GeoProjection (3)
GeoRange (3)
GeoScaleBar (2)
GridLines (3)
PointValuePlot[IconizedObject[«plain»], GridLines -> Automatic]PointValuePlot[IconizedObject[«plain»], GridLines -> {None, Automatic}]PointValuePlot[IconizedObject[«plain»], GridLines -> {None, Range[0, 5.5, 0.5]}]GridLinesStyle (1)
ImageSize (7)
使用已命名尺寸,如 Tiny、Small、Medium 和 Large:
{PointValuePlot[IconizedObject[«plain»], ImageSize -> Tiny], PointValuePlot[IconizedObject[«plain»], ImageSize -> Small]}{PointValuePlot[IconizedObject[«plain»], ImageSize -> 150], PointValuePlot[IconizedObject[«plain»], AspectRatio -> 1.5, ImageSize -> 150]}{PointValuePlot[IconizedObject[«plain»], ImageSize -> {Automatic, 150}], PointValuePlot[IconizedObject[«plain»], AspectRatio -> 2, ImageSize -> {Automatic, 150}]}{PointValuePlot[IconizedObject[«plain»], ImageSize -> UpTo[200]], PointValuePlot[IconizedObject[«plain»], AspectRatio -> 2, ImageSize -> UpTo[200]]}PointValuePlot[IconizedObject[«plain»], ImageSize -> {200, 300}, Background -> StandardGray]设置 AspectRatioFull 将填充可用空间:
PointValuePlot[IconizedObject[«plain»], AspectRatio -> Full, ImageSize -> {200, 300}, Background -> StandardGray]{PointValuePlot[IconizedObject[«plain»], ImageSize -> {UpTo[150], UpTo[100]}], PointValuePlot[IconizedObject[«plain»], AspectRatio -> 2, ImageSize -> {UpTo[150], UpTo[100]}]}Framed[Pane[PointValuePlot[IconizedObject[«plain»], ImageSize -> Full, Background -> StandardGray], {200, 100}]]Framed[Pane[PointValuePlot[IconizedObject[«plain»], AspectRatio -> Full, ImageSize -> {Scaled[0.5], Scaled[0.5]}, Background -> StandardGray], {200, 200}]]LabelingSize (2)
PointValuePlot[{{1, 1}, {2, 2}, {3, 3}, {4, 4}, {5, 5}} -> {{1, 1}, {2, 1}, {3, 1}, {4, 2}, {5, 2}}]使用 LabelingSize 改变尺寸:
PointValuePlot[{{1, 1}, {2, 2}, {3, 3}, {4, 4}, {5, 5}} -> {{1, 1}, {2, 1}, {3, 1}, {4, 2}, {5, 2}}, LabelingSize -> 15]PointValuePlot[Table[RandomReal[1, 2] -> RandomImage[1, {25, 25}], 20], LabelingSize -> 20]LabelStyle (3)
PointValuePlot[IconizedObject[«labels»]]PointValuePlot[IconizedObject[«labels»], LabelStyle -> Red]PointValuePlot[IconizedObject[«labels»], LabelStyle -> {FontFamily -> "Times", FontSize -> 16}]PlotRange (2)
PlotStyle (3)
PlotTheme (3)
PointValuePlot[IconizedObject[«plain»], PlotTheme -> "Marketing"]PointValuePlot[IconizedObject[«plain»], PlotTheme -> {"Marketing", "NoAxes"}]PointValuePlot[IconizedObject[«plain»], PlotTheme -> "Marketing", GridLines -> None]ScalingFunctions (2)

Ticks (4)
PointValuePlot[{{10, 1}, {20, 2}, {30, 3}, {40, 4}, {50, 5}} -> {{"a", 1}, {"a", 2}, {"b", 3}, {"b", 4}, {"b", 5}}, Frame -> False, Axes -> True]PointValuePlot[{{10, 1}, {20, 2}, {30, 3}, {40, 4}, {50, 5}} -> {{"a", 1}, {"a", 2}, {"b", 3}, {"b", 4}, {"b", 5}}, Frame -> False, Axes -> True, Ticks -> None]PointValuePlot[{{10, 1}, {20, 2}, {30, 3}, {40, 4}, {50, 5}} -> {{"a", 1}, {"a", 2}, {"b", 3}, {"b", 4}, {"b", 5}}, Frame -> False, Axes -> True, Ticks -> {{10, 20, 50}, {1, 2, 4}}]PointValuePlot[{{10, 1}, {20, 2}, {30, 3}, {40, 4}, {50, 5}} -> {{"a", 1}, {"a", 2}, {"b", 3}, {"b", 4}, {"b", 5}}, Frame -> False, Axes -> True, Ticks -> {{{10, x1}, {20, x2}, {50, x5}}, {{1, y1}, {2, y2}, {4, y4}}}]TicksStyle (4)
PointValuePlot[{{10, 1}, {20, 2}, {30, 3}, {40, 4}, {50, 5}} -> {{"a", 1}, {"a", 2}, {"b", 3}, {"b", 4}, {"b", 5}}, Frame -> False, Axes -> True, TicksStyle -> Directive[Red, Bold]]PointValuePlot[{{10, 1}, {20, 2}, {30, 3}, {40, 4}, {50, 5}} -> {{"a", 1}, {"a", 2}, {"b", 3}, {"b", 4}, {"b", 5}}, Frame -> False, Axes -> True, TicksStyle -> {Directive[Green, Bold], Directive[Bold, Red]}]PointValuePlot[{{10, 1}, {20, 2}, {30, 3}, {40, 4}, {50, 5}} -> {{"a", 1}, {"a", 2}, {"b", 3}, {"b", 4}, {"b", 5}}, Frame -> False, Axes -> True, Ticks -> {{{10, x1, .08}, {20, x2, .275}, {50, x5, .85}}, {{1, y1, .08}, {2, y2, .275}, {4, y4, .675}}}]PointValuePlot[{{10, 1}, {20, 2}, {30, 3}, {40, 4}, {50, 5}} -> {{"a", 1}, {"a", 2}, {"b", 3}, {"b", 4}, {"b", 5}}, Frame -> False, Axes -> True, Ticks -> {{{10, x1, .08, Directive[Red]}, {20, x2, .275, Directive[Blue]}, {50, x5, .85, Directive[Purple]}}, {{1, y1, .08, Directive[Red, Dashed, Thick]}, {2, y2, .275, Directive[Blue, Dashed, Thick]}, {4, y4, .675, Directive[Darker@Green, Dashed, Thick]}}}]文本
Wolfram Research (2020),PointValuePlot,Wolfram 语言函数,https://reference.wolfram.com/language/ref/PointValuePlot.html.
CMS
Wolfram 语言. 2020. "PointValuePlot." Wolfram 语言与系统参考资料中心. Wolfram Research. https://reference.wolfram.com/language/ref/PointValuePlot.html.
APA
Wolfram 语言. (2020). PointValuePlot. Wolfram 语言与系统参考资料中心. 追溯自 https://reference.wolfram.com/language/ref/PointValuePlot.html 年