DateListStepPlot[{{date1,y1},{date2,y2},…}]
連続する日付をステップとして値 yiをプロットする.
DateListStepPlot[{y1,y2,…},datespec]
datespec で指定された等間隔の日付をステップとして値 yiをプロットする.
DateListStepPlot[tseries]
時系列 tseries をプロットする.
DateListStepPlot[{data1,data2,…}]
すべての dataiからデータをプロットする.
DateListStepPlot[…,step]
step で指定されたステップを使ってプロットする.
DateListStepPlot[{…,w[datai],…}]
記号ラッパー w で特徴が定義された dataiをプロットする.
DateListStepPlot
DateListStepPlot[{{date1,y1},{date2,y2},…}]
連続する日付をステップとして値 yiをプロットする.
DateListStepPlot[{y1,y2,…},datespec]
datespec で指定された等間隔の日付をステップとして値 yiをプロットする.
DateListStepPlot[tseries]
時系列 tseries をプロットする.
DateListStepPlot[{data1,data2,…}]
すべての dataiからデータをプロットする.
DateListStepPlot[…,step]
step で指定されたステップを使ってプロットする.
DateListStepPlot[{…,w[datai],…}]
記号ラッパー w で特徴が定義された dataiをプロットする.
詳細とオプション
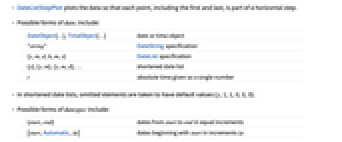
- DateListStepPlotは,最初と最後を含む各点が水平ステップに含まれるようにして,データをプロットする.
- dateiの可能な形
-
DateObject[…],TimeObject[…] 日付または時間のオブジェクト "string" DateString指定 {y,m,d,h,m,s} DateList指定 {y},{y,m},{y,m,d},… 短縮形の日付リスト t 単一の数として与えられる絶対時間 - 短縮形の日付リストでは,省略された要素はデフォルト値の{y,1,1,0,0,0}を持つとみなされる.
- datespec の可能な形
-
{start,end} start から end までの等増分の日付 {start,Automatic,Δt} start から始まる増分が Δt の日付 {Automatic,end,Δt} end で終る増分が Δt の日付 start start の形で増分が決定される日付 - datespec における Δt は,{y,m,d,h,m,s}の日付リスト指定でも,任意の特殊形"Year","Quarter","Month","Week","Day","Hour","Minute","Second","Millisecond"のいずれでもよい.
- 明示的な Δt が与えられていない場合,使用される増分には, start で明示的に指定された最小のものが使われる.
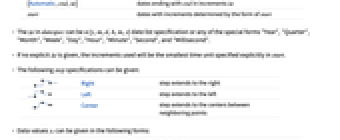
- 次の step 指定を与えることができる.
-

Right 右に伸びるステップ 

Left 左に伸びるステップ 
Center 近傍点の間で中央に伸びるステップ - データ値 yiは次の形式で与えることができる.
-
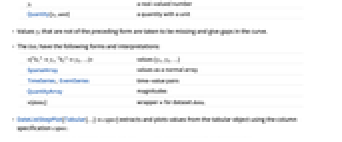
yi 実数値 Quantity[yi,unit] 単位の付いた数量 - 上記の形式ではない値 yiは欠落値とみなされ,曲線の切れ目となる.
- listiには次の形と解釈がある.
-
<|"k1"y1,"k2"y2,…|> 値{y1,y2,…} SparseArray 正規配列としての値 TimeSeries, EventSeries 時間と値のペア QuantityArray 大きさ w[datai] データ集合 dataiについてのラッパー w - DateListStepPlot[Tabular[…]cspec]は,列指定 cspec を使って表形式オブジェクトから値を抽出し,これをプロットする.
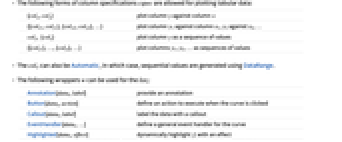
- 次は,表形式データのプロットに使用可能な列指定 cspec の形式である.
-
{colx,coly} 列 y と列 x をプロットする {{colx1,coly1},{colx2,coly2},…} 列 y1と列 x1,列 y2と列 x2をプロットする等 coly, {coly} 列 y を一連の値としてプロットする {{coly1},…,{colyi},…} 列 y1, y2, …を一連の値としてプロットする - colxはAutomaticでもよい.その場合は,DataRangeを使って一連の値が生成される.
- DateListStepPlot[TimeSeries[…]cspec]およびDateListStepPlot[EventSeries[…]cspec]は,成分指定 cspec を用いて時系列または事象系列から値を抽出し,プロットする.
- 系列データをプロットには,成分指定 cspec の次の形式が使用できる.
-
com タイムスタンプと成分 com をプロットする {com1,com2,…} タイムスタンプと各成分 comiをプロットする - listiについては,次のラッパー w を使うことができる.
-
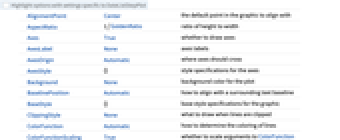
Annotation[datai,label] 注釈を与える Button[datai,action] 曲線がクリックされた際に実行するアクションを定義する Callout[datai,label] コールアウトでデータにラベルを付ける EventHandler[datai,…] 曲線の一般的なイベントハンドラを指定する Highlighted[datai,effect] 効果を使って fiを動的にハイライトする Highlighted[datai,Placed[effect,pos]] 位置 pos で効果を使って fiを静的にハイライトする Hyperlink[datai,uri] 曲線がハイパーリンクとして動作するようにする Labeled[e,…] 曲線にラベルをつけて表示する Legended[datai,…] 凡例中で曲線を識別する PopupWindow[datai,cont] 曲線にポップアップウィンドウを付ける StatusArea[datai,label] 曲線上にマウスが来たときにステータスエリアに表示する Style[datai,opts] 曲線を指定のスタイルで示す Tooltip[datai,label] 曲線に任意のツールチップを付ける - DateListStepPlotには,Graphicsと同じオプションに次の追加・変更を加えたものが使える. [全オプションのリスト]
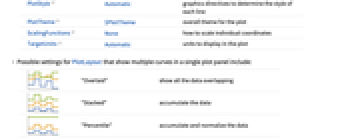
- 次は,単一のプロットパネルで複数の曲線を表示する際のPlotLayoutの可能な設定である.
-

"Overlaid" すべてのデータを重ねて表示する 

"Stacked" データを積み重ねる 

"Percentile" データを重ねて正規化する - デフォルト設定のJoined->Trueでは,ステップは垂直線分を使って繋がれる.Joined->Falseとするとステップだけが描かれる.
- PlotStylesty は,各曲線に対して使用するスタイルを指定する.可能な設定には以下がある.
-
{sty1,sty2,…} データ集合のためのスタイルの列 <|"key"val,…|> データの異なるレベルに対するスタイル要素 - 受け入れられるキーは次の通りである.
-
"Base" すべての dataiに対する全体的なスタイル "Lists" 各 dataiに対するスタイル styiのリスト - ColorData["DefaultPlotColors"]は,PlotStyleで使われるデフォルトの色のシーケンスを与える.
- Mesh->Fullを使ってステップに加えて点を描く.
- ScalingFunctions->"scale"は
座標をスケールする.ScalingFunctions{"scalex","scaley"}は
座標と
座標の両方をスケールする. - Prolog,Epilog,Ticks等の中の明示的な
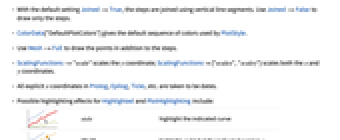
座標はすべて日付であると解釈される. - 次は,HighlightedとPlotHighlightingに使用可能なハイライト効果である.
-

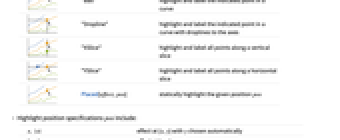
style 指定された曲線をハイライトする 

"Ball" 曲線上の指定された点をハイライトしてラベルを付ける 

"Dropline" 曲線上の指定された点を軸までのドロップラインでハイライトしてラベルを付ける 

"XSlice" 垂直スライスに沿ったすべての点をハイライトしてラベルを付ける 

"YSlice" 水平スライスに沿ったすべての点をハイライトしてラベルを付ける 

Placed[effect,pos] 指定の位置 pos を静的にハイライトする - ハイライトの位置指定 pos には次がある.
-
x, {x} {x,y}における効果.y は自動的に選択される {x,y} {x,y}における効果 {pos1,pos2,…} 複数の位置 posi
全オプションのリスト
例題
すべて開く すべて閉じる例 (5)
data = {{DateObject[{2006, 10, 1}, "Day", "Gregorian", -6.], 10}, {DateObject[{2006, 10, 15}, "Day", "Gregorian", -6.], 12}, {DateObject[{2006, 10, 30}, "Day", "Gregorian", -6.], 15}, {DateObject[{2006, 11, 20}, "Day", "Gregorian", -6.], 20}};DateListStepPlot[data]DateListStepPlot[data, Center, Mesh -> Full]DateListStepPlot[{1, 2, 3, 4, 5, 6, 7}, {2000, 8}]DateListStepPlot[TimeSeries[TimeEventSeries`TimestampData[Association["UniformlySpacedQ" -> True, "Count" -> 10,
"Endpoints" -> TabularColumn[Association[
"Data" -> {2, {{NumericArray[{15706, -2147483648}, "Integer32"], {},
DataStructure["BitVe ... 7, 34, 40, 49, 54, 64, 72}, {}, None},
"ElementType" -> "Integer64"]], TabularColumn[Association[
"Data" -> {{1, 9, 11, 16, 18, 25, 34, 43, 49, 54}, {}, None},
"ElementType" -> "Integer64"]]}}]]]], Association[]] -> "a", PlotLabels -> Automatic]data1 = TimeSeries[{1, 1, 2, 3, 5, 8, 11}, {"Jan 1, 2015"}];
data2 = TimeSeries[{5, 8, 9, 6, 2, 4, 7}, {"Jan 1, 2015"}];DateListStepPlot[{data1, data2}, PlotLegends -> {"first", "second"}]DateListStepPlot[{data1, data2}, PlotLabels -> {"first", "second"}]DateListStepPlot[TemporalData[TimeSeries, {{{1, 1, 2, 3, 5, 8, 11}},
{TemporalData`DateSpecification[{2015, 1, 1, 0, 0, 0.}, {2015, 1, 7, 0, 0, 0}, {1, "Day"}]}, 1,
{"Continuous", 1}, {"Discrete", 1}, 1,
{ResamplingMethod -> {"Interpolation", InterpolationOrder -> 1}}}, True, 314.1], Joined -> False]スコープ (49)
データ (13)
data = {{DateObject[{2006, 10, 1}, "Day", "Gregorian", -6.], 10}, {DateObject[{2006, 10, 15}, "Day", "Gregorian", -6.], 12}, {DateObject[{2006, 10, 30}, "Day", "Gregorian", -6.], 15}, {DateObject[{2006, 11, 20}, "Day", "Gregorian", -6.], 20}};DateListStepPlot[data]DateListStepPlot[TemporalData[TimeSeries, {{{6.464000015258789, 6.367999992370605, 6.333333298012063,
6.5071428162711005, 6.407142843518939, 6.37333329518636, 6.466666645473904, 6.421052681772332,
6.427272666584361, 6.484615362607515, 6.285714285714286, 6 ... Data`DateSpecification[{2010, 1, 17, 20, 45, 32.},
{2013, 12, 17, 20, 45, 32}, {1, "Month"}]}, 1, {"Continuous", 1}, {"Discrete", 1}, 1,
{ValueDimensions -> 1, ResamplingMethod -> {"Interpolation", InterpolationOrder -> 1}}}, True,
10.3]]DateListStepPlot[TemporalData[EventSeries, {{{6.464000015258789, 6.367999992370605, 6.333333298012063,
6.5071428162711005, 6.407142843518939, 6.37333329518636, 6.466666645473904, 6.421052681772332,
6.427272666584361, 6.484615362607515, 6.285714285714286, ... 6.5,
6.199999809265137}}, {TemporalData`DateSpecification[{2010, 1, 17, 20, 45, 32.},
{2013, 12, 17, 20, 45, 32}, {1, "Month"}]}, 1, {"Continuous", 1}, {"Discrete", 1}, 1,
{ResamplingMethod -> None, ValueDimensions -> 1}}, True, 10.3]]冒頭の開始日または開始時を使って一連のデータをプロットする:
DateListStepPlot[{2, 3, 5, 7, 11, 13, 17}, DateObject[{2015, 8, 15}, "Day", "Gregorian", -6.]]DateListStepPlot[Sqrt[Range[10]], {DateObject[{2006, 5, 5}, "Day", "Gregorian", -6.], DateObject[{2006, 5, 30}, "Day", "Gregorian", -6.]}]DateListStepPlot[Range[5], {DateObject[{2006, 1, 15}, "Day", "Gregorian", -6.], Automatic, "Month"}]DateString指定として与えられた日付:
DateListStepPlot[{{"June 2006", 10}, {"August 2006", 12}, {"November 2006", 15}, {"January 2007", 20}}]AbsoluteTime指定を使う:
DateListStepPlot[{{3368649600, 10}, {3369859200, 12}, {3371155200, 15}, {3372969600, 20}}]data1 = TemporalData[TimeSeries, {{{1, 1, 2, 3, 5, 8, 11}},
{TemporalData`DateSpecification[{2015, 1, 1, 0, 0, 0.}, {2015, 1, 7, 0, 0, 0}, {1, "Day"}]}, 1,
{"Continuous", 1}, {"Discrete", 1}, 1,
{ResamplingMethod -> {"Interpolation", InterpolationOrder -> 1}}}, True, 10.2];
data2 = TemporalData[TimeSeries, {{{5, 8, 9, 6, 2, 4, 7}},
{TemporalData`DateSpecification[{2015, 1, 1, 0, 0, 0.}, {2015, 1, 7, 0, 0, 0}, {1, "Day"}]}, 1,
{"Continuous", 1}, {"Discrete", 1}, 1,
{ResamplingMethod -> {"Interpolation", InterpolationOrder -> 1}}}, True, 10.2];DateListStepPlot[{data1, data2}]DateListStepPlot[TemporalData[TimeSeries, {{{6.464000015258789, 6.367999992370605, 6.333333298012063,
6.5071428162711005, 6.407142843518939, 6.37333329518636, 6.466666645473904, 6.421052681772332,
6.427272666584361, 6.484615362607515, 6.285714285714286, 6 ... Data`DateSpecification[{2010, 1, 17, 20, 45, 32.},
{2013, 12, 17, 20, 45, 32}, {1, "Month"}]}, 1, {"Continuous", 1}, {"Discrete", 1}, 1,
{ValueDimensions -> 1, ResamplingMethod -> {"Interpolation", InterpolationOrder -> 1}}}, True,
10.3]]TimeSeriesまたはEventSeriesのすべてのデータをプロットする:
DateListStepPlot[TimeSeries[TimeEventSeries`TimestampData[Association["UniformlySpacedQ" -> False,
"Timestamps" -> TabularColumn[Association[
"Data" -> {7, {{NumericArray[{-248, 118, 298, 638, 865, 1006, 1216}, "Integer32"], {},
None}}, None}, ... "Data" -> {{32, 62, 112, 167, 179, 209, 214}, {}, None}, "ElementType" -> "Integer64"]],
TabularColumn[Association["Data" -> {{30, 49, 81, 125, 142, 174, 177}, {}, None},
"ElementType" -> "Integer64"]]}}]]]], Association[]]]TimeSeriesまたはEventSeriesの特定の成分をプロットする:
trees = TimeSeries[TimeEventSeries`TimestampData[Association["UniformlySpacedQ" -> False,
"Timestamps" -> TabularColumn[Association[
"Data" -> {7, {{NumericArray[{-248, 118, 298, 638, 865, 1006, 1216}, "Integer32"], {},
None}}, None}, ... "Data" -> {{32, 62, 112, 167, 179, 209, 214}, {}, None}, "ElementType" -> "Integer64"]],
TabularColumn[Association["Data" -> {{30, 49, 81, 125, 142, 174, 177}, {}, None},
"ElementType" -> "Integer64"]]}}]]]], Association[]];DateListStepPlot[trees -> "tree 1"]DateListStepPlot[trees -> {"tree 1", "tree 2"}]PlotRangeを使って関心領域に焦点を当てる:
DateListStepPlot[TemporalData[TimeSeries, {{{6.464000015258789, 6.367999992370605, 6.333333298012063,
6.5071428162711005, 6.407142843518939, 6.37333329518636, 6.466666645473904, 6.421052681772332,
6.427272666584361, 6.484615362607515, 6.285714285714286, 6 ... Data`DateSpecification[{2010, 1, 17, 20, 45, 32.},
{2013, 12, 17, 20, 45, 32}, {1, "Month"}]}, 1, {"Continuous", 1}, {"Discrete", 1}, 1,
{ValueDimensions -> 1, ResamplingMethod -> {"Interpolation", InterpolationOrder -> 1}}}, True,
10.3], PlotRange -> {{"Jan 1, 2011", "Dec 31, 2011"}, {6.2, 6.6}}]ScalingFunctionsを使って軸をスケールする:
DateListStepPlot[{229, 627, 53, 1432, 931, 184}, Today, ScalingFunctions -> "Log"]表形式データ (1)
tab = Tabular[IconizedObject[«Country populations»]]フランスの1940年から2020年までの人口をプロットする:
DateListStepPlot[tab -> {"Date", "France"}]DateListStepPlot[tab -> {{"Date", "France"}, {"Date", "Germany"}, {"Date", "Australia"}}]DateListStepPlot[tab -> {{"Date", "France"}, {"Date", "Germany"}, {"Date", "Australia"}}, PlotLegends -> {"France", "Germany", "Australia"}]特殊データ (6)
Quantityを使ってデータに単位を加える:
DateListStepPlot[Quantity[Sqrt[Range[10]], "Meters"], {2010, 1, 1}, FrameLabel -> Automatic]QuantityArray内のデータをプロットする:
qa = QuantityArray[RandomReal[{0, 40}, 20], "Fahrenheit"]DateListStepPlot[qa, {2000, 1, 1}, FrameLabel -> Automatic]TargetUnitsで使用する単位を指定する:
DateListStepPlot[qa, {2000, 1, 1}, TargetUnits -> "Kelvin", FrameLabel -> Automatic]Association中の数値は
座標として使われる:
DateListStepPlot[<|"a" -> 2, "b" -> 3, "c" -> 5, "d" -> 7, "e" -> 11, "f" -> 13|>, "Jan, 1, 2010"]Association中の数値によるキーと値は
座標と
座標として使われる:
DateListStepPlot[<|2 -> 1, 3 -> 2, 5 -> 3, 7 -> 4, 11 -> 5, 13 -> 6|>]TimeSeriesを直接プロットする:
data = CountryData["UnitedStates", {{"Population"}, {1988, 2013}}]DateListStepPlot[data, FrameLabel -> Automatic]WeightedData中の重みは無視される:
DateListPlot[WeightedData[{2, 3, 5, 7, 11, 13, 17, 19, 23, 29}, {1, 2, 3, 4, 5, 6, 7, 8, 9, 10}], {2010, 1, 1}]DateListStepPlot[SparseArray[i_ /; PrimeQ[i] :> i, 20], DateObject[{2015, 7, 31}, "Day", "Gregorian", -6.]]ラッパー (8)
個々のデータ,データ集合あるいはデータ集合の集合にラッパーを使う:
{DateListStepPlot[{Style[{1, 2, 3}, Green], {4, 5, 6}}, {2014, 8}], DateListStepPlot[Style[{{1, 2, 3}, {4, 5, 6}}, Blue], {2014, 8}]}DateListStepPlot[Style[{Style[{1, 2, 3}, Green], {4, 5, 6}}, Blue], {2014, 8}]DateListStepPlot[Tooltip[Prime[Range[10]]], {2014, 8}, Center, Mesh -> Full]DateListStepPlot[Tooltip[Prime[Range[10]], "primes"], {2014, 8}, Center, Mesh -> Full]PopupWindowを使って追加的なドリルダウン情報を与える:
DateListStepPlot[{1, PopupWindow[2, DateListPlot[FinancialData["IBM", "Jan. 1, 2004"]]], 3}, {2004, 1}, Center, Mesh -> Full, PlotStyle -> PointSize[0.05]]Buttonを使って任意のアクションを起こすことができる:
DateListStepPlot[{1, Button[2, Speak[2]], 3}, {2014, 8}, Center, Mesh -> Full, PlotStyle -> PointSize[0.05]]マウスがプロット内に入ったときに,Annotationを動的アクションに使う:
data = TemporalData[TimeSeries, {{{7, 12, 15, 20}}, {{{3368649600, 3369859200, 3371155200, 3372969600}}},
1, {"Continuous", 1}, {"Discrete", 1}, 1, {ValueDimensions -> 1, DateFunction -> Automatic,
ResamplingMethod -> {"Interpolation", InterpolationOrder -> 1}}}, True, 10.2];{DateListStepPlot[Annotation[data, "label", "Mouse"]], Dynamic[MouseAnnotation[]]}Hyperlinkを使って指定されたリンクにジャンプする:
data = TemporalData[TimeSeries, {{{7, 12, 15, 20}}, {{{3368649600, 3369859200, 3371155200, 3372969600}}},
1, {"Continuous", 1}, {"Discrete", 1}, 1, {ValueDimensions -> 1, DateFunction -> Automatic,
ResamplingMethod -> {"Interpolation", InterpolationOrder -> 1}}}, True, 10.2];DateListStepPlot[Hyperlink[data, "http://www.wolfram.com"]]StatusAreaを使って現行ノートブックのステータスエリアに文字列を表示する:
data = TemporalData[TimeSeries, {{{7, 12, 15, 20}}, {{{3368649600, 3369859200, 3371155200, 3372969600}}},
1, {"Continuous", 1}, {"Discrete", 1}, 1, {ValueDimensions -> 1, DateFunction -> Automatic,
ResamplingMethod -> {"Interpolation", InterpolationOrder -> 1}}}, True, 10.2];DateListStepPlot[StatusArea[data, "String"]]ラベルと凡例 (15)
Labeledでデータにラベルを付ける:
data1 = Accumulate@RandomInteger[10, 10];data2 = Accumulate@RandomInteger[3, 10];DateListStepPlot[{Labeled[data1, "label1"], Labeled[data2, "label2"]}, {2010, 1, 1}]PlotLabelsでデータにラベルを付ける:
data1 = Accumulate@RandomInteger[10, 10];data2 = Accumulate@RandomInteger[3, 10];DateListStepPlot[{data1, data2}, {2000}, PlotLabels -> {"label1", "label2"}]DateListStepPlot[Labeled[Accumulate@RandomInteger[10, 10], "label", {2004}], {2000}]DateListStepPlot[Labeled[Accumulate@RandomInteger[10, 10], "label", Scaled[0.3]], {2000}]DateListStepPlot[Labeled[Accumulate@RandomInteger[10, 10], "label", {Scaled[0.3], Below}], {2000}]DateListStepPlot[Table[Labeled[RandomReal[], i], {i, 15}], {2010, 1, 1}, PlotMarkers -> Automatic]Table[DateListStepPlot[Table[Labeled[RandomReal[], i, p], {i, 6}], {2010, 1, 1}, PlotMarkers -> Automatic, PlotLabel -> p], {p, {Above, Below, Before, After}}]data = Rule[TimeSeries[{1, 1, 2, 3, 5, 8, 11}, {"Jan 1, 2015"}], RandomWord[7]];DateListStepPlot[data, LabelingSize -> 30]DateListStepPlot[data, LabelingSize -> Full]密な点集合については,デフォルトでツールチップになるラベルもある:
data = Rule[TimeSeries[RandomReal[1, 100], {"Jan 1, 2015"}], RandomWord[100]];DateListStepPlot[data, PlotMarkers -> Automatic]プロットサイズを大きくするとより多くのラベルが表示されるようになる:
DateListStepPlot[data, ImageSize -> 400, PlotMarkers -> Automatic]Calloutでデータに自動的にラベルを付ける:
DateListStepPlot[{Callout[{2, 6, 10, 15, 15, 20, 24, 27, 27, 28}, "label1"], Callout[{1, 2, 3, 3, 4, 4, 4, 4, 5, 5}, "label2"]}, {2015, 1}]DateListStepPlot[Callout[Table[n ^ Sin[n], {n, 1, 10, 0.25}], "label", Above], {2014, 1}]data1 = Accumulate@RandomInteger[10, 20];data2 = Accumulate@RandomInteger[3, 20];DateListStepPlot[{data1, data2}, {2000}, PlotLegends -> {"company1", "company2"}]Legendedを使って特定のデータ集合に凡例を与える:
data1 = Accumulate@RandomInteger[10, 20];data2 = Accumulate@RandomInteger[3, 20];DateListStepPlot[{data1, data2, Legended[data1 - data2, "difference"]}, {200}]Placedを使って凡例の位置を変える:
DateListStepPlot[{data1, data2, Legended[data1 - data2, Placed["difference", Bottom]]}, {200}]data1 = Accumulate@RandomInteger[10, 20];data2 = Accumulate@RandomInteger[3, 20];DateListStepPlot[<|"company A" -> data1, "company B" -> data2|>, {2000}, PlotLabels -> Automatic, PlotLegends -> None]プロットには,通常,マウスオーバーの際に座標を示すインタラクティブなコールアウトが付いている:
DateListStepPlot[Range[15], {2007}]特定のラッパーあるいはツールチップのようなインタラクションを含めてインタラクティブ機能をオフにする:
DateListStepPlot[Callout[Range[15], "hello", "01/01/2012"], {2007}]Highlightedを使ってプロット中の特定の点を強調する:
DateListStepPlot[Highlighted[Range[15], Placed["Ball", DateObject[{2014, 1, 1}]]], {2007}]Highlighted[…,None]を使って単一集合についてのハイライトをオフにする:
DateListStepPlot[{Range[10], Highlighted[2 * Range[10], None]}, {2007}]プレゼンテーション (6)
data1 = TemporalData[TimeSeries, {{{1, 1, 2, 3, 5, 8, 11}},
{TemporalData`DateSpecification[{2015, 1, 1, 0, 0, 0.}, {2015, 1, 7, 0, 0, 0}, {1, "Day"}]}, 1,
{"Continuous", 1}, {"Discrete", 1}, 1,
{ResamplingMethod -> {"Interpolation", InterpolationOrder -> 1}}}, True, 10.2];
data2 = TemporalData[TimeSeries, {{{5, 8, 9, 6, 2, 4, 7}},
{TemporalData`DateSpecification[{2015, 1, 1, 0, 0, 0.}, {2015, 1, 7, 0, 0, 0}, {1, "Day"}]}, 1,
{"Continuous", 1}, {"Discrete", 1}, 1,
{ResamplingMethod -> {"Interpolation", InterpolationOrder -> 1}}}, True, 10.2];DateListStepPlot[{data1, data2}]DateListStepPlot[{data1, data2}, PlotStyle -> {Dashed, Red}]DateListStepPlot[{data1, data2}, PlotLegends -> {a, b}]Legendedを使って特定のデータ集合についての凡例を与える:
DateListStepPlot[{Legended[data1, "data 1"], Legended[data2, "data 2"]}]曲線にインタラクティブなTooltipを付ける:
data = TemporalData[TimeSeries, {{{7, 12, 15, 20}}, {{{3368649600, 3369859200, 3371155200, 3372969600}}},
1, {"Continuous", 1}, {"Discrete", 1}, 1, {ValueDimensions -> 1, DateFunction -> Automatic,
ResamplingMethod -> {"Interpolation", InterpolationOrder -> 1}}}, True, 314.1];DateListStepPlot[Tooltip[data, "Label"], Mesh -> Full]DateListStepPlot[Tooltip[{{DateObject[{2006, 10, 1}, TimeObject[{0, 0, 0.}, TimeZone -> -5.], TimeZone -> -5.], 7}, {DateObject[{2006, 10, 15}, TimeObject[{0, 0, 0.}, TimeZone -> -5.], TimeZone -> -5.], 12}, {DateObject[{2006, 10, 30}, TimeObject[{0, 0, 0.}, TimeZone -> -5.], TimeZone -> -5.], 15}, {DateObject[{2006, 11, 20}, TimeObject[{0, 0, 0.}, TimeZone -> -5.], TimeZone -> -5.], 20}}], Mesh -> Full]data1 = TemporalData[TimeSeries, {{{1, 1, 2, 3, 5, 8, 11}},
{TemporalData`DateSpecification[{2015, 1, 1, 0, 0, 0.}, {2015, 1, 7, 0, 0, 0}, {1, "Day"}]}, 1,
{"Continuous", 1}, {"Discrete", 1}, 1,
{ResamplingMethod -> {"Interpolation", InterpolationOrder -> 1}}}, True, 314.1];
data2 = TemporalData[TimeSeries, {{{5, 8, 9, 6, 2, 4, 7}},
{TemporalData`DateSpecification[{2015, 1, 1, 0, 0, 0.}, {2015, 1, 7, 0, 0, 0}, {1, "Day"}]}, 1,
{"Continuous", 1}, {"Discrete", 1}, 1,
{ResamplingMethod -> {"Interpolation", InterpolationOrder -> 1}}}, True, 314.1];DateListStepPlot[{data1, data2}, Filling -> Axis]DateListStepPlot[{TemporalData[...], TemporalData[...]}, Center, Mesh -> Full, PlotMarkers -> Automatic]DateListStepPlot[{TemporalData[...], TemporalData[...]}, PlotTheme -> "Web"]DateListStepPlot[{TemporalData[...], TemporalData[...]}, PlotTheme -> "Marketing"]data1 = {{DateObject[{2016, 10, 1}, "Day", "Gregorian", -5.], 10}, {DateObject[{2016, 10, 15}, "Day", "Gregorian", -5.], 17}, {DateObject[{2016, 10, 30}, "Day", "Gregorian", -5.], 15}, {DateObject[{2016, 11, 20}, "Day", "Gregorian", -5.], 20}};data2 = {{DateObject[{2016, 10, 1}, "Day", "Gregorian", -5.], 15}, {DateObject[{2016, 10, 15}, "Day", "Gregorian", -5.], 7}, {DateObject[{2016, 10, 30}, "Day", "Gregorian", -5.], 12}, {DateObject[{2016, 11, 20}, "Day", "Gregorian", -5.], 10}};DateListStepPlot[{data1, data2}, PlotLayout -> "Stacked"]オプション (119)
AspectRatio (4)
DateListStepPlot[TemporalData[TimeSeries, {{{5, 8, 9, 6, 2, 4, 7}},
{TemporalData`DateSpecification[{2015, 1, 1, 0, 0, 0.}, {2015, 1, 7, 0, 0, 0}, {1, "Day"}]}, 1,
{"Continuous", 1}, {"Discrete", 1}, 1,
{ResamplingMethod -> {"Interpolation", InterpolationOrder -> 1}}}, True, 314.1]]DateListStepPlot[TemporalData[TimeSeries, {{{5, 8, 9, 6, 2, 4, 7}},
{TemporalData`DateSpecification[{2015, 1, 1, 0, 0, 0.}, {2015, 1, 7, 0, 0, 0}, {1, "Day"}]}, 1,
{"Continuous", 1}, {"Discrete", 1}, 1,
{ResamplingMethod -> {"Interpolation", InterpolationOrder -> 1}}}, True, 314.1], AspectRatio -> 1 / 2]AspectRatio1として高さと幅を等しくする:
DateListStepPlot[TemporalData[TimeSeries, {{{5, 8, 9, 6, 2, 4, 7}},
{TemporalData`DateSpecification[{2015, 1, 1, 0, 0, 0.}, {2015, 1, 7, 0, 0, 0}, {1, "Day"}]}, 1,
{"Continuous", 1}, {"Discrete", 1}, 1,
{ResamplingMethod -> {"Interpolation", InterpolationOrder -> 1}}}, True, 314.1], AspectRatio -> 1]AspectRatioFullは,他の構造物の中にぴったり収まるように縦横比を調整する:
plot = DateListStepPlot[TemporalData[TimeSeries, {{{5, 8, 9, 6, 2, 4, 7}},
{TemporalData`DateSpecification[{2015, 1, 1, 0, 0, 0.}, {2015, 1, 7, 0, 0, 0}, {1, "Day"}]}, 1,
{"Continuous", 1}, {"Discrete", 1}, 1,
{ResamplingMethod -> {"Interpolation", InterpolationOrder -> 1}}}, True, 314.1], AspectRatio -> Full];{Framed[Pane[plot, {50, 100}]], Framed[Pane[plot, {100, 100}]], Framed[Pane[plot, {100, 50}]]}Axes (1)
デフォルトで,DateListStepPlotは軸ではなく枠を使う:
data = TemporalData[TimeSeries, {{{1, 1, 2, 3, 5, 8, 11}},
{TemporalData`DateSpecification[{2015, 1, 1, 0, 0, 0.}, {2015, 1, 7, 0, 0, 0}, {1, "Day"}]}, 1,
{"Continuous", 1}, {"Discrete", 1}, 1,
{ResamplingMethod -> {"Interpolation", InterpolationOrder -> 1}}}, True, 10.2];DateListStepPlot[data]DateListStepPlot[data, Frame -> False, Axes -> True]DateListStepPlot[data, Frame -> False, Axes -> {True, False}]DateListStepPlot[data, Frame -> False, Axes -> {False, True}]AxesLabel (4)
DateListStepPlot[TimeSeries[QuantityArray[Range[10], "Meters"], {"Jan 10,2021"}], Frame -> False, Axes -> True]DateListStepPlot[TimeSeries[QuantityArray[Range[10], "Meters"], {"Jan 10,2021"}], Frame -> False, Axes -> True, AxesLabel -> label]DateListStepPlot[TimeSeries[QuantityArray[Range[10], "Meters"], {"Jan 10,2021"}], Frame -> False, Axes -> True, AxesLabel -> {"Date", "Number"}]DateListStepPlot[TimeSeries[QuantityArray[Range[10], "Meters"], {"Jan 10,2021"}], Axes -> True, Frame -> False, AxesLabel -> Automatic]AxesOrigin (1)
DateListStepPlot[TemporalData[TimeSeries, {{{1, 1, 2, 3, 5, 8, 11}},
{TemporalData`DateSpecification[{2015, 8, 3, 0, 0, 0.}, {2015, 8, 9, 0, 0, 0}, {1, "Day"}]}, 1,
{"Continuous", 1}, {"Discrete", 1}, 1,
{ResamplingMethod -> {"Interpolation", InterpolationOrder -> 1}}}, True, 10.2], Frame -> False]DateListStepPlot[TemporalData[TimeSeries, {{{1, 1, 2, 3, 5, 8, 11}},
{TemporalData`DateSpecification[{2015, 8, 3, 0, 0, 0.}, {2015, 8, 9, 0, 0, 0}, {1, "Day"}]}, 1,
{"Continuous", 1}, {"Discrete", 1}, 1,
{ResamplingMethod -> {"Interpolation", InterpolationOrder -> 1}}}, True, 10.2], Frame -> False, AxesOrigin -> {"August 1, 2015", 0}]AxesStyle (1)
data = TemporalData[TimeSeries, {{{1, 1, 2, 3, 5, 8, 11}},
{TemporalData`DateSpecification[{2015, 1, 1, 0, 0, 0.}, {2015, 1, 7, 0, 0, 0}, {1, "Day"}]}, 1,
{"Continuous", 1}, {"Discrete", 1}, 1,
{ResamplingMethod -> {"Interpolation", InterpolationOrder -> 1}}}, True, 10.2];DateListStepPlot[data, Frame -> False, Axes -> True, AxesStyle -> Red]DateListStepPlot[data, Frame -> False, Axes -> True, AxesStyle -> {{Thick, Red}, {Thick, Blue}}]DateListStepPlot[data, Frame -> False, Axes -> True, AxesStyle -> Green, TicksStyle -> Red]DateListStepPlot[data, Frame -> False, Axes -> True, AxesStyle -> Green, LabelStyle -> Red]ClippingStyle (1)
data = TemporalData[TimeSeries, {{{161.60000038146973, 159.19999980926514, 170.99999904632568,
91.09999942779541, 89.69999980926514, 95.59999942779541, 116.39999961853027,
122.00000095367432, 70.69999933242798, 84.2999997138977, 44., 85.09999990 ... Data`DateSpecification[{2010, 1, 17, 20, 45, 32.}, {2013, 12, 17, 20, 45, 32},
{1, "Month"}]}, 1, {"Continuous", 1}, {"Discrete", 1}, 1,
{ValueDimensions -> 1, ResamplingMethod -> {"Interpolation", InterpolationOrder -> 1}}}, True,
10.3];DateListStepPlot[data, ClippingStyle -> None]DateListStepPlot[data, ClippingStyle -> Red]PlotRange->Allとして切取りが行われないようにする:
DateListStepPlot[data, PlotRange -> All]ColorFunction (4)
data = TemporalData[TimeSeries, {{{5, 8, 9, 6, 2, 4, 7}},
{TemporalData`DateSpecification[{2015, 1, 1, 0, 0, 0.}, {2015, 1, 7, 0, 0, 0}, {1, "Day"}]}, 1,
{"Continuous", 1}, {"Discrete", 1}, 1,
{ResamplingMethod -> {"Interpolation", InterpolationOrder -> 1}}}, True, 314.1];DateListStepPlot[data, ColorFunction -> "Rainbow"]data = TemporalData[TimeSeries, {{{5, 8, 9, 6, 2, 4, 7}},
{TemporalData`DateSpecification[{2015, 1, 1, 0, 0, 0.}, {2015, 1, 7, 0, 0, 0}, {1, "Day"}]}, 1,
{"Continuous", 1}, {"Discrete", 1}, 1,
{ResamplingMethod -> {"Interpolation", InterpolationOrder -> 1}}}, True, 314.1];DateListStepPlot[data, ColorFunction -> Function[{x, y}, Hue[x]]]DateListStepPlot[data, ColorFunction -> Function[{x, y}, Hue[y]]]data = TemporalData[TimeSeries, {{{5, 8, 9, 6, 2, 4, 7}},
{TemporalData`DateSpecification[{2015, 1, 1, 0, 0, 0.}, {2015, 1, 7, 0, 0, 0}, {1, "Day"}]}, 1,
{"Continuous", 1}, {"Discrete", 1}, 1,
{ResamplingMethod -> {"Interpolation", InterpolationOrder -> 1}}}, True, 314.1];DateListStepPlot[data, ColorFunction -> Function[{x, y}, Hue[x]], Filling -> Axis]曲線の色付けについては,ColorFunctionはPlotStyleより優先順位が高い:
data = TemporalData[TimeSeries, {{{5, 8, 9, 6, 2, 4, 7}},
{TemporalData`DateSpecification[{2015, 1, 1, 0, 0, 0.}, {2015, 1, 7, 0, 0, 0}, {1, "Day"}]}, 1,
{"Continuous", 1}, {"Discrete", 1}, 1,
{ResamplingMethod -> {"Interpolation", InterpolationOrder -> 1}}}, True, 314.1];DateListStepPlot[data, ColorFunction -> "DarkRainbow", PlotStyle -> Directive[Red, Dashed]]ColorFunctionScaling (2)
data = TemporalData[TimeSeries, {{{5, 8, 9, 6, 2, 4, 7}},
{TemporalData`DateSpecification[{2015, 1, 1, 0, 0, 0.}, {2015, 1, 7, 0, 0, 0}, {1, "Day"}]}, 1,
{"Continuous", 1}, {"Discrete", 1}, 1,
{ResamplingMethod -> {"Interpolation", InterpolationOrder -> 1}}}, True, 314.1];DateListStepPlot[data, ColorFunction -> Function[{x, y}, Hue[y]], PlotStyle -> Thick, ColorFunctionScaling -> True]data = TemporalData[TimeSeries, {{{5, 8, 9, 6, 2, 4, 7}},
{TemporalData`DateSpecification[{2015, 1, 1, 0, 0, 0.}, {2015, 1, 7, 0, 0, 0}, {1, "Day"}]}, 1,
{"Continuous", 1}, {"Discrete", 1}, 1,
{ResamplingMethod -> {"Interpolation", InterpolationOrder -> 1}}}, True, 314.1];DateListStepPlot[data, ColorFunction -> Function[{x, y}, Hue[y / 25]], PlotStyle -> Thick, ColorFunctionScaling -> False]DateFunction (1)
デフォルトで,数値による時はAbsoluteTimeに相当する:
data = {{100000000, 2}, {200000000, 3}, {300000000, 5}, {400000000, 7}, {500000000, 11}, {600000000, 13}, {700000000, 17}, {800000000, 19}, {900000000, 23}, {1000000000, 29}, {1100000000, 31}, {1200000000, 37}};DateListStepPlot[data]UnixTimeとして解釈する:
DateListStepPlot[data, DateFunction -> FromUnixTime]DateTicksFormat (1)
data = TemporalData[TimeSeries, {{{10, 12, 15}}, {{{3.3607008*^9, 3.3645888*^9, 3.3663168*^9}}}, 1,
{"Continuous", 1}, {"Discrete", 1}, 1, {ValueDimensions -> 1, DateFunction -> Automatic,
ResamplingMethod -> {"Interpolation", InterpolationOrder -> 1}}}, True, 314.1];Table[DateListStepPlot[data, DateTicksFormat -> f], {f, {"MonthShort", "Month", "MonthNameShort", "MonthName"}}]Filling (2)
data = TemporalData[TimeSeries, {{{5, 8, 9, 6, 2, 4, 7}},
{TemporalData`DateSpecification[{2015, 1, 1, 0, 0, 0.}, {2015, 1, 7, 0, 0, 0}, {1, "Day"}]}, 1,
{"Continuous", 1}, {"Discrete", 1}, 1,
{ResamplingMethod -> {"Interpolation", InterpolationOrder -> 1}}}, True, 314.1];Table[DateListStepPlot[data, Filling -> c], {c, {Top, Bottom, Axis, 5}}]デフォルトで,重なり合う部分は,不透明度を使って組み合せて塗りつぶされる:
data1 = TemporalData[TimeSeries, {{{1, 1, 2, 3, 5, 8, 11}},
{TemporalData`DateSpecification[{2015, 1, 1, 0, 0, 0.}, {2015, 1, 7, 0, 0, 0}, {1, "Day"}]}, 1,
{"Continuous", 1}, {"Discrete", 1}, 1,
{ResamplingMethod -> {"Interpolation", InterpolationOrder -> 1}}}, True, 10.2];
data2 = TemporalData[TimeSeries, {{{5, 8, 9, 6, 2, 4, 7}},
{TemporalData`DateSpecification[{2015, 1, 1, 0, 0, 0.}, {2015, 1, 7, 0, 0, 0}, {1, "Day"}]}, 1,
{"Continuous", 1}, {"Discrete", 1}, 1,
{ResamplingMethod -> {"Interpolation", InterpolationOrder -> 1}}}, True, 10.2];DateListStepPlot[{data1, data2}, Filling -> Axis]DateListStepPlot[{data1, data2}, Filling -> {2 -> {1}}]DateListStepPlot[{data1, data2}, Filling -> {2 -> {{1}, LightGray}}]FillingStyle (3)
data = TemporalData[TimeSeries, {{{1, 1, 2, 3, 5, 8, 11}},
{TemporalData`DateSpecification[{2015, 1, 1, 0, 0, 0.}, {2015, 1, 7, 0, 0, 0}, {1, "Day"}]}, 1,
{"Continuous", 1}, {"Discrete", 1}, 1,
{ResamplingMethod -> {"Interpolation", InterpolationOrder -> 1}}}, True, 10.2];DateListStepPlot[data, Filling -> Axis, FillingStyle -> Red]DateListStepPlot[data, Filling -> Axis, FillingStyle -> {Red, Blue}]data1 = TemporalData[TimeSeries, {{{1, 1, 2, 3, 5, 8, 11}},
{TemporalData`DateSpecification[{2015, 1, 1, 0, 0, 0.}, {2015, 1, 7, 0, 0, 0}, {1, "Day"}]}, 1,
{"Continuous", 1}, {"Discrete", 1}, 1,
{ResamplingMethod -> {"Interpolation", InterpolationOrder -> 1}}}, True, 10.2];
data2 = TemporalData[TimeSeries, {{{5, 8, 9, 6, 2, 4, 7}},
{TemporalData`DateSpecification[{2015, 1, 1, 0, 0, 0.}, {2015, 1, 7, 0, 0, 0}, {1, "Day"}]}, 1,
{"Continuous", 1}, {"Discrete", 1}, 1,
{ResamplingMethod -> {"Interpolation", InterpolationOrder -> 1}}}, True, 10.2];DateListStepPlot[{data1, data2}, Filling -> Axis, FillingStyle -> Directive[Opacity[0.5], Orange]]ColorFunctionから得られた変数の塗潰しスタイルを使う:
data = TemporalData[TimeSeries, {{{1, 1, 2, 3, 5, 8, 11}},
{TemporalData`DateSpecification[{2015, 8, 1, 0, 0, 0.}, {2015, 8, 7, 0, 0, 0}, {1, "Day"}]}, 1,
{"Continuous", 1}, {"Discrete", 1}, 1,
{ResamplingMethod -> {"Interpolation", InterpolationOrder -> 1}}}, True, 10.2];DateListStepPlot[data, ColorFunction -> Function[{x, y}, Hue[y]], Filling -> Axis, FillingStyle -> Automatic]Frame (4)
DateListStepPlotは,デフォルトで,枠を使う:
DateListStepPlot[Range[10], {2007}]DateListStepPlot[Range[10], {2007}, Frame -> False]DateListStepPlot[Range[10], {2007}, Frame -> {{True, True}, {False, False}}]DateListStepPlot[Range[10], {2007}, Frame -> {{True, False}, {True, False}}]FrameLabel (4)
DateListStepPlot[Range[10], {2007}, FrameLabel -> {"label"}]DateListStepPlot[Range[10], {2007}, FrameLabel -> {"Bottom", "Left"}]DateListStepPlot[Range[10], {2007}, FrameLabel -> {{"left", "right"}, {"bottom", "top"}}]DateListStepPlot[Range[10], {2007}, FrameLabel -> {{"left", "right"}, {"bottom", "top"}}, LabelStyle -> Directive[Bold, StandardGreen]]FrameStyle (2)
DateListStepPlot[Range[10], {2007}, FrameStyle -> Directive[StandardGreen, Thick]]DateListStepPlot[Range[10], {2007}, FrameStyle -> {{Directive[StandardGreen, Thick], Directive[Red, Thick]}, {Directive[Gray, Thick], Directive[Blue, Thick]}}]FrameTicks (9)
DateListStepPlot[Range[10], {2007}]DateListStepPlot[Range[10], {2007}, FrameTicks -> None]DateListStepPlot[Range[10], {2007}, FrameTicks -> {{None, None}, {Automatic, None}}]デフォルトで,上と右の辺には目盛が目盛ラベルなしで置かれる:
DateListStepPlot[Range[10], {2007}, FrameTicks -> Automatic]Allを使ってすべての辺に目盛ラベルを置く:
DateListStepPlot[Range[10], {2007}, FrameTicks -> All]DateListStepPlot[Range[10], {2007}, FrameTicks -> {{{2, .5, 10}, None}, {{"July 1, 2011", "July 1, 2014"}, None}}]DateListStepPlot[Range[10], {2007}, FrameTicks -> {{{{2, "two"}, {5, "five"}, {10, "ten"}}, None}, {{{"July 1, 2011", "date 1"}, {"July 1, 2014", "date 2"}}, None}}]DateListStepPlot[Range[10], {2007}, FrameTicks -> {{{{2, "two", .15}, {5, "five", .45}, {10, "ten", .95}}, None}, {Automatic, None}}]DateListStepPlot[Range[10], {2007}, FrameTicks -> {{{{2, "two", {.15, .1}}, {5, "five", {.45, .2}}, {10, "ten", {.95, .3}}}, None}, {Automatic, None}}]DateListStepPlot[Range[10], {2007}, FrameTicks -> {{{{2, "two", .12, Directive[Blue, Thick]}, {5, "five", .4, Directive[Red, Thick, Dashed]}, {10, "ten", .9, Directive[Green, Thick, Dashed]}}, None}, {Automatic, None}}]minMeanMax[min_, max_] := {{min, min}, {(max + min) / 2, (max + min) / 2}, {max, max}}DateListStepPlot[Range[10], {2007}, FrameTicks -> {{minMeanMax, None}, {Automatic, None}}, PlotRangePadding -> None]FrameTicksStyle (3)
デフォルトで,枠目盛と枠目盛ラベルには枠と同じスタイルが使われる:
DateListStepPlot[Range[10], {2007}, FrameStyle -> Directive[Red]]DateListStepPlot[Range[10], {2007}, FrameStyle -> Directive[Red], FrameTicksStyle -> Directive[Blue, Thick]]DateListStepPlot[Range[10], {2007}, FrameTicks -> All, FrameTicksStyle -> {{Directive[Orange, Thick], Blue}, {Red, Green}}]GridLines (1)
data = TemporalData[TimeSeries, {{{1, 1, 2, 3, 5, 8, 11}},
{TemporalData`DateSpecification[{2015, 8, 1, 0, 0, 0.}, {2015, 8, 7, 0, 0, 0}, {1, "Day"}]}, 1,
{"Continuous", 1}, {"Discrete", 1}, 1,
{ResamplingMethod -> {"Interpolation", InterpolationOrder -> 1}}}, True, 10.2];DateListStepPlot[data, GridLines -> Automatic]DateListStepPlot[data, GridLines -> {{"Aug 2, 2015", "Aug 6, 2015"}, None}]GridLinesStyle (1)
data = TemporalData[TimeSeries, {{{1, 1, 2, 3, 5, 8, 11}},
{TemporalData`DateSpecification[{2015, 1, 1, 0, 0, 0.}, {2015, 1, 7, 0, 0, 0}, {1, "Day"}]}, 1,
{"Continuous", 1}, {"Discrete", 1}, 1,
{ResamplingMethod -> {"Interpolation", InterpolationOrder -> 1}}}, True, 314.1];DateListStepPlot[data, GridLines -> Automatic, GridLinesStyle -> Dotted]ImageSize (7)
Tiny,Small,Medium,Largeのような名前付きのサイズを使う:
{DateListStepPlot[TemporalData[TimeSeries, {{{5, 8, 9, 6, 2, 4, 7}},
{TemporalData`DateSpecification[{2015, 1, 1, 0, 0, 0.}, {2015, 1, 7, 0, 0, 0}, {1, "Day"}]}, 1,
{"Continuous", 1}, {"Discrete", 1}, 1,
{ResamplingMethod -> {"Interpolation", InterpolationOrder -> 1}}}, True, 314.1], ImageSize -> Tiny], DateListStepPlot[TemporalData[TimeSeries, {{{5, 8, 9, 6, 2, 4, 7}},
{TemporalData`DateSpecification[{2015, 1, 1, 0, 0, 0.}, {2015, 1, 7, 0, 0, 0}, {1, "Day"}]}, 1,
{"Continuous", 1}, {"Discrete", 1}, 1,
{ResamplingMethod -> {"Interpolation", InterpolationOrder -> 1}}}, True, 314.1], ImageSize -> Small]}{DateListStepPlot[TemporalData[TimeSeries, {{{5, 8, 9, 6, 2, 4, 7}},
{TemporalData`DateSpecification[{2015, 1, 1, 0, 0, 0.}, {2015, 1, 7, 0, 0, 0}, {1, "Day"}]}, 1,
{"Continuous", 1}, {"Discrete", 1}, 1,
{ResamplingMethod -> {"Interpolation", InterpolationOrder -> 1}}}, True, 314.1], ImageSize -> 150], DateListStepPlot[TemporalData[TimeSeries, {{{5, 8, 9, 6, 2, 4, 7}},
{TemporalData`DateSpecification[{2015, 1, 1, 0, 0, 0.}, {2015, 1, 7, 0, 0, 0}, {1, "Day"}]}, 1,
{"Continuous", 1}, {"Discrete", 1}, 1,
{ResamplingMethod -> {"Interpolation", InterpolationOrder -> 1}}}, True, 314.1], AspectRatio -> 1.5, ImageSize -> 150]}{DateListStepPlot[TemporalData[TimeSeries, {{{5, 8, 9, 6, 2, 4, 7}},
{TemporalData`DateSpecification[{2015, 1, 1, 0, 0, 0.}, {2015, 1, 7, 0, 0, 0}, {1, "Day"}]}, 1,
{"Continuous", 1}, {"Discrete", 1}, 1,
{ResamplingMethod -> {"Interpolation", InterpolationOrder -> 1}}}, True, 314.1], ImageSize -> {Automatic, 150}], DateListStepPlot[TemporalData[TimeSeries, {{{5, 8, 9, 6, 2, 4, 7}},
{TemporalData`DateSpecification[{2015, 1, 1, 0, 0, 0.}, {2015, 1, 7, 0, 0, 0}, {1, "Day"}]}, 1,
{"Continuous", 1}, {"Discrete", 1}, 1,
{ResamplingMethod -> {"Interpolation", InterpolationOrder -> 1}}}, True, 314.1], AspectRatio -> 2, ImageSize -> {Automatic, 150}]}{DateListStepPlot[TemporalData[TimeSeries, {{{5, 8, 9, 6, 2, 4, 7}},
{TemporalData`DateSpecification[{2015, 1, 1, 0, 0, 0.}, {2015, 1, 7, 0, 0, 0}, {1, "Day"}]}, 1,
{"Continuous", 1}, {"Discrete", 1}, 1,
{ResamplingMethod -> {"Interpolation", InterpolationOrder -> 1}}}, True, 314.1], ImageSize -> UpTo[200]], DateListStepPlot[TemporalData[TimeSeries, {{{5, 8, 9, 6, 2, 4, 7}},
{TemporalData`DateSpecification[{2015, 1, 1, 0, 0, 0.}, {2015, 1, 7, 0, 0, 0}, {1, "Day"}]}, 1,
{"Continuous", 1}, {"Discrete", 1}, 1,
{ResamplingMethod -> {"Interpolation", InterpolationOrder -> 1}}}, True, 314.1], AspectRatio -> 2, ImageSize -> UpTo[200]]}グラフィックスの幅と高さを指定し,必要な場合はスペースで充填する:
DateListStepPlot[TemporalData[TimeSeries, {{{5, 8, 9, 6, 2, 4, 7}},
{TemporalData`DateSpecification[{2015, 1, 1, 0, 0, 0.}, {2015, 1, 7, 0, 0, 0}, {1, "Day"}]}, 1,
{"Continuous", 1}, {"Discrete", 1}, 1,
{ResamplingMethod -> {"Interpolation", InterpolationOrder -> 1}}}, True, 314.1], ImageSize -> {200, 200}, Background -> StandardGray]AspectRatioFullとすると使用可能なスペースが塗り潰される:
DateListStepPlot[TemporalData[TimeSeries, {{{5, 8, 9, 6, 2, 4, 7}},
{TemporalData`DateSpecification[{2015, 1, 1, 0, 0, 0.}, {2015, 1, 7, 0, 0, 0}, {1, "Day"}]}, 1,
{"Continuous", 1}, {"Discrete", 1}, 1,
{ResamplingMethod -> {"Interpolation", InterpolationOrder -> 1}}}, True, 314.1], AspectRatio -> Full, ImageSize -> {200, 200}, Background -> StandardGray]{DateListStepPlot[TemporalData[TimeSeries, {{{5, 8, 9, 6, 2, 4, 7}},
{TemporalData`DateSpecification[{2015, 1, 1, 0, 0, 0.}, {2015, 1, 7, 0, 0, 0}, {1, "Day"}]}, 1,
{"Continuous", 1}, {"Discrete", 1}, 1,
{ResamplingMethod -> {"Interpolation", InterpolationOrder -> 1}}}, True, 314.1], ImageSize -> {UpTo[150], UpTo[100]}], DateListStepPlot[TemporalData[TimeSeries, {{{5, 8, 9, 6, 2, 4, 7}},
{TemporalData`DateSpecification[{2015, 1, 1, 0, 0, 0.}, {2015, 1, 7, 0, 0, 0}, {1, "Day"}]}, 1,
{"Continuous", 1}, {"Discrete", 1}, 1,
{ResamplingMethod -> {"Interpolation", InterpolationOrder -> 1}}}, True, 314.1], AspectRatio -> 2, ImageSize -> {UpTo[150], UpTo[100]}]}ImageSizeFullを使ってオブジェクト内の使用可能なスペースを塗り潰す:
Framed[Pane[DateListStepPlot[TemporalData[TimeSeries, {{{5, 8, 9, 6, 2, 4, 7}},
{TemporalData`DateSpecification[{2015, 1, 1, 0, 0, 0.}, {2015, 1, 7, 0, 0, 0}, {1, "Day"}]}, 1,
{"Continuous", 1}, {"Discrete", 1}, 1,
{ResamplingMethod -> {"Interpolation", InterpolationOrder -> 1}}}, True, 314.1], ImageSize -> Full, Background -> StandardGray], {200, 100}]]Framed[Pane[DateListStepPlot[TemporalData[TimeSeries, {{{5, 8, 9, 6, 2, 4, 7}},
{TemporalData`DateSpecification[{2015, 1, 1, 0, 0, 0.}, {2015, 1, 7, 0, 0, 0}, {1, "Day"}]}, 1,
{"Continuous", 1}, {"Discrete", 1}, 1,
{ResamplingMethod -> {"Interpolation", InterpolationOrder -> 1}}}, True, 314.1], ImageSize -> {Scaled[0.5], Scaled[0.5]}, Background -> StandardGray], {200, 100}]]Joined (1)
data = TemporalData[TimeSeries, {{{1, 1, 2, 3, 5, 8, 11}},
{TemporalData`DateSpecification[{2015, 1, 1, 0, 0, 0.}, {2015, 1, 7, 0, 0, 0}, {1, "Day"}]}, 1,
{"Continuous", 1}, {"Discrete", 1}, 1,
{ResamplingMethod -> {"Interpolation", InterpolationOrder -> 1}}}, True, 314.1];DateListStepPlot[data]Joined->Falseを使って垂直線分のないプロットを作る:
DateListStepPlot[data, Joined -> False]LabelingSize (4)
DateListPlot[TimeSeries[{1, 1, 2, 3, 5, 8}, {"Jan 1, 2015"}] -> {"healthfulness", "obstreperous", "spectrogram", "vestige", "coinage", "limey"}, ImageSize -> Medium]DateListStepPlot[TimeSeries[{1, 1, 2, 3, 5, 8}, {"Jan 1, 2015"}] -> {[image], [image], [image], [image], [image], [image]}, ImageSize -> Medium]DateListStepPlot[TimeSeries[{1, 1, 2, 3, 5, 8}, {"Jan 1, 2015"}] -> {"healthfulness", "obstreperous", "spectrogram", "vestige", "coinage", "limey"}, ImageSize -> Medium, LabelingSize -> 30]DateListStepPlot[TimeSeries[{1, 1, 2, 3, 5, 8}, {"Jan 1, 2015"}] -> {[image], [image], [image], [image], [image], [image]}, ImageSize -> Medium, LabelingSize -> 20]DateListStepPlot[TimeSeries[{1, 1, 2, 3, 5, 8}, {"Jan 1, 2015"}] -> {[image], [image], [image], [image], [image], [image]}, ImageSize -> Medium, LabelingSize -> Full]Mesh (1)
data = TemporalData[TimeSeries, {{{1, 1, 2, 3, 5, 8, 11}},
{TemporalData`DateSpecification[{2015, 1, 1, 0, 0, 0.}, {2015, 1, 7, 0, 0, 0}, {1, "Day"}]}, 1,
{"Continuous", 1}, {"Discrete", 1}, 1,
{ResamplingMethod -> {"Interpolation", InterpolationOrder -> 1}}}, True, 314.1];DateListStepPlot[data, Mesh -> Full]Table[DateListStepPlot[data, step, Mesh -> Full, PlotLabel -> step], {step, {Left, Right, Center}}]Table[DateListStepPlot[data, Mesh -> m, PlotLabel -> Mesh -> m], {m, {All, 15, None, Automatic}}]MeshFunctions (1)
方向(赤)に7のメッシュレベルを,
方向(青)に10のメッシュレベルを示す:
data = TemporalData[TimeSeries, {{{1, 1, 2, 3, 5, 8, 11}},
{TemporalData`DateSpecification[{2015, 8, 1, 0, 0, 0.}, {2015, 8, 7, 0, 0, 0}, {1, "Day"}]}, 1,
{"Continuous", 1}, {"Discrete", 1}, 1,
{ResamplingMethod -> {"Interpolation", InterpolationOrder -> 1}}}, True, 10.2];DateListStepPlot[data, Center, Mesh -> {7, 10}, MeshFunctions -> {#1&, #2&}, MeshStyle -> {Directive[PointSize[Medium], Red], Blue}]MeshShading (1)
data = TemporalData[TimeSeries, {{{1, 1, 2, 3, 5, 8, 11}},
{TemporalData`DateSpecification[{2015, 1, 1, 0, 0, 0.}, {2015, 1, 7, 0, 0, 0}, {1, "Day"}]}, 1,
{"Continuous", 1}, {"Discrete", 1}, 1,
{ResamplingMethod -> {"Interpolation", InterpolationOrder -> 1}}}, True, 314.1];DateListStepPlot[data, Mesh -> 15, MeshFunctions -> {#1&}, MeshShading -> {Red, Blue}]MeshShadingはPlotStyleとともに使うことができる:
DateListStepPlot[data, Mesh -> 15, PlotStyle -> Dashed, MeshFunctions -> {#1&}, MeshShading -> {Red, Blue}]MeshStyle (1)
data = TemporalData[TimeSeries, {{{1, 1, 2, 3, 5, 8, 11}},
{TemporalData`DateSpecification[{2015, 8, 1, 0, 0, 0.}, {2015, 8, 7, 0, 0, 0}, {1, "Day"}]}, 1,
{"Continuous", 1}, {"Discrete", 1}, 1,
{ResamplingMethod -> {"Interpolation", InterpolationOrder -> 1}}}, True, 10.2];DateListStepPlot[data, Mesh -> Full, MeshStyle -> Red]PlotFit (4)
DateListStepPlot[TimeSeries[TimeEventSeries`TimestampData[Association["UniformlySpacedQ" -> False,
"Timestamps" -> TabularColumn[Association[
"Data" -> {61, {{NumericArray[{19724, 19725, 19726, 19727, 19730, 19731, 19732, 19733, 19734,
19738, ... 94.28900146484375, 95.00199890136719, 92.56099700927734, 90.25, 90.35600280761719}, {},
None}}, None}, "ElementType" -> TypeSpecifier["Quantity"]["Real64", "USDollars"]]],
Association["ResamplingMethod" -> "LinearInterpolation"]], PlotFit -> Automatic]DateListStepPlot[TimeSeries[TimeEventSeries`TimestampData[Association["UniformlySpacedQ" -> False,
"Timestamps" -> TabularColumn[Association[
"Data" -> {61, {{NumericArray[{19724, 19725, 19726, 19727, 19730, 19731, 19732, 19733, 19734,
19738, ... 94.28900146484375, 95.00199890136719, 92.56099700927734, 90.25, 90.35600280761719}, {},
None}}, None}, "ElementType" -> TypeSpecifier["Quantity"]["Real64", "USDollars"]]],
Association["ResamplingMethod" -> "LinearInterpolation"]], PlotFit -> "Linear"]DateListStepPlot[TimeSeries[TimeEventSeries`TimestampData[Association["UniformlySpacedQ" -> False,
"Timestamps" -> TabularColumn[Association[
"Data" -> {61, {{NumericArray[{19724, 19725, 19726, 19727, 19730, 19731, 19732, 19733, 19734,
19738, ... 94.28900146484375, 95.00199890136719, 92.56099700927734, 90.25, 90.35600280761719}, {},
None}}, None}, "ElementType" -> TypeSpecifier["Quantity"]["Real64", "USDollars"]]],
Association["ResamplingMethod" -> "LinearInterpolation"]], PlotFit -> "Quadratic"]DateListStepPlot[TimeSeries[TimeEventSeries`TimestampData[Association["UniformlySpacedQ" -> False,
"Timestamps" -> TabularColumn[Association[
"Data" -> {61, {{NumericArray[{19724, 19725, 19726, 19727, 19730, 19731, 19732, 19733, 19734,
19738, ... 94.28900146484375, 95.00199890136719, 92.56099700927734, 90.25, 90.35600280761719}, {},
None}}, None}, "ElementType" -> TypeSpecifier["Quantity"]["Real64", "USDollars"]]],
Association["ResamplingMethod" -> "LinearInterpolation"]], PlotFit -> PeriodicModel[3]]//QuietPlotFitElements (2)
データに対する信頼帯を,デフォルトの信頼水準0.95でプロットする:
DateListStepPlot[TimeSeries[TimeEventSeries`TimestampData[Association["UniformlySpacedQ" -> False,
"Timestamps" -> TabularColumn[Association[
"Data" -> {61, {{NumericArray[{19724, 19725, 19726, 19727, 19730, 19731, 19732, 19733, 19734,
19738, ... 94.28900146484375, 95.00199890136719, 92.56099700927734, 90.25, 90.35600280761719}, {},
None}}, None}, "ElementType" -> TypeSpecifier["Quantity"]["Real64", "USDollars"]]],
Association["ResamplingMethod" -> "LinearInterpolation"]], PlotFit -> Automatic, PlotFitElements -> "BandCurves"]DateListStepPlot[TimeSeries[TimeEventSeries`TimestampData[Association["UniformlySpacedQ" -> False,
"Timestamps" -> TabularColumn[Association[
"Data" -> {61, {{NumericArray[{19724, 19725, 19726, 19727, 19730, 19731, 19732, 19733, 19734,
19738, ... 94.28900146484375, 95.00199890136719, 92.56099700927734, 90.25, 90.35600280761719}, {},
None}}, None}, "ElementType" -> TypeSpecifier["Quantity"]["Real64", "USDollars"]]],
Association["ResamplingMethod" -> "LinearInterpolation"]], PlotFit -> Automatic, PlotFitElements -> {"BandCurves", <|"ConfidenceLevel" -> 0.5|>}]DateListStepPlot[TimeSeries[TimeEventSeries`TimestampData[Association["UniformlySpacedQ" -> False,
"Timestamps" -> TabularColumn[Association[
"Data" -> {61, {{NumericArray[{19724, 19725, 19726, 19727, 19730, 19731, 19732, 19733, 19734,
19738, ... 94.28900146484375, 95.00199890136719, 92.56099700927734, 90.25, 90.35600280761719}, {},
None}}, None}, "ElementType" -> TypeSpecifier["Quantity"]["Real64", "USDollars"]]],
Association["ResamplingMethod" -> "LinearInterpolation"]], PlotFit -> Automatic, PlotFitElements -> "Residuals"]DateListStepPlot[TimeSeries[TimeEventSeries`TimestampData[Association["UniformlySpacedQ" -> False,
"Timestamps" -> TabularColumn[Association[
"Data" -> {61, {{NumericArray[{19724, 19725, 19726, 19727, 19730, 19731, 19732, 19733, 19734,
19738, ... 94.28900146484375, 95.00199890136719, 92.56099700927734, 90.25, 90.35600280761719}, {},
None}}, None}, "ElementType" -> TypeSpecifier["Quantity"]["Real64", "USDollars"]]],
Association["ResamplingMethod" -> "LinearInterpolation"]], PlotFit -> Automatic, PlotFitElements -> {"DataPoints", {"Residuals", <|"Style" -> Opacity[1, StandardRed]|>}}]PlotHighlighting (9)
デフォルト設定のPlotHighlightingAutomaticのとき,プロットにはインタラクティブな座標のコールアウトが付く:
DateListStepPlot[Range[10], {2007}]PlotHighlightingNoneを使ってプロット全体のハイライトをオフにする:
DateListStepPlot[Range[10], {2007}, PlotHighlighting -> None]点集合にマウスオーバーして任意のグラフィックス指示子でハイライトする:
DateListPlot[{Range[10], 2 * Range[10]}, {2007}, PlotHighlighting -> Directive[Red, AbsolutePointSize[10], DropShadowing[]]]DateListStepPlot[{Range[10], 2 * Range[10]}, {2007}, PlotHighlighting -> "Dropline"]曲線にマウスオーバーして軸までのドロップラインとラベルでハイライトする:
DateListStepPlot[Range[10], {2007}, PlotHighlighting -> "Dropline"]DateListStepPlot[Range[10], {2007}, PlotHighlighting -> Placed["Dropline", DateObject[{2012, 1, 1}]]]プロットにマウスオーバーして
位置に対応する
の値を示すスライスでハイライトする:
DateListStepPlot[{Range[10], 2 * Range[10]}, {2007}, PlotHighlighting -> "XSlice"]DateListStepPlot[Range[10], {2007}, PlotHighlighting -> Placed["XSlice", DateObject[{2014, 1, 1}]]]プロットにマウスオーバーして
位置に対応する
の値を示すスライスでハイライトする:
DateListStepPlot[{Range[10], 2 * Range[10]}, {2007}, PlotHighlighting -> "YSlice"]DateListStepPlot[{Range[10], 2 * Range[10]}, {2007}, PlotHighlighting -> Placed["YSlice", 4]]DateListStepPlot[{Range[10], 2 * Range[10]}, {2007}, PlotHighlighting -> "XNearestPoint"]DateListStepPlot[{Range[10], 2 * Range[10]}, {2007}, PlotHighlighting -> {"XNearestPoint", <|"Style" -> StandardGray|>}]DateListStepPlot[{Range[10], 2 * Range[10]}, {2007}, PlotHighlighting -> "XYLabel"]Calloutオプションを使ってラベルの外観を変える:
DateListStepPlot[{Range[10], 2 * Range[10]}, {2007}, PlotHighlighting -> {"XYLabel", <|"Appearance" -> "Corners", "CalloutMarker" -> "Circle"|>}]DateListStepPlot[{Range[10], 2 * Range[10]}, {2007}, PlotHighlighting -> {{"XNearestPoint", <|"Style" -> StandardGray|>}, {"XYLabel", <|"Appearance" -> "Corners", "CalloutMarker" -> "Circle"|>}}]DateListStepPlot[{Range[10], 2 * Range[10]}, {2007}, PlotHighlighting -> {"XYLabel", <|"NumberForm" -> 4, "LabelingFunction" -> (Grid[{{"x", First[#1]}, {"y", Last[#1]}}]&)|>}]PlotInteractivity (3)
デフォルトで,プロットにはインタラクティブなハイライト機能がある:
DateListStepPlot[{2, 3, 5, 7, 11, 13, 17, 19, 23, 29}, Today]DateListStepPlot[{2, 3, 5, 7, 11, 13, 17, 19, 23, 29}, Today, PlotInteractivity -> False]与えられたインタラクティブ要素は許可するが自動のものは無効にする:
DateListStepPlot[{2, 3, 5, 7, 11, 13, 17, 19, 23, Tooltip[29, "hello"]}, Today, PlotMarkers -> Automatic, PlotInteractivity -> <|"User" -> True, "System" -> False|>]PlotLabel (1)
PlotLabels (4)
data1 = Transpose[{DateRange[{2000, 1, 1}, {2000, 1, 15}], RandomReal[10, 15]}];data2 = Transpose[{DateRange[{2000, 1, 1}, {2000, 1, 15}], RandomReal[10, 15]}];DateListStepPlot[{data1, data2}, PlotLabels -> {"label1", "label2"}]ge = FinancialData["GE", {{2015, 1, 1}, {2015, 1, 20}}];DateListStepPlot[ge, PlotLabels -> Placed["high", Above]]DateListStepPlot[ge, PlotLabels -> Placed["crisis", {{2015, 1, 15}, Below}]]PlotLabels->Automaticは連想のキーをデータのラベルとして使う:
DateListStepPlot[<|"a" -> Accumulate@RandomInteger[10, 10], "b" -> Accumulate@RandomInteger[10, 10]|>, {2007}, PlotLabels -> Automatic, PlotLegends -> None]Noneを使ってラベルを加えないようにする:
data1 = Transpose[{DateRange[{2000, 1, 1}, {2000, 1, 15}], Accumulate@RandomReal[10, 15]}];
data2 = Transpose[{DateRange[{2000, 1, 1}, {2000, 1, 15}], Accumulate@RandomReal[3, 15]}];DateListStepPlot[{data1, data2}, PlotLabels -> {"label1", None}]PlotLayout (1)
data1 = {{DateObject[{2016, 10, 1}, "Day", "Gregorian", -5.], 10}, {DateObject[{2016, 10, 15}, "Day", "Gregorian", -5.], 17}, {DateObject[{2016, 10, 30}, "Day", "Gregorian", -5.], 15}, {DateObject[{2016, 11, 20}, "Day", "Gregorian", -5.], 20}};data2 = {{DateObject[{2016, 10, 1}, "Day", "Gregorian", -5.], 15}, {DateObject[{2016, 10, 15}, "Day", "Gregorian", -5.], 7}, {DateObject[{2016, 10, 30}, "Day", "Gregorian", -5.], 12}, {DateObject[{2016, 11, 20}, "Day", "Gregorian", -5.], 10}};DateListStepPlot[{data1, data2}]DateListStepPlot[{data1, data2}, PlotLayout -> "Stacked"]PlotLegends (1)
DateListStepPlot[{TemporalData[...], TemporalData[...]}, PlotLegends -> {"one", "two"}]DateListStepPlot[{TemporalData[...], TemporalData[...]}, PlotStyle -> {Red, Blue}, PlotLegends -> {"one", "two"}]DateListStepPlot[{TemporalData[...], TemporalData[...]}, PlotStyle -> {Red, Blue}, PlotLegends -> Placed[{"one", "two"}, {0.3, 0.7}]]PlotMarkers (2)
PlotMarkers->Automaticを使って各ステップの点を示す:
data = TemporalData[TimeSeries, {{{1, 1, 2, 3, 5, 8, 11}},
{TemporalData`DateSpecification[{2015, 1, 1, 0, 0, 0.}, {2015, 1, 7, 0, 0, 0}, {1, "Day"}]}, 1,
{"Continuous", 1}, {"Discrete", 1}, 1,
{ResamplingMethod -> {"Interpolation", InterpolationOrder -> 1}}}, True, 314.1];DateListStepPlot[data, PlotMarkers -> Automatic]Table[DateListStepPlot[data, step, PlotMarkers -> Automatic, PlotLabel -> step], {step, {Right, Left, Center}}]data1 = TemporalData[TimeSeries, {{{1, 1, 2, 3, 5, 8, 11}},
{TemporalData`DateSpecification[{2015, 1, 1, 0, 0, 0.}, {2015, 1, 7, 0, 0, 0}, {1, "Day"}]}, 1,
{"Continuous", 1}, {"Discrete", 1}, 1,
{ResamplingMethod -> {"Interpolation", InterpolationOrder -> 1}}}, True, 314.1];
data2 = TemporalData[TimeSeries, {{{5, 8, 9, 6, 2, 4, 7}},
{TemporalData`DateSpecification[{2015, 1, 1, 0, 0, 0.}, {2015, 1, 7, 0, 0, 0}, {1, "Day"}]}, 1,
{"Continuous", 1}, {"Discrete", 1}, 1,
{ResamplingMethod -> {"Interpolation", InterpolationOrder -> 1}}}, True, 314.1];
data3 = TemporalData[TimeSeries, {{{3, 5, 7, 11, 13, 17}},
{TemporalData`DateSpecification[{2015, 1, 1, 0, 0, 0.}, {2015, 1, 6, 0, 0, 0}, {1, "Day"}]}, 1,
{"Continuous", 1}, {"Discrete", 1}, 1,
{ResamplingMethod -> {"Interpolation", InterpolationOrder -> 1}}}, True, 314.1];DateListStepPlot[{data1, data2, data3}, PlotMarkers -> Automatic]テキストラベルあるいはタイプセットされたラベルを使ってデータ集合を区別する:
DateListStepPlot[{data1, data2, data3}, Center, PlotMarkers -> {▲, ●, "Y"}, Joined -> False]DateListStepPlot[{data1, data2, data3}, Center, PlotMarkers -> "▲", Joined -> False, Mesh -> Full]PlotRange (1)
PlotRangeは自動的に計算される:
data = TemporalData[TimeSeries, {{{161.60000038146973, 159.19999980926514, 170.99999904632568,
91.09999942779541, 89.69999980926514, 95.59999942779541, 116.39999961853027,
122.00000095367432, 70.69999933242798, 84.2999997138977, 44., 85.09999990 ... Data`DateSpecification[{2010, 1, 17, 20, 45, 32.}, {2013, 12, 17, 20, 45, 32},
{1, "Month"}]}, 1, {"Continuous", 1}, {"Discrete", 1}, 1,
{ValueDimensions -> 1, ResamplingMethod -> {"Interpolation", InterpolationOrder -> 1}}}, True,
10.3];DateListStepPlot[data]DateListStepPlot[data, PlotRange -> All]DateListStepPlot[data, PlotRange -> {{"Nov 1, 2011", "Mar 31, 2012"}, {0, 100}}]PlotStyle (4)
DateListStepPlot[TimeSeries[TimeEventSeries`TimestampData[Association["UniformlySpacedQ" -> False,
"Timestamps" -> TabularColumn[Association[
"Data" -> {61, {{NumericArray[{19724, 19725, 19726, 19727, 19730, 19731, 19732, 19733, 19734,
19738, ... 648438, 173.49000549316406, 173.5500030517578,
180.1199951171875, 175.52999877929688}, {}, None}}, None},
"ElementType" -> TypeSpecifier["Quantity"]["Real64", "USDollars"]]],
Association["ResamplingMethod" -> "LinearInterpolation"]], PlotStyle -> StandardRed]DateListStepPlot[{TimeSeries[TimeEventSeries`TimestampData[Association["UniformlySpacedQ" -> False,
"Timestamps" -> TabularColumn[Association[
"Data" -> {61, {{NumericArray[{19724, 19725, 19726, 19727, 19730, 19731, 19732, 19733, 19734,
19738, ... 648438, 173.49000549316406, 173.5500030517578,
180.1199951171875, 175.52999877929688}, {}, None}}, None},
"ElementType" -> TypeSpecifier["Quantity"]["Real64", "USDollars"]]],
Association["ResamplingMethod" -> "LinearInterpolation"]], TimeSeries[TimeEventSeries`TimestampData[Association["UniformlySpacedQ" -> False,
"Timestamps" -> TabularColumn[Association[
"Data" -> {61, {{NumericArray[{19724, 19725, 19726, 19727, 19730, 19731, 19732, 19733, 19734,
19738, ... 94.28900146484375, 95.00199890136719, 92.56099700927734, 90.25, 90.35600280761719}, {},
None}}, None}, "ElementType" -> TypeSpecifier["Quantity"]["Real64", "USDollars"]]],
Association["ResamplingMethod" -> "LinearInterpolation"]]}]DateListStepPlot[{TimeSeries[TimeEventSeries`TimestampData[Association["UniformlySpacedQ" -> False,
"Timestamps" -> TabularColumn[Association[
"Data" -> {61, {{NumericArray[{19724, 19725, 19726, 19727, 19730, 19731, 19732, 19733, 19734,
19738, ... 648438, 173.49000549316406, 173.5500030517578,
180.1199951171875, 175.52999877929688}, {}, None}}, None},
"ElementType" -> TypeSpecifier["Quantity"]["Real64", "USDollars"]]],
Association["ResamplingMethod" -> "LinearInterpolation"]], TimeSeries[TimeEventSeries`TimestampData[Association["UniformlySpacedQ" -> False,
"Timestamps" -> TabularColumn[Association[
"Data" -> {61, {{NumericArray[{19724, 19725, 19726, 19727, 19730, 19731, 19732, 19733, 19734,
19738, ... 94.28900146484375, 95.00199890136719, 92.56099700927734, 90.25, 90.35600280761719}, {},
None}}, None}, "ElementType" -> TypeSpecifier["Quantity"]["Real64", "USDollars"]]],
Association["ResamplingMethod" -> "LinearInterpolation"]]}, PlotStyle -> {StandardBlue, StandardGreen}]連想に基づくシンタックスを使ってすべてのデータのベーススタイルを設定する:
DateListStepPlot[{TimeSeries[TimeEventSeries`TimestampData[Association["UniformlySpacedQ" -> False,
"Timestamps" -> TabularColumn[Association[
"Data" -> {61, {{NumericArray[{19724, 19725, 19726, 19727, 19730, 19731, 19732, 19733, 19734,
19738, ... 648438, 173.49000549316406, 173.5500030517578,
180.1199951171875, 175.52999877929688}, {}, None}}, None},
"ElementType" -> TypeSpecifier["Quantity"]["Real64", "USDollars"]]],
Association["ResamplingMethod" -> "LinearInterpolation"]], TimeSeries[TimeEventSeries`TimestampData[Association["UniformlySpacedQ" -> False,
"Timestamps" -> TabularColumn[Association[
"Data" -> {61, {{NumericArray[{19724, 19725, 19726, 19727, 19730, 19731, 19732, 19733, 19734,
19738, ... 94.28900146484375, 95.00199890136719, 92.56099700927734, 90.25, 90.35600280761719}, {},
None}}, None}, "ElementType" -> TypeSpecifier["Quantity"]["Real64", "USDollars"]]],
Association["ResamplingMethod" -> "LinearInterpolation"]]}, PlotStyle -> <|"Base" -> AbsoluteThickness[1]|>]DateListStepPlot[{TimeSeries[TimeEventSeries`TimestampData[Association["UniformlySpacedQ" -> False,
"Timestamps" -> TabularColumn[Association[
"Data" -> {61, {{NumericArray[{19724, 19725, 19726, 19727, 19730, 19731, 19732, 19733, 19734,
19738, ... 648438, 173.49000549316406, 173.5500030517578,
180.1199951171875, 175.52999877929688}, {}, None}}, None},
"ElementType" -> TypeSpecifier["Quantity"]["Real64", "USDollars"]]],
Association["ResamplingMethod" -> "LinearInterpolation"]], TimeSeries[TimeEventSeries`TimestampData[Association["UniformlySpacedQ" -> False,
"Timestamps" -> TabularColumn[Association[
"Data" -> {61, {{NumericArray[{19724, 19725, 19726, 19727, 19730, 19731, 19732, 19733, 19734,
19738, ... 94.28900146484375, 95.00199890136719, 92.56099700927734, 90.25, 90.35600280761719}, {},
None}}, None}, "ElementType" -> TypeSpecifier["Quantity"]["Real64", "USDollars"]]],
Association["ResamplingMethod" -> "LinearInterpolation"]]}, PlotStyle -> <|"Lists" -> {StandardOrange, StandardMagenta}|>]各データ集合のスタイルとともに全体的なベーススタイルを与える:
DateListStepPlot[{TimeSeries[TimeEventSeries`TimestampData[Association["UniformlySpacedQ" -> False,
"Timestamps" -> TabularColumn[Association[
"Data" -> {61, {{NumericArray[{19724, 19725, 19726, 19727, 19730, 19731, 19732, 19733, 19734,
19738, ... 648438, 173.49000549316406, 173.5500030517578,
180.1199951171875, 175.52999877929688}, {}, None}}, None},
"ElementType" -> TypeSpecifier["Quantity"]["Real64", "USDollars"]]],
Association["ResamplingMethod" -> "LinearInterpolation"]], TimeSeries[TimeEventSeries`TimestampData[Association["UniformlySpacedQ" -> False,
"Timestamps" -> TabularColumn[Association[
"Data" -> {61, {{NumericArray[{19724, 19725, 19726, 19727, 19730, 19731, 19732, 19733, 19734,
19738, ... 94.28900146484375, 95.00199890136719, 92.56099700927734, 90.25, 90.35600280761719}, {},
None}}, None}, "ElementType" -> TypeSpecifier["Quantity"]["Real64", "USDollars"]]],
Association["ResamplingMethod" -> "LinearInterpolation"]]}, PlotStyle -> <|"Base" -> AbsoluteThickness[1], "Lists" -> {StandardOrange, StandardMagenta}|>]PlotTheme (1)
data1 = TemporalData[TimeSeries, {{{1, 1, 2, 3, 5, 8, 11}},
{TemporalData`DateSpecification[{2015, 1, 1, 0, 0, 0.}, {2015, 1, 7, 0, 0, 0}, {1, "Day"}]}, 1,
{"Continuous", 1}, {"Discrete", 1}, 1,
{ResamplingMethod -> {"Interpolation", InterpolationOrder -> 1}}}, True, 314.1];
data2 = TemporalData[TimeSeries, {{{5, 8, 9, 6, 2, 4, 7}},
{TemporalData`DateSpecification[{2015, 1, 1, 0, 0, 0.}, {2015, 1, 7, 0, 0, 0}, {1, "Day"}]}, 1,
{"Continuous", 1}, {"Discrete", 1}, 1,
{ResamplingMethod -> {"Interpolation", InterpolationOrder -> 1}}}, True, 314.1];DateListStepPlot[{data1, data2}, PlotTheme -> "Business"]DateListStepPlot[{data1, data2}, PlotTheme -> "Business", PlotStyle -> {StandardRed, StandardBlue}]DateListStepPlot[{data1, data2}, PlotTheme -> "Minimal"]ScalingFunctions (7)
DateListStepPlot[TimeSeries[{1, 1, 4, 9, 25, 64, 121}, {"Jan 1, 2015"}]]DateListStepPlot[TimeSeries[{1, 1, 4, 9, 25, 64, 121}, {"Jan 1, 2015"}], ScalingFunctions -> "Log"]DateListStepPlot[TimeSeries[{1, 1, 4, 9, 25, 64, 121}, {"Jan 1, 2015"}], ScalingFunctions -> "Reverse"]DateListStepPlot[TimeSeries[{1, 1, 2, 3, 5, 8, 11}, {"Jan 1, 2015"}], ScalingFunctions -> "Reciprocal"]DateListStepPlot[TimeSeries[{1, 1, 4, 9, 25, 64, 121}, {"Jan 1, 2015"}], ScalingFunctions -> {-Log[#]&, Exp[-#]&}]FrameTicksとGridLines内の位置は自動的にスケールされる:
DateListStepPlot[TimeSeries[{1, 1, 4, 9, 25, 64, 121}, {"Jan 1, 2015"}], ScalingFunctions -> "Log", FrameTicks -> {Automatic, 2 ^ Range[0, 10]}, GridLines -> {None, 2 ^ Range[0, 10]}]PlotRangeは自動的にスケールされる:
DateListStepPlot[TimeSeries[{1, 1, 4, 9, 25, 64, 121}, {"Jan 1, 2015"}], ScalingFunctions -> "Log", PlotRange -> {0.5, 500}]Ticks (9)
DateListStepPlot[Range[10], {2007}, Axes -> True, Frame -> False]DateListStepPlot[Range[10], {2007}, Frame -> False, Axes -> True, Ticks -> {None, None}]DateListStepPlot[Range[10], {2007}, Frame -> False, Axes -> True, Ticks -> {Automatic, None}]DateListStepPlot[Range[10], {2007}, Frame -> False, Axes -> True, Ticks -> {{"July 1, 2011", "July 1, 2014"}, {2, 3, 5, 7, 9}}]DateListStepPlot[Range[10], {2007}, Frame -> False, Axes -> True, Ticks -> {{{"July 1, 2011", "year 1"}, {"July 1, 2014", "year 2"}}, {{2, "two"}, {5, "five"}, {9, "nine"}}}]片方の軸には特定の目盛を使い,もう片方の軸には自動目盛を使う:
DateListStepPlot[Range[10], {2007}, Frame -> False, Axes -> True, Ticks -> {{{"July 1, 2011", "year 1"}, {"July 1, 2014", "year 2"}}, Automatic}]DateListStepPlot[Range[10], {2007}, Frame -> False, Axes -> True, Ticks -> {{{"July 1, 2011", "a", .25}, {"July 1, 2014", "b", .45}}, Automatic}]DateListStepPlot[Range[10], {2007}, Frame -> False, Axes -> True, Ticks -> {{{"July 1, 2011", "a", {.27, .1}}, {"July 1, 2014", "b", {.45, .2}}}, Automatic}]DateListStepPlot[Range[10], {2007}, Frame -> False, Axes -> True, Ticks -> {{{"July 1, 2011", "a", .29, Directive[Blue, Thick]}, {"July 1, 2014", "b", .45, Directive[StandardGray, Thick, Dashed]}}, Automatic}]minMeanMax[min_, max_] := {{min, min}, {(max + min) / 2, (max + min) / 2}, {max, max}}DateListStepPlot[Range[10], {2007}, Frame -> False, Axes -> True, Ticks -> {Automatic, minMeanMax}, PlotRangePadding -> None]TicksStyle (4)
デフォルトで,目盛と目盛ラベルには軸と同じスタイルが使われる:
DateListStepPlot[Range[10], {2007}, Frame -> False, Axes -> True, AxesStyle -> Red]DateListStepPlot[Range[10], {2007}, Frame -> False, Axes -> True, TicksStyle -> Directive[Red]]DateListStepPlot[Range[10], {2007}, Frame -> False, Axes -> True, TicksStyle -> {Directive[StandardGreen, Thick], Directive[Blue, Thick]}]DateListStepPlot[Range[10], {2007}, Frame -> False, Axes -> True, TicksStyle -> Directive[Red, Thick], LabelStyle -> Blue]TargetUnits (1)
DateListStepPlot[{Quantity[1, "Meters"], Quantity[1, "Meters"], Quantity[2, "Meters"], Quantity[3, "Meters"], Quantity[5, "Meters"], Quantity[8, "Meters"], Quantity[11, "Meters"]}, {DateObject[{2015, 1, 1}], Automatic, "Month"}, FrameLabel -> Automatic]DateListStepPlot[{Quantity[1, "Meters"], Quantity[1, "Meters"], Quantity[2, "Meters"], Quantity[3, "Meters"], Quantity[5, "Meters"], Quantity[8, "Meters"], Quantity[11, "Meters"]}, {DateObject[{2015, 1, 1}], Automatic, "Month"}, FrameLabel -> Automatic, TargetUnits -> "Feet"]アプリケーション (7)
DateListStepPlot[{0, 1, 0, 1, 0, 1, 0, 0, 1, 0, 1, 0, 1, 1, 0}, {{2015, 1, 1}, Automatic, "Milliseconds"}, AxesOrigin -> {Automatic, -0.5}, AspectRatio -> 1 / 10, Frame -> False, Ticks -> {Automatic, {0, 1}}]DateListStepPlot[{Accumulate@{180, 40, 50, 70, 100, 60, 70}, Accumulate@{30, 80, 50, 70, 50, 50, 110}}, {{2015, 1, 1}, Automatic, "Days"}, Center, Filling -> {2 -> {1}}, PlotLegends -> {"stock", "sales"}, AxesLabel -> {None, "Items"}]ボストンのローガン国際空港における2000年1月1日から2005年12月31日までの総降水量を示す:
DateListStepPlot[WeatherData["KBOS", "TotalPrecipitation", {{2000, 1, 1}, {2005, 12, 31}, "Month"}], Joined -> True]フランスの1985年から2005年までのGDPをステップごとにプロットする:
DateListStepPlot[CountryData["France", {{"GDP"}, {1985, 2005}}]]ts = TemporalData[TimeSeries, {{{6., 6.300000190734863, 6.599999904632568, 6.5, 7.199999809265137,
7.199999809265137, 6.099999904632568, 6.800000190734863, 6.800000190734863, 6.900000095367432,
6.900000095367432, 6.900000095367432, 6., 6.19999 ... 896, 3593856774, 3593869244,
3594181712, 3594349654, 3594849854, 3594868197, 3596312288}}}, 1, {"Continuous", 1},
{"Discrete", 1}, 1, {ValueDimensions -> 1, ResamplingMethod ->
{"Interpolation", InterpolationOrder -> 1}}}, True, 10.];DateListPlot[ts]DateListStepPlot[TimeSeriesAggregate[ts, "Month"]]path = Accumulate[Prepend[RandomReal[ExponentialDistribution[0.5], 30], 0]];data = Transpose[{path, Range[Length[path]]}];DateListStepPlot[data]状態が系の中のジョブ数である,M/M/1待ち行列のシミュレーションを示す:
data = RandomFunction[QueueingProcess[3 / 3600, 5 / 3600], {0, 15 * 3600}]DateListStepPlot[data, Filling -> Axis]特性と関係 (4)
DateListStepPlotは値の間を補間しない:
data = CountryData["France", {{"GDP"}, {1985, 2005}}];DateListStepPlot[data]DateListPlotを使って値の間を文字通り補間する:
DateListPlot[data]DateListPlot[data, InterpolationOrder -> 3]ListStepPlotは日付あるいは時間である
の値を補間しない:
data = {{1, 10}, {2, 12}, {3, 15}, {4, 20}};{ListStepPlot[data], DateListStepPlot[data]}DateListStepPlotは,日付に関連付けられた値をプロットする:
data = {DateObject[{2015, 6, 10}, "Day", "Gregorian", -6.], DateObject[{2015, 6, 26}, "Day", "Gregorian", -6.], DateObject[{2015, 6, 15}, "Day", "Gregorian", -6.], DateObject[{2015, 6, 25}, "Day", "Gregorian", -6.], DateObject[{2015, 6, 23}, "Day", "Gregorian", -6.], DateObject[{2015, 6, 19}, "Day", "Gregorian", -6.], DateObject[{2015, 5, 31}, "Day", "Gregorian", -6.], DateObject[{2015, 6, 6}, "Day", "Gregorian", -6.], DateObject[{2015, 6, 4}, "Day", "Gregorian", -6.], DateObject[{2015, 6, 16}, "Day", "Gregorian", -6.], DateObject[{2015, 5, 29}, "Day", "Gregorian", -6.], DateObject[{2015, 6, 4}, "Day", "Gregorian", -6.], DateObject[{2015, 6, 14}, "Day", "Gregorian", -6.], DateObject[{2015, 6, 3}, "Day", "Gregorian", -6.], DateObject[{2015, 6, 14}, "Day", "Gregorian", -6.], DateObject[{2015, 6, 6}, "Day", "Gregorian", -6.], DateObject[{2015, 6, 10}, "Day", "Gregorian", -6.], DateObject[{2015, 6, 19}, "Day", "Gregorian", -6.], DateObject[{2015, 6, 20}, "Day", "Gregorian", -6.], DateObject[{2015, 6, 21}, "Day", "Gregorian", -6.]};DateListStepPlot[Tally[data]]DateHistogramを使って日付のリストから数をプロットする:
DateHistogram[data, "Day"]TradingChartをグラフに使って各日付の価格と量を示す:
data = FinancialData["IBM", "OHLCV", {{2009, 5, 1}, {2009, 6, 1}}];TradingChart[data]履歴
2015 で導入 (10.3) | 2016 で更新 (10.4) ▪ 2016 (11.0) ▪ 2017 (11.2) ▪ 2018 (11.3) ▪ 2019 (12.0) ▪ 2023 (13.3) ▪ 2025 (14.2) ▪ 2025 (14.3) ▪ 2026 (15.0)
テキスト
Wolfram Research (2015), DateListStepPlot, Wolfram言語関数, https://reference.wolfram.com/language/ref/DateListStepPlot.html (2026年に更新).
CMS
Wolfram Language. 2015. "DateListStepPlot." Wolfram Language & System Documentation Center. Wolfram Research. Last Modified 2026. https://reference.wolfram.com/language/ref/DateListStepPlot.html.
APA
Wolfram Language. (2015). DateListStepPlot. Wolfram Language & System Documentation Center. Retrieved from https://reference.wolfram.com/language/ref/DateListStepPlot.html
BibTeX
@misc{reference.wolfram_2026_dateliststepplot, author="Wolfram Research", title="{DateListStepPlot}", year="2026", howpublished="\url{https://reference.wolfram.com/language/ref/DateListStepPlot.html}", note=[Accessed: 15-August-2026]}
BibLaTeX
@online{reference.wolfram_2026_dateliststepplot, organization={Wolfram Research}, title={DateListStepPlot}, year={2026}, url={https://reference.wolfram.com/language/ref/DateListStepPlot.html}, note=[Accessed: 15-August-2026]}