データの可視化
 この分野の概要
Wolfram言語はWolfram Researchで開発された独自のアルゴリズムを多数使って,構造化された,あるいは構造化されていないデータの認識的・審美的に優れた表現を作成するための処理を自動化する強力な関数を提供する.これらは点,線,面のデータだけでなく,グラフとネットワークのデータにも使える.
 ListPlot — 点のリストをプロットする
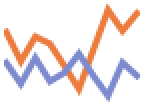 ListLinePlot — 点のリスト間を線でプロットする
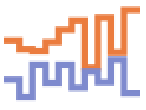 ListStepPlot — 値を階段関数としてプロットする
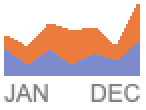
 StackedListPlot — 複数のプロットを順に積み重ねてプロットする
 ListLogPlot ▪ ListLogLinearPlot ▪ ListLogLogPlot ▪
 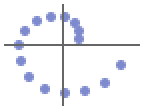 ListPolarPlot
 ListPlot3D — 高さの値のリストの3Dプロット
 ListPointPlot3D — 3Dにおける点の散布プロット
 ListLinePlot3D — 3D曲線プロット
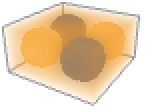
 ListDensityPlot,
 ListDensityPlot3D — 3Dおよび4Dの高さのデータからのカラーの密度プロット
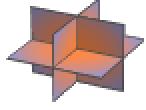 ListContourPlot,
 ListContourPlot3D — 3Dおよび4Dの高さのデータからの等高線プロット
 ListSliceDensityPlot3D — 4Dの高さのデータからの面のスライスにおけるカラーの密度
 ListSliceContourPlot3D — 4Dの高さのデータからの面のスライスにおける等高線陰影
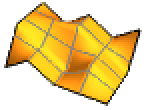
 ListCurvePathPlot,
 ListSurfacePlot3D — 点から曲線と面を再構成する
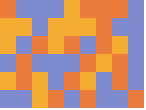
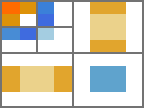
 ArrayPlot — 値または色の配列をプロットする
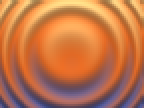
 ReliefPlot — レリーフのシミュレーションの配列のプロット
 MatrixPlot — 行列のプロット値
 ArrayPlot3D — 3D配列の値をプロットする
 TernaryListPlot — 重心座標を使って座標軸の三角に3Dデータをプロットする
日付と時刻の可視化 »
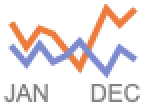
 DateListPlot,DateListLogPlot — 日付と時刻のプロット
 TimelinePlot — ラベルが付けられるタイムライン
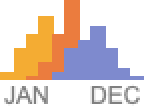
 DateHistogram — 日付または時刻のヒストグラム
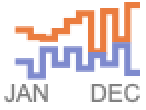
 DateListStepPlot ▪
 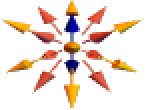 StackedDateListPlot
ベクトルの可視化 »
 ListVectorPlot — ベクトル場からベクトルをプロットする
 ListStreamPlot — ベクトル場から流線をプロットする
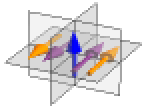
 ListVectorPlot3D ▪
 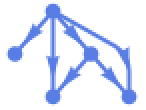 ListStreamPlot3D ▪
  ListSliceVectorPlot3D ▪ ...
グラフ化と情報の可視化 »
 BarChart ▪
  PieChart ▪
  BubbleChart ▪
  BarChart3D ▪ ...
統計的可視化 »
 Histogram ▪
  Histogram3D ▪
  QuantilePlot ▪
  BoxWhiskerChart ▪ ...
ゲージ »
 AngularGauge ▪
  HorizontalGauge ▪
  VerticalGauge ▪ ...
高次元可視化 »
 RadialAxisPlot ▪
  PairwiseListPlot ▪
  FeatureSpacePlot ▪ ...
グラフの可視化 »
 GraphPlot ▪
  LayeredGraphPlot ▪
  TreePlot ▪ ...
階層的データ可視化


表形式データの可視化 »
Grid ▪ Row ▪ Column ▪ Multicolumn ▪ GraphicsGrid ▪ GraphicsRow ▪ ...
集計データの可視化
 WordCloud ▪ ImageCollage ▪ ImageAssemble
地理学的可視化 »
 GeoListPlot ▪
  GeoSmoothHistogram ▪
  GeoRegionValuePlot ▪ ...
区間の可視化
 NumberLinePlot — 数直線上に点と区間をプロットする
離散関数の可視化 »
 DiscretePlot — 離散変数の関数
 ![]() をプロットする
をプロットする
生体構造の可視化
 AnatomyPlot3D — 生体構造の可視化
ウェーブレットの可視化 »
 WaveletScalogram ▪
 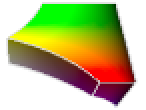 WaveletListPlot ▪
 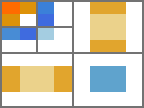 WaveletMatrixPlot ▪ ...
色空間の可視化 »
 ChromaticityPlot ▪
 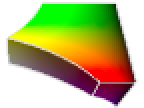 ChromaticityPlot3D
スタイルオプション »
Frame ▪ PlotStyle ▪ Filling ▪ Mesh ▪ ImageSize ▪ ...
ラベル »
PlotLabels ▪ Labeled ▪ Callout ▪ ...
凡例 »
PlotLegends ▪ Legended ▪ LineLegend ▪ BarLegend ▪ ...
注釈と組合せ »
Tooltip ▪ StatusArea ▪ Inset ▪ ...
エラーバーと不確かさ »
Around ▪ IntervalMarkers ▪ ...